Chapter 5
The data science education and leadership landscape
Abstract
This primarily people-oriented chapter takes a next step forward from the previous chapter on big data ethics to discuss the current data science education landscape, and how we are preparing next-generation knowledge workers to be the new leaders of IT.
Keywords
data Science
education
data scientist
university
academia
millennial
jobs
gender
“Education is the most powerful weapon which you can use to change the world.”
—Nelson Mandela
5.1. Introduction
We left off the last chapter discussing ethics in the ongoing Big Data Revolution, closing on a brief yet detailed discussion on the need to instill critical ethical competencies on emerging IT leaders and knowledge workers. However, that begs the question: who are these incoming data science professionals? Where are they coming from and what do they look like? How else are we preparing them to take on roles in an ever-changing and fluid data economy? And, perhaps even more thought provoking: how are they contributing to the next-generation of changes in how we work with and expect results from our technologies? When we think of both the new people and the new technologies emerging in the data industry, we can imagine a very interesting future indeed.
While most of this book is dedicated to talking about the people, processes, and technologies that will enable and drive a visual culture of data discovery, this chapter focuses solely on the people impacted and affected by the aforementioned disruption, transformation, and reinvention of the data industry at large. Likewise, it closes out a few very necessary conversations that are important as we consider the future of the data-driven organization itself. We will focus on new data science programs cropping up across the world (both in academia and in industry), as well as various other key areas concerning the new landscape of digital natives and millennials quickly overtaking the data workforce.
5.2. The new data science student
Let us start first with the educational portion of this conversation. Business as we know it is changing. Business users, too, are changing and becoming more empowered. IT is becoming less about control and more abut enablement. New data science job descriptions—like, for example, the data scientist—are springing up. Like so much else going on in today’s data intelligence industry, the landscape of data science education is every bit as fluid and dynamic. After focusing on the internal group of self-sufficient business users and the role of the data scientists, let us broaden our view to take a look at what the data science workforce may look like in years to come.
Over the past few years, we have been reminded that data workers are in demand—likewise, we have seen how limited the current supply is. If we are thinking purely in terms of those elusive unicorns with a terminal degree in hard maths, we can find little comfort in the results of a 2014 study by the National Center for Education Statistics that revealed just 1669 people graduated in 2012 with a PhD in statistics or related math degree—and only 323 were true statisticians. Don’t count on a big graduation day boom, either, as the need for qualified candidates is nowhere near keeping pace with the demand. When it comes to forecasting the number of computer science jobs in the next few years, the numbers are staggering. The US Bureau of Labor Statistics estimates that by 2020 there will be 1.4 million computer science jobs available. More specifically, a recent McKinsey Global Institute (2014) study estimates that there will be 140,000–180,000 unfilled data scientist positions in the market in 2018. Naturally, demands drives prices. A data scientist can currently command a salary upward of $300,000, making even one data scientist a hefty investment (without any guarantee of delivering usable business insights). Ouch is an understatement.
Don’t yet lose hope. Beyond the earlier disclaimer that data scientists are not the only ones who can bring discovery value to organizations, the paradigm shift in the data industry has not left the academic community untouched as they, too, are recalibrating to develop new educational programs that can develop the skills and education needed by incoming data science professionals. These University Information Science programs—whether labeled business intelligence, business analytics, data analysis, systems analysis, computer science, or any of the other dozen or so terms used by academia—are only just now beginning to be sorted out, much less keeping pace with the rapid rate of change happening in the industry. Nevertheless, alongside that slow-churning process of clarification, new programs are emerging to meet the increasingly complex demands of data science education.
Different universities are taking different approaches to craft a new kind of data science education. Some are reshaping existing curricula by unifying across academic silos to better integrate courses across disciplines of study. Others are forming academic alliance programs in deeper ways to give students learning experiences with contemporary industry tools and creating projects that expose students to analytical problems within real-world business context. Other universities are attempting to hone the skills of current workers through experiences, such as through on-line advanced degree programs or Massively Open On-line Courses. These are affectionately referred to as “MOOCs,” a general term that applies to simpler and more impersonal ways of education made possible by “outsourcing agreements between the educational sector and external providers of multimedia materials” (Baggaley, 2013, p. 368). (Beyond this, a number of organizations run bootcamps and independent training programs (eg, mentorships, certifications, etc.) or informal programs through web seminar series and partner-vendor training, too. However, a word of caution is in order. These programs still suffer from a lack of accreditation, and with such high demand organizations are jumping on the bandwagon to address these needs with less qualified courses and certificates.)
All universities are listening to campus recruiters—who are clearly saying that we need people with more and deeper data skills and knowledge. The new generations of knowledge workers need programs that offer practical applications through real-life situations and tools used to improve learning. Students who enter the workforce with only a study-based education will lack the hands-on skills that they need to be successful. Therein lies the rub: are the new academic programs being developed to meet the next generation of BI knowledge workers applicable to the jobs available, and will they be able to answer the business challenges industry segments are grappling with today?
Academics and industry alike need sharp criteria on what will make good business intelligence and business analytics programs for the next generation of BI students. Here a few points worth of consideration:
5.2.1. Managing complex systems
Today’s data intelligence industry is not merely about information: it is about understanding and managing complex systems. Data discovery environments are an iterative process of moments of execution followed by celebration. This is not new—and it is been a focus for many information science programs of the past—but it is particularly relevant for data science today.
Understanding complex systems is about modeling, more so than describing or predicting. It is about understanding relationships and discovering them. While on the surface, data science looks like a lot of calculations, what is underneath are the end products of a long process that struggles with trying to understand complex systems.
5.2.2. Continuous learning
Innovations in data science and their success stories may give the perception of “if you apply tool/algorithm to <insert business problem> you will be successful,” but it does not work that way. Under the covers in a lot of those tools and algorithms are a lot of “I gotchas:” hundreds of assumptions that are made about what the data is really telling you and the validity of applying certain algorithms to data.
More so than ever, business intelligence and data science is a craftsmanship challenge that is focused on continuous learning—this time of learning art, rather than only science (because the scientific aspects of the equation are still and will continue to be, important). The industry is accompanied by a new wave of technology that has a lot of aspects of immaturity: it is not ready for prime-time to the masses. The implication, then, is that it is a very eclectic area, able to come up with new ideas from a very diverse spectrum. We talk a lot about agility in the industry these days, and that is a now nomenclature that applies as readily to business, as it does to people and technology. There is a challenge in operationalizing analytics where data science needs to monitor and tweak analytic models on a regular ongoing basis with the IT authority to do so. This is a different mindset than traditional BI.
The challenge for the new data student is to come out of a program and present themselves to a prospective employer as capable to confront new business challenges with a very wide array of ideas, insights, perspectives, and tools in their repertoire. Academia likewise is challenged with delivering an eclectic education, rather than installing a clean box around a rigid subject matter.
5.2.3. Blending research and practice
To move forward, the whole area requires a blending of academic research and industry practice—not either/or. Reflecting on the past ten years shows excellent innovation in creativity, and while that process needs to continue, we also need to define the kinds of data problems we are confronting today and the kind of data problems we see on the horizon.
One example is machine learning: this emerging discipline is counterintuitive for a traditional statistician or systems analyst, and it is very counterintuitive to an intelligence engineer designing dashboards. The classic black box approach of jumping in, turning the crank, and popping out numbers no longer applies. With a blend of academic research and industry practice, we can construct a very effective pile of algorithms to sort through a pile of very messy data.
True data science leaders need to assume responsibility of educating and nurturing a variety of people in their ecosystem. There are a lot of ways of doing that: luncheons, symposiums, and mentorship—to name a few.
5.2.4. The reality
It is an unfortunate truth that partnering between academia and the outside world does not always work. Traditional academics simply do not embrace industry in a cuddly fashion, and business does not typically invest in the kind of research that satisfies academic standards. In the end, it can result in something of a philosophical standoff.
Even so, educators are responding to a sense of urgency to meet the changing leadership demands in information technology and data science by developing new academic programs focused on continuous, prescriptive learning, and an integrated education model between academia and industry. However, preparing next-generation technology leaders does not stop at technical competency and business acumen alone. In addition, educators must also recognize the ethical implications of the emerging big data era, and foster the development of ethical leadership through a competency framework of ethics, emotional and cultural intelligence, adaptive and transformational leadership, and critical thinking, as discussed in chapter: Navigating Ethics in the Big Data Democracy.
5.2.4.1. A snapshot of integrated education in technology
We talk about “best of breed” technology approaches all the time. Let us not be shy about applying this to the concept of new types of data science and business analytics education. Many researchers in the academic literature have proposed the use of an engaged, interdisciplinary approach between industry and academia to enable a blended model of education. And, the good news is that we are starting to take action on that prescription. In December 2012, the Association for Information Systems (AIS) Special Interest Group on Decision Support, Knowledge, and Data Management (SIGDSS) and the Teradata University Network (TUN) cosponsored the Business Intelligence Congress 3 (BIC3) research and companion surveys to assess the current state of business intelligence education (Wixom et al., 2014). This research resulted in five notable findings: program offerings in BI/BA have dramatically increased; access to and use of pedagogical teaching resources has increased; demand for students continues to outplace supply; foundational skills—including communication, SQL and query, basic analytics, data management, and business knowledge—remain the most critical; and, employers are unsatisfied with the practical experience of graduates (Wixom et al., 2014).
5.2.5. New university programs and vendor participation
New university programs are emerging to meet the complex, yet specific, demands of a data science education. The number and depth of new business analytics and data science program offerings has seen significant increase since 2010: as of the publication of the BIC3 research findings, there were a total of 131 confirmed, full-time BI/BA university degree programs, including 47 undergraduate level programs (Wixom et al., 2014). Today, that number continues to rise dramatically, with programs at the undergraduate and graduate level alike springing up at accredited institutions across the country.
Take a look at Figures 5.1 and 5.2. Created by visual artist Ali Rebaie, these graphics—representing the United States and the world, respectively—show the new data science programs cropping up to meet the demands of data science education to prepare incoming knowledge workers. The darker the bubble, the more densely packed the availability of newly created data science programs in that region. Note that this visualization shows both undergraduate and graduate level degree programs only.
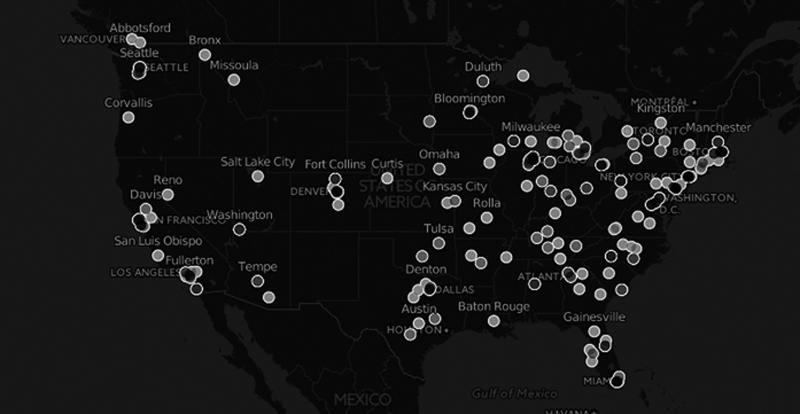
Figure 5.1 Data science programs in the US (Source: With permission from Rebaie Analytics Group, 2015).
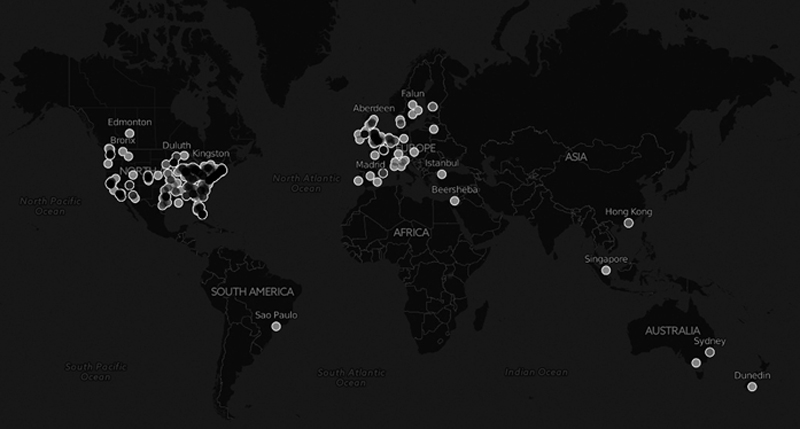
Figure 5.2 Data science programs across the globe (Source: With permission from Rebaie Analytics Group, 2015).
BIC3 survey findings also reported that 296 out of 319 university professors (based on survey responses) are leveraging one or more business intelligence or analytics software programs to support teaching efforts in the classroom, coinciding with increased investments by vendor organizations to offer resources to academia at free or reduced costs (Wixom et al., 2014). The academic alliance programs measured by BIC3 responses included Microsoft, Teradata University Network (which includes solutions from KXEN and MicroStrategy), IBM, SAP, SAS, and Oracle. Other industry vendor organizations are also providing substantial support to the educational efforts in the academics. For example, among its many education-focused programs, Tableau Software, an interactive data visualization vendor, provides Tableau for Teaching, a free, course-long license for instructors and students when the technology used is part of the curriculum (Tableau, 2014). Currently, Tableau for Teaching is in use by more 800 classes worldwide—including institutions in South Africa and Singapore—in any given semester.
Another vendor organization doing their part to add to the collective knowledge of the blended education model is SAS, which supports a wide array of STEM initiatives in both K-12 and higher education. JMP, a division of SAS that produces interactive software for desktop statistical discovery, also has roots deep inside the statistical community and education, and we will look at a specific example of how JMP has contributed to advancing visual data literacy in chapter: Visual Communication and Literacy.
5.3. The new digital native
It would be fair to say that a new kind of education and approach to train incoming knowledge workers is not the only factor affecting the change in the data science education landscape. Nor are new technologies and business needs are not the only disruptors of business as usual today. With the rapid entrance of millennials inside the business, the very face of business is literally changing. It is getting younger, smarter (more educated), and, most important, more digital. This will (and already does) initiate a ripple effect, as it is an important contributor to how BI-as-usual continues to evolve and change across all verticals of industry now and in the years to come.
The revolution of technologies like the Internet, mobile devices, and social media has created a new digital ecosystem most adopted, understood, and exploited by millennials—a term used to describe the generation born after 1980 (typically assigned the range of birth years that occurred between 1982–93) and to the first to come of age in the new millennium. As the largest cohort of demographics, the millennial generation is the biggest in US history according to the US Census Bureau—which makes them even bigger than the Baby Boomers (Check out the interactive visualizations on Goldman Sachs that tells the Data Story of Millennials at http://www.goldmansachs.com/our-thinking/pages/millennials/.) What is more, is that now millennials are not only reshaping the workplace and all that comes with it, but they are also generating the new crop of tech users, too. In 2014, millennials gave birth to 85% of the new babies in America (Mims, 2015). Thus, expect the rapid advancements and changes that are happening now to increase exponentially in the future.
Self-identified as “digital natives,” millennials have fused technology with their lives and are increasingly more and more mobile, as well as utilizing personalized analytics provided through wearables and other mobile technologies (more in chapter: Visualization in the Internet of Things). A 2010 Pew Research Center report noted that the use of modern technology is 24% of what makes the millennial generation unique from its predecessors. However, millennial workers are not merely tech savvy—they are tech hungry. They have an inherent appreciation of—and an innate curiosity in—the way we approach and understand technology. They are eager to innovate and pioneer new ways of thinking and doing. They expect to use technology, too, and have little patience when it is overlooked or not used to its fullest capability. This translates directly into how millennials expect to see information, how they communicate and understand data, and how they explore data to uncover insights that translate into business value. Other recent statistics give more insight into how millennials affect the design of technologies of tomorrow, especially interactive and social technologies from smartphones to websites to mobile and SaaS apps that need to be more usable, self-guided, hiccup-free, and offer more efficient user experiences than ever before. By 2017—next year—millennials will not only have a big chunk of the workforce in their hands, but will also comprise the largest online audience with more buying power than any generation before them. This will only add to the already 50% of e-commerce coming from smartphones and tablets—this is now designated as m-commerce (“m” being mobile) (Wobbrock, 2014).
Millennials are on course to become the most educated generation in American history, partly because of the demands of an increasingly knowledge-based economy. According to Pew Research estimates, this new breed of knowledge worker will have overtaken the majority representation of the workforce by 2015; by 2030 they will make up 75% of the workforce—or the Millennial Majority Workforce, as it has come to be called. In other words: get ready. Looking at these numbers, the odds are pretty good that if you are reading this book, you may even be a millennial yourself.
In September 2014, Elance-oDesk and Millennial Branding (a Gen Y research and management consulting firm) commissioned an independent research study led by Red Brick Research to better understand how millennials are positioned to take over the workforce and the key business skills required to remain agile and innovative, while keeping up to date with the emerging technology. According to the official press release of the study, the survey was fielded in the United States among 1,039 millennials aged 21–32 years old, with a bachelor’s, master’s, or postgraduate degree, and 200 hiring managers aged 33+ years and responsible for recruitment or HR strategy within their various industries and business. For clarification, for the purposes of this survey—which weighed millennial results to ensure demographic representation across the sample—birth year ranges for millennials was 1982–93 consistent with the range given previously while Gen X was within the birth year bracket of 1959–81. Let us look together at a few key findings of the research, and how they fit into the context of this conversation and support various points made so far:
Millennials are seen as bringing unique skills to the table—especially since they are the first generation of “native technologists” (whereas the following generation, Generation Y, and even younger generations are growing up in pure Internet access and telecom enabled world, having never known life before texting or smartphones and tablets)
• 68% of hiring managers agree that Millennials possess certain skills that previous generations do not have
• 82% of hiring managers agree that Millennial are more technological adept
Millennials have skills that drive innovation, including hot STEM skills
• Millennials can learn things more quickly (74% of millennials and 60% of hiring managers agree)
• Millennials are more likely to come up with fresh ideas (71% of millennials and 57% of hiring managers agree)
• IT is the highest-ranked skills in terms of shortages. However, skills in 3D printing, cloud computing, wearable technologies, Internet of Things, and Data Visualization are among the highest emerging skills possess by millennials (Box 5.1)
Box 5.1 Why i taught my seven-year old data visualization
Beginning in 2009, March has been home to National Pi Day (cleverly 3/14)—a day meant to celebrate the mathematical concept of Pi. (Pi Approximation Day—or 22/7, is observed less ceremoniously on July 22.) Ever since its earliest official observance by physicist Larry Shaw at the Exploratorium in San Francisco in 1988, Pi Day has been celebrated in many ways—including eating pie, throwing pies, and discussing the significance of the number of Pi. MIT even uses the day to send out its formal acceptance letters. Coincidentally, Pi Day is also the birthday of Albert Einstein, who was born on March 14, 1879.
In the data industry, Pi Day is also the birthday of the #onelesspie movement by vendors SAS and JMP. In the world of data viz, #onelesspie uses Pi Day as the hokey-but-fun motivation to clean up the data visualization world one pie chart at a time (especially those Wikipedian pie charts that have a nasty habit of finding a place at the top of the Worst Data Visualizations list). This is something I think we all can agree is a mission worthwhile!
In celebration of Pi Day 2015, I took the opportunity to kill two pies with one viz. First, by making a new data visualization from a pie chart of old, and second, by asking my (at the time) seven year old, Wake, to do it with me. With the need for visual data literacy continuing to be more and more important as we prepare younger generations to engage in a new data culture, and with more and more tools actively working to become more self-service for nontechnical users, this seemed like the perfect opportunity to share in the movement in a meaningful—and unique—way. It is never too early to start teaching younger generations the important math, data, and analytical skills that will serve them well in their data-driven future. And, having access to some of today’s leading self-service data visualization tools was a great opportunity to give him some hands-on experience with the tools already being used in organizations today (not to mention assess just how self-services these tools really are to the inexperienced user).
My son’s first actions were the ones I expected. He took to Google to search around to find a small set of sample data and a traditional pie chart worth reworking, and then start thinking about fun ways to visualize it. To begin his analysis, he stumbled across a foodie blog, which featured a traditional pie chart that had been made using data from a 2008 Schwan nationwide poll on America’s favorite pie flavors. His analysis of the chart was (and you cannot argue with kid logic): “that doesn’t even look like a pie.” As he explored different ways to look at the data, I was intrigued to hear his untrained, innately curious mind thinking up new ways to tell a compelling story with the data. Eventually, the data made its way into Tableau, where he created a packed bubble chart to more easily “see how many people liked a pie by the size of its bubble.” The data revisualized, his inner artist was released and he then moved on to Adobe Photoshop, where he used stock photography images of the corresponding types of pies to layer images of each pie flavor over the bubble to tell a much more “delicious” data story (see Figure 5.3).

Figure 5.3 The before and after images of America’s favorite pie chart in its original form, compared to the revisualized “Pie” chart on www.WakesPis.com
Sure, there may be some technical flaws with Wake’s visualization, and it is by no means comparable with some of the breathtaking and highly curated advanced data visualizations out there today. I dare say there may not really be statistical significance to his chart, either. But, the mechanics aside, as a first time experiment by a seven year old just beginning to dabble in data analysis and visualization, it is an example of how we can (and should) train young minds to think about, visualize, and tell stories about data in new, compelling, and meaningful ways.
I thought the Pi Day experiment would end there, but it did not. Inspired by his newfound love for data visualization, Wake has continued to revisualize other data sets to continue telling his delicious data stories using a handful of viz tools—including Tableau, JMP, and Qlik Sense. He is even started to build his own surveys to collect and work with his own data, too. I might be unknowingly raising a future data scientist.
See more of Wake’s “pies” at www.WakesPis.com or follow along with the social conversation at #wakespis.
These numbers and findings provide the insight and framework we need to build up new workers and empower them to be successful—and make our new era of reinvention even more successful. However, effectively doing business in today’s highly digital world requires more than just data scientists and big data—it requires an eagerness to continue to be disruptive and create new ways of thinking about how, why, and for what purposes we use information to be competitive. Likewise, it requires just as much insight into how millennials see and interpret insights into data, and how they use new approaches—including those garnered by being brought up in an era of visual technologies—to discover business value within data. I would expect to see many new changes over the next few years as some of these predictions become a reality and timing milestones are met.
5.3.1. Leadership qualities of the millennial leader
Ultimately, hard skills reign as millennial data workers are expected to be equipped with technological competencies and business acumen—those learned skills that we can teach through new models of blended education. A bare majority of hiring managers (55% of the Elance-oDesk and Millennial Branding study) say that they will be even more skills-focused in the new workforce, which is a shift from previous research (as recent as 2013) that put soft skills more important than hard technical skills. However, personality and leadership skills will always be important, and these attributes are expected to bubble back to the top of the hiring criteria, as skills become more evenly distributed and obtained through the new workforce. Unfortunately, for as creative and optimistic as millennials are perceived to be, there still remains an unflattering belief that millennials are more narcissistic, money-driven, and self-centered than previous generations (see Figure 5.4). Naturally, millennials widely disagree with these blemishes on their character (who would not). This begs leadership capabilities back to the forefront of the conversation, perhaps even earlier than hiring managers expect.
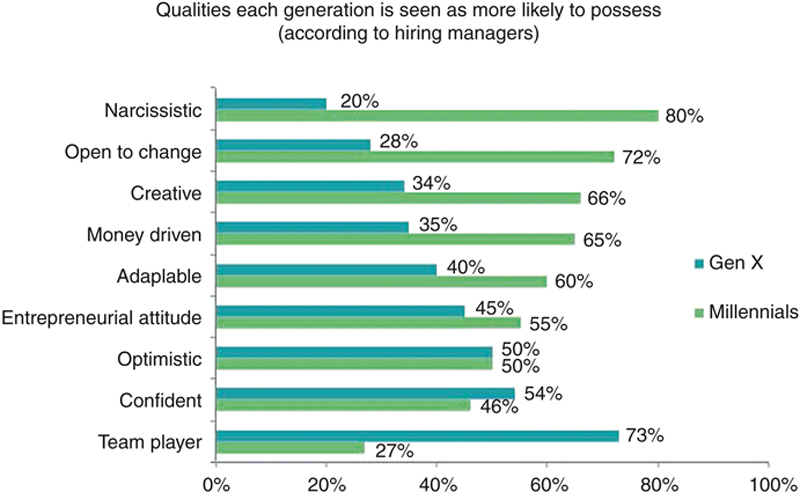
Figure 5.4 The perceived personality attributes of the millennial generation compared against their Gen X predecessors
Having a background in leadership (a course of study wherein I earned my graduate degree) and fitting nicely into the millennial age group myself, several years ago I blogged regularly for a website focused on leadership topics for the millennial (aptly named MillennialLeader.com). One of the blogs I wrote in mid-2012 focused on what I called the H-Qualities for new leaders, which paired leadership capabilities with the set of special considerations we touched on already in the previous chapter to reinforce ethical and mindless leadership skills in new leaders—regardless of industry. As the tide of techy skills swells and then inevitably begins to retreat, let us take the opportunity to repose those same characteristics here so that we can keep them in mind going forward.
5.3.2. Humility
One of the most desired leadership traits is confidence. We want leaders who are confident in themselves, in their followers, and who have the oomph to lead us through the peaks and valleys of life. However, over-confidence can mutate into arrogance and stall a leaders’ progress. Leaders must have the emotional intelligence to keep their confidence in check and stay humble (before it bleeds over into ego and narcissism). They must remember that the responsibility of leadership is not only to guide and motivate others, but also to serve them. Leaders must be confident enough to lead, but humble enough to remember why they are leading. Leadership theories and models including emotional intelligence (explored in the chapter previous), servant leadership (formalized by Robert Greenleaf’s research) and transformational leadership readily apply here.
5.3.3. Hunger
Today’s leaders must be hungry. They must be eager, growth-oriented, and willing to go the extra mile to make a difference. Leaders are not spoon-fed opportunities. They must go after them, looking for the chance to make a change, to be innovative, and to set themselves a part from the herd. Leaders must have courage and ambition, and be ready to take on challenges. They must be hungry for new opportunities, for the chance to lead, and for new information. Recall earlier discussions for chapter: Separating Leaders From Laggards, on disruption, transformation, and reinvention. Hunger for new information, new insights, and new ideas drive these into reality. Creativity is one of the resonating personality traits of the millennial leader, and hunger is a function of that.
5.3.4. Happiness
Finally, it is a matter of taking grit with grace. Being a leader is not an easy job, and it can be filled with trials and setbacks. It is important for a leader to remain focused, stay positive, and have the capacity to persevere in challenging times. Maintaining a positive mental attitude and modeling this behavior aids in keeping the morale and loyalty of followers high. Leaders should approach the world from a “half-full” perspective, and stay positive as they continue to drive change in a positive way. An alumni article from New England-based business school Bentley University dubbed this the “unbridled optimism of millennials,” and it will be a motivating force going forward with continued complexity, privacy, and governance challenges.
5.4. Addressing the gender gap—women in IT
For all intents and purposes, it would seem that we at least have a handle on taking the appropriate next steps to work to mitigate the impending deficit for knowledge workers. Along with awareness and research into the needs and trends of the industry and the emerging workforce within it, we have made an incredible amount of headway in implementing new educational programs to meet these needs, with both academia and industry actively contributing to this goal. This is no small feat, and it is a big step forward. However, there is—as always—more work to be done.
Even with these advancements and a mass availability of computer science jobs coming in the near future, there are still some big issues that we need to address to maximize their potential and find new and improved ways to source more talent and make sure we are tapping into all available sources of next-generation knowledge workers. One of these is to recognize the continued gender gap between men and women actively working (and pursuing both STEM education and careers) in the larger data industry. As contrary as it may seem, women continue to be under-represented in current positions and are likewise not enrolling in programs to nurture their development along this path, perhaps due to long-standing biases or ongoing socialization deficiencies. While high-profile women in the technology industry—like Yahoo! President and CEO Marissa Mayer or Facebook COO Sheryl Sandberg have vocalized some of the struggles of women in IT, it is not enough. In fact, it is not even at a point where it is steadying out with the possibility of improving and new trends beginning to climb upward. It is actually going down, though there is no ready explanation as to why. Nevertheless, today women are still sliding along a downward trend in their opportunities to move into these positions. Beyond the gender gap issue, simple math says that with less bodies going into programs and preparing for new roles and jobs in data science, that filling these jobs will be further impacted.
To catch up supply with demand for knowledge workers, educational organizations are working to meet this need by developing new undergraduate and graduate level courses—we went through these numbers already. Reiterated again here, another layer of insight is that though the numbers (both in types and accessibility) of these programs increase, the number of women in rolling in these programs is actually decreasing. According to the National Center for Women & Information Technology (NCWIT), in the mid-1980s, 37% of computer science majors were women compared to only 18% in 2012 (Gilpin, 2014). This directly translates to how many women are actively working in computer science professions, both in the United States and abroad. For example, in the US in 2013, women held 26% of computing jobs, down from 35% in 1990 (American Association of University Women, 2015). In the UK, only 16% of the 1,129,00 people working in IT were women in 2013 (Ranger, 2014). Similar trends were seen in other countries, such as Australia and Japan. Thus, we can infer this as not only a US problem, but a global one.
The simple truth is that women are hired into IT professions at significantly lower rates than men (McKinney et al., 2008). One explanation for the underrepresentation of women in computer science jobs is their inability to hire into these positions. But why? For one, prejudices and biases contribute to the hiring process, as women are perceived as less competent in math and tech than men (Peck, 2015; Reuben et al., 2014). Some companies are working to overcome this by focusing on diversity in the workplace, however it has yet to make the leap from lip service to practice. Discrimination continues to contribute to the low percentage of women in STEM careers, with men twice more likely to be hired than women (Reuben et al., 2014). Another possible explanation for lack of career entry is the fact that women appear to be under-socialized in IT positions, with a fear for job security and flexible working conditions stalling their entry into the field (McKinney et al., 2008). Moreover, women with less access to female role models along their learning and career maturity pathways, especially around the technical or social aspects of the profession, may be less likely to remain or succeed (McKinney et al., 2008). Therefore, women with less access to role models or lower levels of learning may be less likely to succeed in IT careers, which offers a plausible explanation for their continued—and downward—representation. (So, while such strong female leaders like Mayer and Sandberg are leading the charge, this is a mission that should be echoed throughout all tiers of the organization, as well as academic institutions, to drive change from the bottom up). Ironically, once in a position women surveyed have said that they do feel supported by supervisors related to their careers (at least, their perception is more so than that of their male counterparts, though this finding was supported by only a p-Value of .05).
While understanding women’s motivations to or not to pursue computer science education—or advance in education—is ongoing, it is worthwhile to note that studies that have sought to understand differences between male and female perspectives (regarding socialization, experience and attitudes of experience) in the IT profession have uncovered very little that could be considered statistically significant. However, in a set of 2008 findings, the two most significant imbalances were in comfort with technical language and confidence in technical skills (these last two were supported by p-Values of .001, which many revere as the holy grail of statistical significance).
All of this said, younger girls have demonstrated remarkable proficiency and interest in computer science. This is evidenced by programs such as Hour of Code, a campaign to advocate for more computer science education launched in late 2013 by Code.org. By the end of its first week, 15 million students had written more than 500 million lines of code, and over 50% of the participants were women (Gilpin, 2014). Further, to support early data socialization, an insurgence of gender-neutral “Learn to Code” books have begun to be marketed toward early learners, including titles like How to Code in 10 Easy Lessons: Learn how to design and code your own computer game by Sean McManus, that helps young readers get familiar with computer coding and write simple code in HTML, or Coding for Kids from the Dummies Series, designed to teach elementary-to-middle-school-aged students core concepts to building games, applications, and other tools (Box 5.2).
5.5. New roles for new leaders
Data scientists are not the only new job title that will be (or is already) on the list of those persons most in demand in our new data economy. With new types of leaders and new types of business to lead, there are—as you would expect—also new types of roles emerging within organizations (Box 5.3). And, like understanding how new types of workers will affect, how we work in the future in general, understanding what kind of people are currently “doing” data visualization will help us to see trends and patterns that may influence the new types of roles that we can expect to see starting to emerge, too (Figure 5.6).
Box 5.3 Millennials, hipsters, and yuccies – oh my!
Self-proclaimed millen-intelligensia David Infante (2015) wrote a brilliant article on Mashable entitled “The hipster is dead, and you might not like who comes next.” If you find yourself either in or trying to understand the millennial demographic, Infante’s article would likely spark your interest—after all, one nitpicky requirement of this generation is that they do (as Infante notes) prefer to be snarked in precise terminology (probably because a lot of us are English majors).
We know what millennials are. We are all familiar with the hipster trend (for the record, there are two types of hipsters—those real and their marketed facsimiles). So, what are yuccies? According to Infante, these are Young Urban Creatives (YUC), “borne of suburban comfort, indoctrinated with the transcendent power of education, and infected by the conviction that not only do we deserve to pursue our dreams; we should profit from them.” These are the segment of millennials that are hopelessly creative to the point of creative entitlement in their flavor of art and flourish with new technology. Yuccies define themselves by how much something validates their intellect. In short, if you are looking for your next-generation, digitally-native, and rapidly visual new artists, thought-leaders, and innovators within the millennial generation, you might be looking for a yuccie.
As a sidepiece along with Infante’s article, Mashable released – as it is want to do – an Are You a Yuccie quiz. Of course, I took it. According to my results, I am such a yuccie, “it’s insane” (Figure 5.5).
Figure 5.5 A snapshot of my personal yuccie quiz results

Figure 5.6 This chart, created by Beehive Media, might surprise you as you discover what kind of people do data visualization. Likewise, it provides food for thought on the data viz jobs of tomorrow (Source: With permission from Beehive Media, LLC, 2015. Data collected via an online survey on May 13–14, 2015. The link to the survey was shared via Twitter, Linkedin, and Google+ and RT’s and Fav’d a bit, resulting in some respondents outside my personal network. There were a total of 95 responses as of 12:00 pm EDT, May 14, 2015).
While new data roles will be plentiful, many, like the data scientist (or, the new “data wrangler”) will more than likely be highly technical in order to work with new modern data technologies, architectures, and programming languages. Many other new positions will begin to blend these analytical skills with other highly-sought after creative talents—like graphic design and visual artistry—and still others will arise in the communications arena to continue to help making visual information meaningful. Going forward, we can expect to see new roles in data that blend science, art, and communication—and we can see them in layers of organizational hierarchy ranging from the lowest levels to the most senior of executives (Box 5.4).
Here are a few that are beginning to gain traction and recognition now, as well as some that you can expect to add to your payroll within the next few years:
5.5.1. The data visualization analyst
With more emphasis on data visualization than perhaps ever before, along with the expectation that these visualizations are—at a minimum—animated, interactive, and highly curated, the role of the data visualization analyst is to take vast amounts of information and condense it down into the appropriate graphs, charts, maps, or other data-driven infographics to effectively display the information. Of the roles I will call out in this section, this role is the most technical in skillset, with the need to have a sufficient depth of understanding of analytics and analytics tools to be able to process data from various sources (as well as extract, transform, and load the data into the required form) to make it meaningful and within context.
This person will need fairly sophisticated programming language skills to either build (develop) or at a minimum use self-service oriented user tools to design a proper data visualization, and thus may be more readily pulled from a data science background and trained up on user experience (UX) skills. Unlike a true visualization curator or designer, this analyst will likely be the one using commercial visualization software or hand-coding them in JavaScript.
5.5.2. The visualization curator/designer
This is a job title I have seen thrown around throughout academic institutions (sometimes calls a “Data Visualist” or the more ambiguous “digital information media designer”) and within various journalism fields. Ms. Kennedy Elliott, currently a Visual Journalist from The Washington Post, spoke at the 2015 Tableau Tapestry conference, leaving behind this inspiring quote: “Whether journalists know it or not, [we] are increasingly moving toward human-centered design in data narratives, and applying this [human centered-design] will explore uknowns.”
Typically, these job roles are nested somewhere in the media arts and design functional groups, and focus on experience and interest in data visualization and infographics across platforms (including web, video, print, and mobile). The typical candidate is/will be someone who has a journalistic or storytelling background, along with a level of expertise in graphic design and other artful considerations. Usually, this role would also have an applied interest and contribution to visual communication with specific expertise in certain media area (one job announcement I saw for this position, located in Berlin, was looking for a visualist who had experience with both infographic designs and geoscience tools—or their “weapon of choice”). While the position tends to err on the side of graphic design, expect to see a blend of computer science and data analysis education, too.
5.5.3. The data storyboard artist
The data storyboard artist is a role first conceptualized by a colleague and friend at American Family Insurance. When creating a film, a storyboard is central to conveying the expected flow and climaxes of the script. Though not as detailed as a script—nor as visually complete as a true data visualization—it still has the power to convey points of view, visual perspective, and pace. Various types of data teams (whether BI teams, analysts, or other data workers), like directors, benefit from a role geared toward converting dry data requirements into compelling storylines and keeping the team on track to achieve the value of finding and applying analytical insights.
The goal of the storyboard is to communicate how the story around a solution to working with new data can (or should) unfold. It is not a pixel perfect user interface prototype or set of sample reports. Its emphasis is simply on the interactions necessary to achieve a solution to a business problem. They are decidedly low-tech, but require some visual skills. Thus, the data storyboard artist is comfortable with visual communication, and likely has some illustration skills of some sort (whether drawing or diagramming). Since the storyboard will be used in a variety of settings with both technical and nontechnical audiences, it is important to pick someone who is adept at working and communicating with a wide variety of people. This person should be familiar with the technical aspects of the solution, and the business functions that will use it.
5.5.4. The chief storytelling officer
The title of a 2002 book by David Armstrong, the role of the chief storytelling officer (or CSO) is a thoroughly modern title that is currently gaining corporate momentum. As of May 2015, LinkedIn listed two dozen executives who have held CSO positions, a trend that is cropping up more and more but may have actually begun at Nike in the 1990s (their then CSO Nelson Farris was attributed with the following quote in a 1999 Fast Company article: “Our stories are not about extraordinary business plans or financial manipulations…They’re about people getting things done” (Grothaus 2015).
Like the data scientist—which is part business and part mathematician—the CSO is another twofold role that is part editorial and part graphical. These are the story champions of the organization that align the informational goals of the business alongside a virtual library of relevant stories that translate information goals and needs into meaningful communications. Of course, organizations are by no means strangers to telling stories, especially those internal (think press releases or when a new organization launches or goes through major change). But, a CSO is a role that is more than simply sharing information. This requires crafting a true, simple, and emotionally impactful story. This role must carry the ability to engage and inspire loyalty from both employees and customers; it should be a compelling narrative that articulates the organization’s mission and vision, and makes it memorable. The exercise of storytelling is—as we will soon discuss—a creative way to think about strategy.
As you might have noticed, these roles are a heuristic blend of art, science, and communication. That will be the new norm. And within them there is a certain theme that seems to invariably rise to the top. No matter how visually driven, or how data-oriented, or even how strategy-focused, we keep seeing the word storytelling become a critical element in positions of the future. This is where we will spend a future chapter: exploring the art of storytelling, and what it can and must do to contribute to a visual data culture.
5.6. The steps beyond
Moving away from specific discussions on demographics and emerging leadership, and as we begin to level off into a stabilized and tactical approach to visually working with the massive data sets in big data, we can expect to see a few major themes in both our new knowledge workers and our new roles that are at the core of the conversations of the first section of the book as a whole. These themes are specialization, education, automation, and the true emergence of modern visualization.
The first, as hinted at in the job roles listed previously, is specialization. What is currently somewhat of a niche field (or, at least somewhat indistinct) will becoming more defined—and ever more blended as people join the field and delineate skill sets to nurture the needed expertise in different functional areas and hierarchy. Larger or more specialized firms may build a strong internal data visualization department, or they may deploy a Data Visualization Competency Center (we will touch on both of these in chapter: Data Visualization as a Core Competency), while smaller or more niche firms may reach out to the broad pool of freelancers and agencies that concentrate in these areas. Customers and internal users demand more because they are exposed to such high standards of design in visualization in their everyday lives—business or personal. The most successful visual companies will have to compete with the best designers on the market even with internal visual communication competencies.
Next is education. While data science education is fundamentally based on math and statistics and on the rise already, some cutting-edge universities are already bringing in curriculum to support data visualization education. Traditional visual media or graphic design programs will continue to become more enriched with technologies and education on foundational data analysis principles; likewise data analysis education will put an additional premium on visual design and data visualization mechanics and evolving best practices.
Automation—or the continued evolution of self-service and self-sufficiency—will continue to automate a best practices-led data visualization process for users of varying skillsets and experience. Many visualization tools will continue to build guardrails to support users, while embedding educational components to foster continued growth and competency in these areas.
Finally, we will see the emergence of a truly modern visual culture. While data visualization has only recently received a serious rejuvenation from its ancient roots, we are just now beginning to really tap into the potential of data visualization in a big data-centric economy. Much confusion or inconsistencies still surround the use of data visualization, and how it can be used for visual discovery and visual analytics. Eventually, these pervasive changes will ironically be the death of data visualization, as what is now considered “good” data visualization will cease and turn instead into an expectation that data visualization is. To close the circle on discussions begun in chapter: Separating Leaders From Laggards, this is where we find the tipping point of the visual imperative. As the visual dimension of culture becomes increasingly dominant, driving the need to create a visual culture of data discovery, we must prepare for even greater changes with new data opportunities brought by the growing Internet of Things and advanced by a brave new world of knowledge workers.
..................Content has been hidden....................
You can't read the all page of ebook, please click here login for view all page.