Chapter 8
Building a Strong Financial Table
Up to this point, I have covered the principles of The Wealth Code. The key to preserving and growing wealth is understanding that the world is a lot bigger than stocks and bonds and that the most successful portfolios are ones which include many asset classes, which work together like an Olympic basketball team.
The goal of this chapter is to provide a framework for you to control your own destiny, to build your own financial table. I want to take the mystery out of the planning process and give you a solid foundation for building a blueprint for your investments, one that matches your personality and risk tolerances. You can then hand this over to a competent advisor to implement and oversee, knowing the plan truly is in your best interest and not someone else’s.
I describe most people I see at my firm as rafting down a river. The problem is that this particular river has a very large waterfall at the end. Most people drift down the middle somewhat aimlessly hoping for the best, and of course, we know where this drifting eventually takes them: to retirement and investment results that are far short of what they had envisioned. The key to navigating this river is to find the small offshoot, the side stream hidden by the brush, and to steer your raft to it and to the end, where you arrive at a nice sandy beach, a restful place where you can have a bountiful picnic with your family, without a care in the world. In order to spot the side stream, education is the key. Being able to recognize the alternative is 90 percent of the battle and takes five crucial steps.
Step One: Know Yourself
I will describe this step from the viewpoint of a financial advisor.
The first rule for any financial advisor is to know the client: his or her goals, background, income, future income needs, expenses, investments, estate planning, insurance and insurance requirements, taxes, college needs, family planning, past disappointments, and so forth.
Without understanding the client and putting down on paper all of the above, and reviewing it frequently, it is impossible to design a good plan. You can’t make a bull’s eye on an invisible dartboard.
Here is a list of common questions to help fill in the pieces of the puzzle:
General
Real Estate
Investments
Life Insurance
Estate Planning
Asset Protection (Lawsuit) Planning
Finally, a general understanding of the person’s background, culture, beliefs, bad experiences, and good experiences will round out the information needed.
Step Two: Liquidity Time Lines
Crucial for designing an appropriate portfolio is understanding each client’s needs for lump sum money or future income.
Examples would be:
It is important to have emergency money for those what-if needs, but as previously mentioned, very few large emergencies ever happen, and keeping money tied up in low returning, liquid savings accounts will end up costing small fortunes in missed opportunities and losses to inflation over time. Three to six months of liquid reserves is a typical safety net. If someone has a lot of cash flow, then safety reserves can be even lower.
Personally, I feel the best safety nets are lines of credit on real estate. If you have a line of credit worth $100,000 on your home or investment property, keep the balance at zero. If the what-if emergency does happen, write a check and pay for it. Then pay back the line of credit as soon as possible. At least you will be able to deduct the interest. In the meantime, while that what-if emergency is not happening, you don’t have money sitting in a savings account earning 1 to 2 percent and losing purchasing power by the day.
Varying the timelines of the real asset investments is also a way to keep money available for whatever comes your way, either a better investment or other opportunities. By designing a portfolio with different maturation dates, money increasingly becomes liquid as time passes. This concept is the same as a CD ladder or bond ladder, but I like to do it with ownership of tangible assets.
No one knows what the world will look like three to six years from now. Designing a portfolio where 80 percent of the money will be essentially liquid within those time lines can provide the flexibility to shift and reallocate resources into more appropriate investment vehicles should circumstances call for it. For instance, by using the stock market and adaptive managers and/or bullion (liquid), consumer grade real estate (120 days or less), collateralized note programs (six months to five years liquid), REITS and BDCs (three to six years liquid), and possibly other ideas with shorter maturation dates, if the rest of the world stops buying United States Treasury bonds and demands higher yields for their risk and treasuries go to 15 percent yields, no problem. Pull your money out of the investments that will earn less than 15 percent and move them into treasuries. The ability to adapt is vital for long-term success.
Table 8.1 shows what a simple investment ladder might look like. It provides additional liquidity as time passes and more and more of the investments become effectively liquid. This is the same concept as a bond ladder where you buy bonds with different maturity dates to provide liquidity and an opportunity to increase yield.
Table 8.1 Simple Investment Ladder
| Investment: | Liquidity Timeline: |
| Stock Market and/or bullion | Liquid |
| Consumer Grade Real Estate | 120 days or less |
| Collateralized Notes | 6 month to five years |
| REITs | Three to six years |
A last discussion on liquidity time lines revolves around the use of retirement accounts such as IRAs, 401(k)s (or 201k if yours hasn’t done well in the various stock market crashes), 403(b)s, 457s, profit sharing plans, and everything else that is treated as a tax-deferred retirement plan by the IRS.
 COMMON SENSE CONCEPT
Figure 8.1 Interest Rates versus Bond Values
If someone is 50 years old and has an IRA that he or she does not plan on touching for at least another 10 years, does this person really need a lot of liquidity within this IRA? The answer is most likely no. As long as there are plenty of resources outside the IRA that remain liquid and available in times of emergency, liquidity within the IRA becomes a detriment. It forces you to be either in the stock market or in the banks.
If you realize that time is on your side, that you will not be touching the money for a long time, then you have far less a need for liquidity and can focus your IRA or whatever retirement account you have on financial tools that fall into the High Return-Capital Preservation (HR-CP) category (see Figure 8.2). The drawback to this category is time, but if time is something you have, then you can manage your investments and benefit from a different strategy. The nice part of these investments, the tangible investments, is that they usually pay monthly dividends or distributions that can be reinvested during the years, and once you hit your magic age of 59½, you can turn on the potential income streams and leave the principal alone. Isn’t that what retirement accounts should be designed to be, slow income payers?
Figure 8.2 Common Retirement Account Teeter Totter
Many clients never want to touch their IRAs or other tax-deferred retirement accounts until they are forced to at age 70½. The good news is the HR-CP investments generally pay more than 3.6 percent in dividends, which is roughly the starting required minimum distribution (RMD) percent at age 70½. In order to satisfy your RMD, just pay out some dividends for a portion of the year, and then turn the distributions off. Thus, you will not be over withdrawing from your retirement account and paying unnecessary taxes on money not needed.
The one drawback to using tax-advantaged investments within an IRA or other tax deferred retirement account is that you do not get the tax depreciation or other deduction benefits. As previously described many advisers make rigid statements like, “Don’t be double tax deferred in an IRA.” That is, they are stating that using investments which can provide tax benefits if used outside of a retirement account are not good investments to be used inside a retirement account. Who cares! In a retirement account you just want total return and, if you believe a certain investment will deliver a solid return, then the HR-CP investment is a natural fit even within a tax-deferred, time-based account like an IRA.
Not to be missed if you currently own an IRA, 401(k) or other pre-tax retirement account, in Appendix C I’ll show a little known yet powerful tax strategy which only works with the illiquid HR-CP investments in a Roth IRA conversion.
Step Three: Income Needs
Knowing how much income a person needs as a base amount is one of the first steps in creating a successful financial plan. We always recommend that clients have as many income streams as possible to help protect against the black swan event.
What is a black swan event? Something totally unpredictable and uncontrollable. For instance, you own an apartment building, and a giant meteor crashes into it, completely destroying the building and making the land radioactive. That is a far-fetched example, but imagining airplanes crashing into the Twin Towers and causing small buildings down the street to sustain massive damage is also far-fetched, and yet we saw it happen. The small grocery store owner could never have thought his little business would be wiped out in seconds.
The term black swan event comes from a concept. If you studied swans your whole life and every swan you looked at was white, you might conclude that all swans are white. You could spend your whole life looking at millions of white swans and confidently conclude that all swans are white. But one day someone shows you a single black swan, as they have in New Zealand, and your entire life’s work and conclusion are wrong. Thus the black swan event.
Between 2002 and 2007 many advisors felt that the global credit crunch and stock market and real estate crashes were black swan events. These were opinions based on ignorance, or more likely, IGNORE ance. Ignoring the obvious signs of excess between 2002 and 2007 and hoping the world could sustain such financial lunacy was common. The sad part is that many people had put their full faith in these financial advisors.
The global credit crunch and following stock market crash beginning in August 2007 and continuing into 2009 was not a black swan event. This was totally predictable as demonstrated by passage of the Bankruptcy Law of October 17, 2005. This law is proof that the lenders and credit card companies as well as Wall Street knew this tidal wave of foreclosures and defaults was coming, and they (the lenders) were designing laws which would give them better protection from people using a Chapter 7 bankruptcy filing and sending the debt and losses back to the irresponsible lending banks.
In 1993 and 1994 when real estate values dropped considerably from their previous highs in 1989, many people would mail their house keys back to the lender and walk away from their residences, which were worth less than the loans on them. The envelopes received by the lender would rattle, and thus were called “Jingle Mail.” Yes, their credit was hurt for the next seven years, but walking away from the upside down home would give these people a chance to rebuild without the burden of the debt. Several clients of mine did have bankruptcies in the early 1990s, but since the debt burden was alleviated, they were eventually able to get loans again and build multimillion-dollar estates.
Now, in order to file a Chapter 7 bankruptcy, you need to earn less than the average income in the United States and take six months of credit counseling. For those who earn over the average income, you will only be able to file Chapter 11 bankruptcy, which effectively keeps the burden of the debt on your shoulders forever. I believe that without the ability to rebuild, a few of our clients who intelligently used bankruptcy to give themselves a second chance would never have been able to rebuild multimillion-dollar estates and become citizens who pay high taxes again.
Don’t get me wrong. I’m all for personal responsibility and accountability in handling money. But what I saw in the real estate bubble between 2002 and 2006 with predatory lenders, shady appraisers, and real estate agents up-selling and overburdening people, getting them into homes they should never have owned in the first place, was a major cause of the global financial crisis which began in 2007. Most people are great at their jobs, but most will admit when it comes to mortgages and finance that is not their specialty, and they rely on lenders and agents to be honest and put the needs of the home purchaser above their own pocketbook. This was not the case, as evidenced by the record number of people being foreclosed on today.
In 2006, my wife and I were purchasing a property with great net cash flow. The loan we were promised was a 30-year fixed, 10-year interest only loan. This allowed us to repay the bank as little as possible while letting inflation eat away our loan. The point of the story is, the mortgage broker we used tried to pull the wool over our eyes for a much larger commission.
He stated the rates he could deliver for us, a quarter point below the rest of the field, were because he was hungry and willing to work for less commission.
I’m all for someone trying to earn my business by shaving their fees somewhat. Making 80 percent of something is better than 100 percent of nothing.
After no documents showed up for a week, I started calling this mortgage broker to confirm the terms of the loan. He so much as swore on his kid’s life that the loan we would get was the one we asked for—the 30-year fixed, 10-year interest only. Four days before the close of escrow, he finally showed up with the documents. I took one look at the documents and they were not as promised. He brought us a 10-one ARM. That is, a loan fixed for 10 years and an adjustable interest rate afterwards. The other thing was, the loan papers were doctored to reflect an interest rate of 6 percent, but the payment buried deep in the documents reflected a different interest rate, that of 7.25 percent. He had intentionally typed the interest rate we were expecting on the front cover to mislead us into a 7.25 percent loan.
He looked me in the eye after I questioned him on the discrepancies and said, “Oh, there must have been last minute changes by the lender.” He was counting on the fact that most people would never scrutinize the documents too closely, and I’m sure he knew we were under the gun to close escrow or lose our good faith deposit of $30,000.
I politely stood up and escorted him to the door saying, “I would rather lose $30,000 than pay you one dime for your dishonesty.”
The point to this story is, if this shady mortgage broker was trying to pull a fast one on a financial advisor well versed in real estate and mortgages, what do you think he got away with in documents prepared for an average person, a potential first-time homebuyer who didn’t understand mortgages and loans and relied on the broker to be honest and fair?
Era of the Printing Press Economy
Let’s examine the idea of how the world economies in 2012 and for the foreseeable future are really just based on the printing presses of the Central Reserve banks—the banks which control the ability to print money. Why this is important is that your income needs have to be inflation adjusted.
As an aside, when I discuss the Central Reserve banks printing money, I am speaking in shorthand of course. It is more convenient to say, “printing money,” than to say, “the Federal Reserve is crediting member bank accounts with increased balances electronically, which it does by means of a computer. If these balances are actually lent out and the borrowers prefer to use some of this money as cash, the Treasury will go ahead and print the cash.”
The last time the U.S. deficit went down was September 1960. Many people believe that we had a surplus budget in fiscal 2000, but when looking at the official treasury debt to the penny, it still increased by $18 Billion. A pittance compared to the trillion dollar deficits we are running today, but an increase none the less.
Mainstream and Keynesian economists claim we can print ourselves rich. If we just keep printing money, we can solve the debt issues we are currently experiencing and build wealth and prosperity.
Piling up more debt to solve our debt issues is the solution to spur growth.
Think about a simple concept. If every man, woman, and child on the planet were given a million dollars, would we all be rich? Of course not. We would all have a million dollars but the next day the prices on all goods and services would adjust up by a similar ratio and thus our purchasing power would stay the same.
Increasing the money supply does not create wealth. Money is NOT wealth, it is just the means of exchanging real wealth. A loaf of bread, a piece of real estate, a bar of gold. That is wealth. It is limited in supply and you cannot just push a button and magically create more of it out of thin air, as is the case for printing money.
Many people falsely believe inflation is the rise and fall of prices. That is the effect of inflation but not the cause. The cause is an increase or decrease in the quantity or supply of money. Here is a simple example:
If I have 10 apples and there are 10 dollars in circulation chasing or rather wanting to buy those apples, then the price of the apples will be one dollar.
Ten dollars divided by 10 apples. The price will be $1 per apple.
If you have a robust economy with full employment and full manufacturing, for instance the 1950s, and you wanted to cool the economy from growing too fast, one solution would be to take dollars out of public circulation and try to slow spending. Incidentally, if fewer dollars are chasing a set amount or increasing amount of products, the prices will tend to fall.
Five dollars divided by 10 apples. The price per apple will fall to 50 cents. This is true deflation.
If the price of gas or groceries goes down, to you or me it would be a wonderful thing, but according to the government and the Federal Reserve, that is a disaster. This is because of how they report financial growth for the country, for instance gross domestic product. It is based largely on rising prices and not increasing actual real wealth and productivity.
Let’s look at the other result of our apple example and the effects of increasing money supply.
During bad economic times, the Federal Reserve likes to print money and spur consumer spending. They add more money into circulation. For our example let’s say there is now $20 chasing the same number of apples.
Twenty dollars divided by 10 apples. The result is prices go up to $2 per apple.
To add insult to injury, during bad economic times usually manufacturing and real productivity are dropping. Factories are being shut down and jobs are being lost. This will compound the negative effect of more money in circulation by taking away how many apples are being produced.
Twenty dollars divided by five apples. The result is apples now cost $4.
This is when inflation starts to kill real productivity because people are earning less and yet prices are rising faster and faster, taking away their ability to buy the goods and services they need. This results in a dramatic reduction in the standard of living.
Welcome to Zimbabwe!
One of the most prosperous times for the United States was immediately after the Civil War, from 1866 to 1912 according to William Buckler of The Privateer. We had great increases in manufacturing, standard of living, and real wealth. An interesting point during this time was that our official debt did not increase by one penny.
A can of tuna which cost 5 cents in 1866, still cost just 5 cents in 1912. Purchasing power was consistent which gives people the confidence to manufacture and produce goods and services, to save more than they consume and build real wealth.
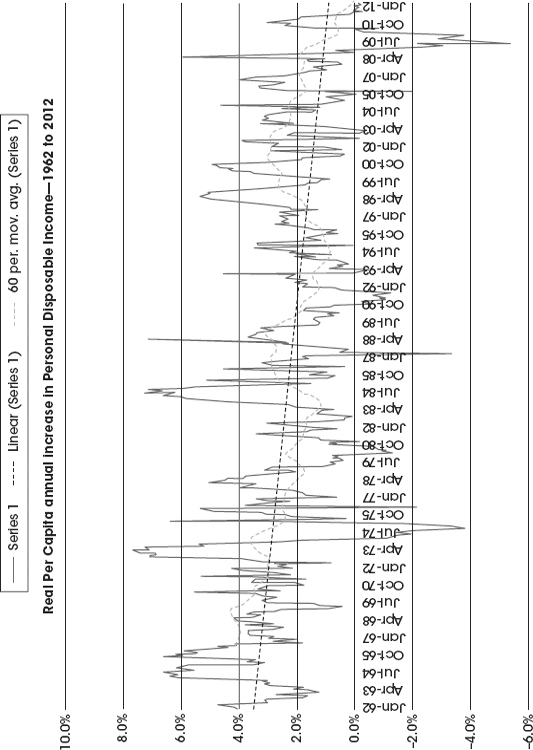
When purchasing power is eroded as it has been ever since the Federal Reserve was created in 1913, real wealth comes to a standstill. Since 1971, the U.S. dollar has lost approximately 84 percent of its purchasing power and real disposable incomes in the United States, and thus the standard of living, have been decreasing in lockstep (see Figure 8.3).
Real disposable income is the amount of disposable income adjusted for inflation rate (see Figure 8.4). Though the nominal value might go up, the real value has been falling for 30 years.
Figure 8.4 Real Disposable Income 1962 to 2012
Now, it isn’t enough for one working parent and one staying home with the kids to maintain a solid middle class standard of living as was the norm in the 1950’s. Today, while the kids are in daycare or with grandma and grandpa, both parents are working, struggling to keep up with the rising cost of living, which represents a real decline in the standard of living.
The Wealth Code solution is to focus on inflation-adjusted income. We can expect prices to continue to rise and we need our paychecks to rise as fast or faster if we are going to maintain our current standard of living, or better yet have the potential to increase it.
Income Needs as Defined by Cash Flow
As stated previously, a major focus for each plan I put together for clients is based on cash flow. As many checks in the mail every month from as many sources as possible is the goal. Many of the wealthiest people have built their fortunes from constant passive cash flow.
What does cash flow allow you to do? You can confidently invest in other ideas, knowing the income streams you are receiving potentially cover your bills, and the excess can be used to add to your wealth bucket. The more your bucket grows, the greater your cash flow becomes, and the cycle repeats itself building wealth over time.
A significant part of determining future income needs is compensating for the effects of inflation. A big problem with a payment stream from an annuity is that the check never increases. What might seem like an adequate monthly income today, say $3,000, might only buy a ticket to the movies, much less pay for your monthly living expenses in 20 years.
A serious problem for CD investors when they live off the interest and leave the principal alone is that the principal never grows. As time passes, they will start to fall far short of meeting their monthly expenses.
Income needs are naturally tied to growth of the portfolio, which I will cover in Step Four in our Wealth Code process.
Step Four: Growth Needs
On which conveyance should you travel?
On the highway, cars zoom along at 65 mph. Next to the highway is a bike path, where bicyclists pedal along at 8–12 mph, and next to the bike path you have a walking trail, where the pace might be a solid 2–4 mph (Figure 8.5).
Figure 8.5 Different Pathways

Most advisors try to put everyone on the highway, trying to double their money the fastest way possible. They use the stock market exclusively because it does have the possibility of doubling your money very quickly. The problem is, how often do you see accidents on the freeway? Everyone is driving so fast that inevitably someone makes a mistake and hits the guardrail or another car and causes a big accident. The freeway is shut down for hours.
Funny, those silly bicyclists who just keep pedaling along the bike path at a solid 8–12 mph seem to get to work a lot faster most of the time. At least the bicyclists can plan their day with the reasonable assumption that they will get to their destination on time. The freeway is a gamble. Some days the freeway is the fastest, but sometimes it takes you three hours longer than expected, and you miss your big meeting and lose your shot at that important job.
Retirement planning is about reaching goals. In my opinion, using the freeway is the worst way to plan, yet for the majority of financial advisors, it is the only path they know for guiding clients.
I like consistency with our investments. By using many asset classes, which are not designed to double your money but are meant to work slowly and consistently and to potentially keep up with the ravages of inflation, we generally choose to travel on the bike path and tend to reach our goals more predictably.
Retirement planning is a lot easier if you use reasonable assumptions and you aim for consistent growth and income. This is seemingly impossible with the stock market. You could have invested for 40 years in the stock market and planned to retire in 2010, but now what? Many baby boomers are going back to work for another 30! How many baby boomers have been forced to downsize their lifestyle or scale back their retirement plans due to the recession?
Portfolio growth does not need to be great, but it needs to be reasonably consistent. Singles and doubles to use the baseball metaphor. In my opinion, the best part of real asset investments is their direct correlation with inflation. Our government has been on an inflation kick since the creation of the Federal Reserve in 1913, and it doesn’t plan to change course anytime soon. Real assets generally provide a natural inflation hedge. Why? It costs more to create or develop tangible assets when the price of the raw materials increases with inflation. How many people go for a walk in their neighborhoods and ponder what it would cost to build their same home all over again? Could they even afford to buy it?
Building a portfolio can be thought of as placing your money on the various pathways. Some on the highway (stock market), some on the bike path (real assets), and some on the walking path (cash or cash equivalents).
What you are trying to achieve determines how much of each pathway you should use. Due to its consistency most of my clients choose the bike path for the greater share of their wealth. They want to have reasonable assumptions in place for determining their retirement needs and want to be able to sleep at night without wondering about how the stock market is doing today, tomorrow, or frankly ever!
They know that they can set an objective of 5-10 percent overall returns, and aim for consistent results, never 50 percent, never doubling their money in a year, but they can get a consistent total return. That’s piece of mind.
Achieving Total Return
If you are pulling out income of 6 percent per year from your portfolio and reasonably expect a total return of 10 percent, then your portfolio will slowly creep up by 4 percent each year. With more principal to work with each year, there can also be the potential for an increase in cash flow.
 KEY WEALTH CODE CONCEPT
Total return is income plus growth. Wall Street wants everyone to focus on growth as the major component of total return, but as mentioned earlier, I feel that growth tends to be a wildcard and not as predictable as you would like it to be.
If your goal was 10 percent per year, and only 2 percent was achieved by dividends, you would have to have growth of 8 percent each year to reach the goal.
If on the other hand, your dividend was 7 percent, now you would only need growth of 3 percent to hit your total return goal. Three percent growth seems like a more reasonable assumption than 8 percent, wouldn’t you agree?
Hypothetical example with a 10 percent target total return:
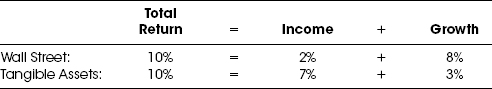
If the growth doesn’t happen for either investment, Wall Street’s version of total return has only achieved 20 percent of the overall goal or 2 percent. For the tangible assets example, if the growth doesn’t happen, you’ve already achieved 70 percent of your goal or 7 percent.
With real assets, you are usually dealing with various forms of cash flow such as rents received. Anyone who has ever rented an apartment has felt the effects of rising rents and their tie to inflation. Each year that little envelope would show up in the mailbox or worse, was slid under the door, and inside was a simple message, your rent is being increased by three to four percent.
For you, the renter, it became a yearly ritualistic disappointment. For the owner of the building, it was good news because raising the rents meant more cash flow—adding to the growth component of the apartment building’s total return and keeping pace with inflation. By raising the rents year after year, the building’s owner is increasing the economic value of the building, or in other words, the growth component of the real asset.
With any real asset investment, you will not know what the total return will be until the final sale of the underlying investment—whether the real estate in a REIT, the loans in a Business Development Corporation, or other foundation for a particular investment. Let me say that one more time. Until the last asset is sold and the REIT, BDC, et cetera portfolio liquidated, you will not be able to calculate your total return. You will have potentially received distributions over time (not guaranteed) that can be calculated easily, however.
This also applies to a rental house you might own. Until you actually sell your rental, you don’t really have anything to compute in terms of total return. On any given day it could be plus $5,000 or negative $5,000 depending on the current economic environment. The day you sell is the day you have the final piece of the equation (the growth component) of total return equaling income plus growth.
Any given year, you can figure out whether the income measures up to expectations and ascertain the investment’s strength, but until the pied piper plays, total return cannot be tallied.
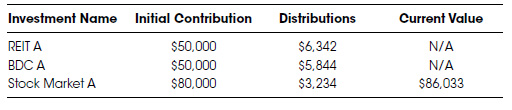
When I sit down with my clients and summarize all the legs on their portfolio table (see Table 8.2), it will show the initial investment and cash flow to date, but will not show a current value for any of the real assets. Unlike the stock market, where values fluctuate and reach a final value at market close, tangible assets are different. Again, because until the final sale of the investment, we don’t know the true value and cannot compute total return. Of course we show the value of the liquid investments—those being the managed accounts in the stock market which have daily valuations.
Table 8.2 Hypothetical Summary Example
I believe this ability to see current value of the stock market and wide swings is what causes so many of us to panic at the wrong time and ultimately to make bad financial decisions. For instance selling at the bottom or buying at the top.
The lack of daily valuations with real assets is the primary reason I believe that these illiquid investments may be suitable for my clients. Real estate, notes, oil/gas, and so forth are examples. They generally don’t create as many panic attacks and can allow the investment to work until maturity. The illiquid nature of these investments potentially keeps them from being sold at a bad time in an emotional panic.
Other than understanding what total return is, you should be rolling your eyes, thinking to yourself, every adviser says they will make X percent a year. I agree. That is why your education and due diligence are vital. Please take the time to learn about these other asset classes, form an educated opinion, and build a portfolio based on what you’ve learned.
My goal is to provide the big picture for The Wealth Code concept from A to Z, from philosophy to implementation. The introduction through chapter nine and the case studies in Appendix A serve this purpose. Let me make it abundantly clear that these concepts may not be suitable for every investor. This book is designed to provide an overall introduction to the concepts so that you, as an investor, can hopefully make better, more informed decisions. The examples used are general in nature, and the investor is strongly urged to read all the materials provided before investing.
At this point, please don’t put the book down and call it a day. Appendix B is vital to your understanding of the various legs on the financial table—the different investment asset classes and their pros and cons. As you gain a better understanding of the various asset classes, you are providing the glue to finish your financial table. Without the glue to hold the legs on your table the resulting portfolio may not be solid.
Step Five: Beneficiary Needs
When it comes to spending, everyone has good kids and not so good kids. Not that they are criminals, but they differ in terms of spending habits. Some beneficiaries are great with money. They save, live within their means, and invest wisely. Others live for today. Every dollar that goes into their pocket goes out the next day for the latest flat screen television or gadget. They live paycheck to paycheck and will probably work until the day they die.
Ferrari Distribution
A fun term I use at my firm for a lump sum inheritance that lands on a beneficiary’s lap all at once is a “Ferrari distribution.” They get the dough and the next day blow it on a new Ferrari or whatever impulse buy they have always wanted. According to the Wall Street Journal, Boston Globe, and several other reputable news sources, over 30 percent of lotto winners spend all their money quickly and are more depressed after winning than before. Most of these winners are depressed because they had a taste of another life and now long for what they no longer can have. Back to buying lotto tickets, I guess.
A great benefit of real assets is their lack of liquidity or difficulty in cashing out quickly. Time and time again, a client dies, and the beneficiaries call wanting all their money in cash as quickly as possible. No consideration for how the money is invested, no consideration for how much it might cost to get out, just give me whatever is left. From observing beneficiaries and their inheritances over the years, I’ve noted that the longer it takes to pull money out of real assets, the more time the beneficiaries have to enjoy the potential for monthly distributions, which helps them realize the benefit of taking only the income and not touching the principal. Many parents would love to instill this discipline in their adult children or beneficiaries.
If you have been sold an annuity because it can be used as a stretch IRA and will benefit your kids, I have news for you: Any type of investment can be a stretch IRA, not just annuities, but stocks, bonds, REITs, partnerships, and so forth. The reality is that the day you die, your kids have the choice of whether they take only partial payments over their lifetime (Stretch IRA) or take out all of the money much faster. Most choose the latter. They just want whatever is left after taxes, and they don’t care if they lose half the money to Uncle Sam. They didn’t work to save it and unfortunately they do not respect the loss to taxes by taking the money as a single lump sum.
KEY WEALTH CODE CONCEPTPutting Together a Financial Plan
At this point, I am ready to implement a plan. I know as much about the client as I believe I can know. I understand their income needs, current investments, level of comfort and experience with different asset classes, their objectives, their lifestyle expenses, their investment time horizon, future liquidity needs, portfolio growth needs, as well as what the beneficiaries hope to inherit. Lastly, I have proposed time lines that I believe are reasonable for having access to the money for other investments, purchases, or income.
To better illustrate putting together a plan, let me use an example. Please note that Appendix A includes a few more case samples to better clarify the process of building a Wealth Code financial portfolio.
Case Study: Mrs. Jones
Mrs. Jones is 61 years old and is concerned about her retirement. She retires in five years from a job that pays $75,000 per year, and she feels too much of her money is not working due to a large bank CD position from the proceeds of a previous rental property she sold as well as stagnant mutual funds in her IRA. At her full retirement age, 66, her Social Security check will be $1,800 per month. Her current federal and state income tax bracket is around 28 percent.
A list of her assets includes:
| Personal residence | Fair Market Value (FMV) $600,000 with a $100,000 30-year fixed mortgage at 4.5% |
| IRA | $ 375,000 mostly in mutual funds |
| CDs | $ 600,000 |
| Treasury bonds | $ 100,000 |
| Net worth including Residence | $1,575,000 |
| Net worth excluding Residence | $1,075,000 (Fully Accredited) |
Her equity in her personal residence equals the fair market value minus the mortgage balance. In her case, $600,000 − $100,000 = $500,000.
When thinking of the different legs on your financial table in the High Return-Capital Preservation (HR-CP) category, a good rule of thumb is never to use more than 10 percent of investable wealth in any particular financial tool. Some states have mandated that non-accredited investors must limit their investments to 10 percent in any one type of these assets. Investable wealth would be the investments, not counting the personal residence.
For Mrs. Jones (an accredited investor), her investable wealth is $1,075,000 (IRA, CDs, and treasuries), and thus the maximum for any one non-liquid investment using the rule of thumb should be around $107,500. Rounding up or down a couple thousand is within reason.
Investable wealth:
| IRA | $ 375,000 |
| CD | $ 600,000 |
| Treasuries | $ 100,000 |
| Total | $1,075,000 |
Maximum per financial tool = Investable wealth × 10 percent = $1,075,000 × 10 percent = $107,500
Due to the lack of immediate liquidity with most of the investments in the HR-CP category, it is always a good idea to spread the wealth around as much as possible. Using smaller legs on the table, or smaller allocated amounts is what I believe to be a good approach. If any of these investments goes sour, it limits the impact or exposure for the overall portfolio. For instance, for Mrs. Jones, maybe each non-liquid financial tool becomes roughly 5 percent of investable wealth.
More conservative maximum per financial tool = Investable wealth × 5 percent = $1,075,000 × 5 percent = $53,750 or approximately $54,000
In her particular situation I felt it was prudent to go even smaller (2 to 4 percent) for most of the illiquid investments. This provides diversification within the tangible asset classes.
The emotional investments, High Return-Liquid (HR-L), and the banking products, Capital Preservation-Liquid (CP-L) can be larger percentages because of their liquidity. You can always sell at any point and raise cash if needed, and thus, the size of these legs can be larger. Remember, this is only an example of what was done for one particular client. It is not “one size fits all”.
Table 8.3 is a recommendation summary for Mrs. Jones.
Table 8.3 Mrs. Jones’ Example Recommendations
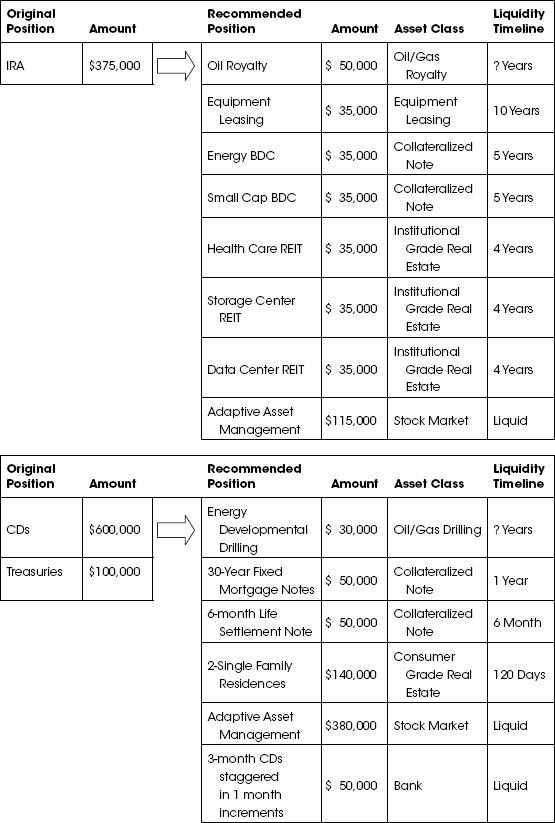
Please note, the investments which will be described in her plan are fully explained in Appendix B. The goal here is to understand the logic of each one and how they relate to her financial goals.
KEY WEALTH CODE CONCEPTNotice the use of the non-traded REITs. We have chosen to go into three types of real estate, which we feel would do well in times of chaos and going forward. Currently, with millions losing their homes to foreclosure, what do these people do next? They sell or put their belongings in storage and move into an apartment. Storage centers have been one of the most consistent performing types of real estate going back the last 35 years and according to the Self Storage Association, one in 10 United States households currently rent a storage unit. We are a nation of pack rats I guess.
According to CTIA-The Wireless Association, United States consumer data traffic increased 104 percent between July 2011 and July 2012. They estimate it will quadruple in only three years. Everyone has to have the latest iPad or cellphone and needs to be connected 24/7. This bodes well for internet data usage and hence for cloud data storage. We want to own the real estate that stores the data centers for companies such as Apple, Google, Amazon, and so forth.
As for the healthcare REIT, this plays off the fact that there are 79 million baby boomers beginning to retire, and a by-product of getting older of course can be the need to see a doctor with increasing frequency.
Between the two business development corporations, BDCs, which is a form of collateralized note, I chose one which is based on helping small to mid-cap companies. This BDC has greater potential for upside growth as they usually are given warrants or options of stock along with the loans they make. The second BDC is based on loans to energy companies. Love them or hate them, oil is here to stay, and Mrs. Jones felt making loans to them was a good idea. I chose two other oil investments for her due to her belief that oil would, in the long run, go up in price tied to real inflation (see Table 8.4).
Table 8.4 Summary of Recommendations for Mrs. Jones
| Oil/Gas Investments | $ 80,000 | ∼ 7% of investable wealth |
| Equipment Leasing | $ 35,000 | ∼ 3% |
| Non-Traded REITs + 2 Single Family Residences | $245,000 | ∼ 23% |
| Collateralized Notes | $170,000 | ∼ 16% |
| Adaptive Asset Management | $495,000 | ∼ 46% |
| CDs | $ 50,000 | ∼ 5% |
The first is an oil royalty program. There is no liquidity ever with this investment but could potentially provide some level of return for decades (see Tables 8.5 and 8.6). She is fairly young and wanted a part of her IRA distributions to be tied lockstep with inflation. Oil is always a good choice for that.
Table 8.5 Summary of Liquid to Illiquid investments
| Liquid Investments | $545,000 | ∼ 50% of investable wealth |
| Illiquid Investments | $530,000 | ∼ 50% |
Table 8.6 Approximate Liquidity Timeline for her investments
| Liquidity Time Line | $ Becoming Liquid | Total Liquid Investments |
| Liquid Immediately | $545,000 | $545,000 |
| Liquid after 6 months | $ 50,000 | $595,000 |
| Liquid after ∼ 1 year | $ 50,000 | $645,000 |
| Liquid after ∼ 4 years | $105,000 | $750,000 |
| Liquid after ∼ 5 years | $ 70,000 | $820,000 |
| Liquid after ∼ 10 years | $ 35,000 | $855,000 |
| Oil/Gas Annuity Payment Single Family Residences | $220,000 Never Liquid | $855,000 |
The second oil investment was placed in her trust account, which is after-tax money. The developmental drilling program should theoretically provide the same type of check the royalty program does, but will have one additional benefit. This program comes with an intangible drilling cost (IDC), a type of income tax deduction. As of 2012, for her investment of $30,000 she could receive an immediate tax deduction of around $27,000 or 90 percent of her investment in the first year of the investment, and potentially receive depletion deductions in subsequent years. Programs that come with an upfront tax deduction should not be used in retirement accounts because you will lose any such tax benefit. In Mrs. Jones’ example, however, she was in the 28 percent federal and state income tax bracket and with a $27,000 deduction, she should save approximately $7,560.
$27,000 tax deduction × 28 percent income tax bracket = $7,560 taxes saved.
Considering Mrs. Jones has experience owning rental property: the rewards of positive cash flow, and the headaches of management, I referred her to a realtor/management firm which specializes in refurbishing single family residences. This realtor/management firm provides turnkey rental purchase solutions, including management, for clients who do not wish to have the day-to-day responsibilities.
Her attitude with these properties is she will be a collector. Enjoying the potential rental income and thinking of them as a forever investments.
The other investments completed her plan. A mixture of longer-term ideas was used for her IRA as this money is meant for longer-term income needs and not meant to be pulled out quickly, which would cause a huge tax problem. Retirement accounts tend to work well with illiquid investments. The durations of the investments are much shorter in her after-tax investments as this money would be first used in an emergency or for a large purchase such as another rental property. Equipment leasing, adaptive stock market management, and CDs were used to provide what I believe to be a well-balanced financial table with a total of six asset legs.
Mrs. Jones considers her oil payments to be comparable to a lifelong pension payment, like a second social security check. She also considers her new rental property something she’ll own until she dies. The rental properties could be liquidated fairly quickly with the price depending on the real estate cycle we are in. In a good time she could sell very fast. In a bad time she would have to wait longer or drop the price to be appealing to a potential buyer. The nice part of single owner real estate is there is always a price you can sell for. It just depends on how much you are willing to accept.
After several meetings with Mrs. Jones, understanding that past performance is no guarantee of future results and with a clear understanding of the prospectuses and risks with each asset class, I put together an income projection for her (see Table 8.7). Using target dividend/distribution assumptions that Mrs. Jones was comfortable with for the various investments, I was able to generate an approximation of her income potential today and in five years when she plans on retiring.
Table 8.7 Portfolio Income Potential—Hypothetical
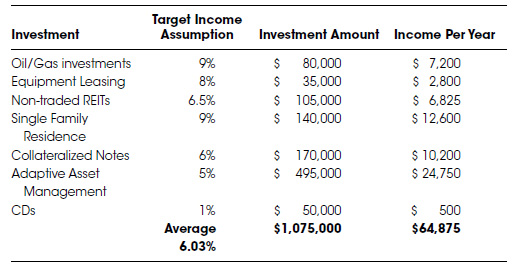
Adding everything up, the income potential for her portfolio is approximately $64,875 per year or 6.03 percent. See Table 8.7. Obviously, the low return on the CDs hurts the overall income potential, but their addition for liquidity needs is important.
Since she is still working and does not need the income, reinvesting the dividends and distributions over the next five years compounds or grows her account balances to $1,440,629.
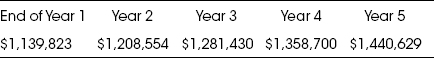
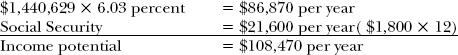
If we are able to maintain the dividends at 6.03 percent, her accounts will generate approximately $86,870 per year. Adding her Social Security payments brings her estimated yearly income to $108,470.
I like to design plans using only the dividends and not count on any growth. If growth occurs, that would be all gravy on top of the reinvested dividends.
Mrs. Jones liked the fact that almost 83 percent of the investments would essentially be liquid by the time she retires, and when she does retire, she can elect to receive distributions (if they are being made) versus reinvesting potential dividends. In this way, she has the potential ability to dial-in her income from the various investments to meet her needs. For example, if she wants an extra $2,000 per month, all she has to do is call us, and we will set up monthly payments to her from the necessary investments to match the $2,000 desired. Maybe she does not need extra income but is planning a big European trip in six months and will need $10,000 for the trip. By planning ahead and electing distributions versus reinvestment, she could potentially receive the $10,000 from the dividends into her checking account, and by the time her trip comes around, it is already paid for. At that point, she would turn off the investments, that is, suspend the monthly checks, and begin to reinvest them again.
Having many different cash flow generating investments provides a greater sense of control over one’s finances and income needs. Of course, the drawback to having many financial investments or legs on your table is that you have many more statements each month. Most of my clients don’t seem to mind a bit more paperwork if the goal hopefully is to protect and diversify their wealth more successfully.
You might question the ability to earn a consistent 6.03 percent. Remember I am are not counting on any one investment to deliver this return. I need the average to equal 6.03 percent. Remembering the Wealth Code Golden Rule, I expect things to not work out as planned. I expect a distribution to be cut or lowered or one of the investments to not work out as planned. That is why I chose 14 different investments for Mrs. Jones, knowing that if something doesn’t go as planned, something else, in all probability, will work better. This has the effect of evening out the returns and helping to keep her potential cash flow in a consistent range.
A question Mrs. Jones asked me was whether or not to pay off her mortgage balance. After factoring in the mortgage tax benefit of her 4.5 percent fixed mortgage and assuming her tax bracket would stay around 28 percent, I was able to show her that the net cost of her mortgage was 3.24 percent.
4.5 percent Interest − 1.26 percent(28 percent Tax deduction of 4.5 percent) = 3.24 percent net cost of mortage
The simplest answer was showing her that potentially most of her investments would reasonably earn more than 3.24 percent and that each dollar earned above 3.24 percent was free money. Factoring inflation into the equation and paying back loans with devalued dollars would boost her net return even more. She saw the logic pretty quickly and looked forward to enjoying the excess free earnings.
Mortgage arbitrage is the concept of borrowing money at low rates, investing it in higher earning investments, and pocketing the difference in earnings.
When thinking about paying off your mortgage or investing the principal amount using mortgage arbitrage, ask yourself the following: “Is it okay to pay $1,000 in mortgage payments when investing that money could, for example, generate $1,200 a month?”
Earning an extra $200 each month seems like a no brainer, doesn’t it? For some people, it is a no brainer. For others, the idea of having a house completely paid off has been their goal. Whether to pay off a mortgage or carry a loan is fine depending on a person’s circumstances.
This principle behind mortgage arbitrage is exactly how the banks penalize us for keeping deposits in our bank accounts. They pay us practically nothing in interest, yet they get to invest the money in other more profitable endeavors and keep the difference. Funny, when you loan the bank money by putting money into your accounts, they pay you practically nothing in interest, but if you walk into that same bank and ask for a loan, they will charge you lots of interest.
My philosophy is to be the bank with your mortgage. Pay the bare minimum and invest the difference. The extra earnings are gravy in your pocket. Of course, the key to this concept is having a mortgage with fixed payments. Unfortunately, to take advantage of the artificially low rates in effect today, many people have used adjustable rate loans for this concept. The rates are artificially low because the Federal Reserve is buying mortgage-backed securities and keeping the market rates down. When the Federal Reserve stops buying, rates could skyrocket, and people who are using adjustable mortgages to arbitrage will be hurt by payments that are higher than what they are able to earn in other investments. My recommendation is to use only fixed rate (payment) loans for mortgage arbitrage.
One other advantage of a fixed mortgage is that eventually when you do pay back the loan you will be paying for it with inflated dollars. I often joke to clients, “On one of my properties there is $1M in fixed loans. Maybe 10 years down the road, I’ll put a roll of toilet paper in an envelope, mail it to the lender and pay off my house.” We’ll call this type of envelope, “Squishy Mail.” The lender of course will call it “bankruptcy mail.”
This would be due to immense inflation in the United States. The value of the dollar would have to go down so much that a roll of toilet paper becomes valued at $1M to pay off my loans. Though said in jest, unfortunately, hyperinflation has occurred many times in history. Recall the previous story about a roll of toilet paper in Zimbabwe.
Another story I heard about the effects of hyperinflation is hair-raising: A very wealthy lady who lived in Germany had more than $1M Deutsch Marks in the bank. She went to Switzerland for a trip, caught tuberculosis, and did not return to Germany until 1923. When she got home, she opened two letters from her banker.
The first dated 1920 read, “Mrs. Smith, please come by the bank very soon. I feel we should convert your money into another currency to protect its value.”
The second, dated 1922 read, “Mrs. Smith, we are closing your bank account as your balance is too low for us to service it.” She noticed on the outside of the envelope, the canceled stamp was valued at $1M Deutsch Marks. Thankfully, she had real estate, which protected a large portion of her wealth.
The ones who get hurt the worst by inflation are those who lend money at low fixed rates. When they get their money back, its purchasing power isn’t worth nearly what it was when they lent it. Having a long-term fixed mortgage is a way of protecting wealth against a devaluing dollar. The more the Federal Reserve prints, the cheaper it will be to pay back a fixed sum of money. Again, we’ll start a revolution and call it “Squishy mail,” and all of us will mail toilet paper to our lenders and pay off our houses.
A second recommendation is important when considering mortgage arbitrage. Only invest dollars in the same asset class as those dollars against which are being borrowed. For instance, real estate (tangible asset) should only be arbitraged against other tangible assets. Often, people borrow money against their homes to invest in the stock market only to lose half of the money. Not a good idea.
Aside from the concept of mortgage arbitrage, there’s another concept of wealth that the very rich have mastered. That’s the principle of using other people’s money to build their personal wealth, which dates back to the origin of money and investing.
Here’s a thought. Would you rather have a 401(k) or a 401Condo?
People are told that they should invest diligently into retirement accounts and receive the tax deferral today on current income tax. Wall Street loves most retirement accounts because it gives them control over your wealth and the ability to charge all their fees for managing it. As mentioned previously, who do you think spearheaded all the various retirement programs out there? 401(k)s, 457s, profit sharing plans, 403(b)s: All were promoted and implemented by Wall Street and the insurance industry.
The sad reality is that most people put hard-earned money into 401(k)s, and the only choices they have are mutual funds, with average internal costs approaching 2 percent according to a Deloitte 401(k) fee study conducted in 2009. If someone has had money in a 401(k) for more than 15 years, almost a quarter of their account has been eroded by fees.
Most of the financial talking heads and books say to put your money into your 401(k) because you effectively earn 40 percent. This is the math they use to rationalize it: Assume you divert $10,000 each year from your income into your 401(k), you earn 10 percent each year, you are in the 20 percent tax bracket, your investments have no fees and lastly, your employer contributes $1,000 (see Table 8.8).
Table 8.8 401(k) Summary
| Investment into 401(k) for the year | $ 10,000 |
| Earnings at 10% | $ 1,000 |
| Taxes deferred at 20% | $ 2,000 |
| Employer Contributions | $ 1,000 |
| Total at the end of the year | $ 14,000 |
It would appear you made 40 percent on your original $10,000.
Now the disadvantages:
- You cannot touch the money without Federal penalties until you reach the age of 59½.
- Good luck making 10 percent each year in the stock market and not paying fees.
- Taxes are only deferred. Funds you eventually withdraw will come back out of the account as ordinary income, and thus you will be taxed at your highest marginal bracket. The IRS is rooting for you to invest very wisely because they will get all the taxes owed and a lot more. Notice THE IRS put together is “THEIRS.”
Let’s compare this to an investment in a 401Condo. If we think about cash flow, we know you are already contributing to your 401(k), so instead of that income going into the company plan, what if you took out the income and used it to pay for a mortgage and property taxes on an investment condo? This could be any type of investment real estate.
If we assume a 30-year fixed rate mortgage at 6 percent interest, with $10,000 to spend, that easily would cover the mortgage payment and property taxes on a $100,000 property somewhere. According to the Case-Shiller home appreciation index averaging around 3.4 percent between 1987 to 2012, assume the property will appreciate at 3 percent each year; you can rent it out for $1,000 per month, and property management costs are 10 percent.
Purchase Condo for $100,000 with down payment of $20,000. I’ll address the down payment in a minute. For now, let’s work through the exercise.
Adding everything up, you realize $2,800 within one year (See table 8.9). On the surface that seems far worse than the 401(k)’s $14,000 sum.
Table 8.9 Condo Cash Flow Summary
| Investment (cost) for the year (Mortgage payments and property taxes) | $10,000 |
| Rent received: $1,000 × 12 months | -$12,000 |
| Appreciation: 3% of $100,000 | $ 3,000 |
| Management costs | -$ 1,200 |
| Miscellaneous costs | -$ 1,000 |
| Total at the end of the year | $ 2,800 |
The difference in real wealth becomes apparent over time as which scenario is more realistically achieved.
Since both investment strategies defer the same taxes on the pre-tax $10,000, those gains are negated.
In the 401(k), over 10 years if you have diligently paid $10,000 each year into your 401(k), your employer has contributed their portion ($1,000) and hopefully overall earned 10 percent per year, you will have approximately $175,000 saved in the pre-tax 401(k).
$11,000 per year contribution at 10 percent compound return = $175,311
In the 401Condo over 10 years, with the $80,000 mortgage having been paid down to $67,000 and the property fair market value (FMV) having appreciated to $134,391 at 3 percent per year and if you invested the net rents ($9,658) after the depreciation deduction and taxes paid say at 3 percent net after tax, you will have approximately $182,820 between 401Condo equity and cash saved.
After 10 years the 401Condo total return is equal to $182,820 as compared to the total value of the 401(k) being $175,311
Here’s the good news:
- You don’t have to wait until you are 59½ years of age to sell the property.
- Taxes on condo appreciation, after selling the property, are based on the favorable long term capital gains rate. Or better yet, do a 1031 exchange into another property and defer the taxes. If you do this until the day you die—I call it, “swap until you drop”—then the capital gains are eliminated due to a step-up basis of the property at death.
- You can raise the rents while enjoying depreciation offsets on the income.
- If you lose your renters, the bills are already paid because of your consistent $10,000 retirement contributions covering the basic bills, mortgage, and property taxes.
- It’s not hard to realize a 3 percent annual growth rate on real estate over a period of 10 years; most properties will appreciate at a greater rate than that.
- The $115,429 is AFTER-TAX funds, unlike the 401(k) funds which are all pre-tax and eventually the tax piper will have to be paid (see Table 8.10).
Table 8.10 401Condo Total Return Summary
$100,000 FMV condo × 3% appreciation for 10 Years $134,391 Condo Equity = $134,391 − $67,000 (mortgage balance after 10 years of payments) $ 67,391 Condo Depreciation per year = $100,000 (purchase price) ÷ 27.5 year rate $ 3,636 Taxable Rental Income = $12,000 (rents received) − $3,636 (depreciation offset) $ 9,658 Income Taxes Paid = $9,658 (taxable income) × 20% (income tax bracket) $ 1,931 Net after-tax income = $12,000 (rents received) − $1,931 (taxes paid) $ 10,069 $10,069 × 3% (after-tax investment return) for 10 years $ 115,429 Total Return = Income ($115,429) + Growth ($67,391) $182,820
The point of this example is which situation is realistic for most investors: 401(k)s earning 10 percent each year in the stock market with no fees being paid, or earning 3 percent each year in real estate appreciation while never increasing the rents? Most investors will probably be more successful with the 401Condo versus the 401(k).
One of the keys to the potential success of the 401condo is leverage, or using other people’s money. You can get loans on real estate. Try going to the bank and getting a loan to invest in mutual funds. Note the bold print in Table 8.9. Appreciation (3 percent of $100,000) is the true meaning of leverage. You are no longer earning appreciation based on the $10,000 contributions but on the leveraged/total value of the investment property.
This can be a double-edged sword, of course, and leverage can easily work against you if you buy a property that is a liability and not an asset. Again, a property is an asset as long as it pays for itself and puts money in your pocket each month. I always recommend to clients looking to buy individually owned rental properties that the properties should have positive cash flow from day one. People have made fortunes from fast appreciation in real estate, but they are also generally the ones you hear about who go bankrupt in bad times.
Clients often ask me how they can come up with the money or cash flow to buy real estate. I look at their 401(k) contributions and point out they already have a negative cash flow being paid each and every month, which we can divert to another investment. Since mortgage interest and property taxes are deductible, they will receive the same tax benefits at the end of the year as if they were still contributing to a 401(k). In the example above, both the $10,000 contributed into the 401(k) and the $10,000 invested in mortgage payments and property taxes are deductible for income tax purposes.
It’s appropriate to address the issue of the down payment and to answer other questions you might have. Many people I meet have money tucked away in emergency accounts, CDs, or other after-tax investments. They would like to buy real estate but are worried about whether they can get renters. What if the property stays vacant? If you are making the major payments with the contributions you would have put into your 401(k), in terms of your cash flow you are in a neutral position and frankly it doesn’t matter if you have renters. You own a piece of real estate, which in the long run will potentially inflate in value. Sure, there might be real estate pull backs, but most will agree, if you have time on your side, real estate is a solid investment and has done far more for building wealth in this country than any 401(k) ever has.
If your job is not very stable or if you don’t consistently add money to a 401(k) or other retirement plan, the 401Condo is probably not for you. But for those who contribute religiously to retirement plans, this idea might benefit your wealth bucket.
In Summary
The goal of this chapter was to take you through an example of putting together the multitude of financial ideas into a working model. The success of a plan depends on taking into account everything, from understanding the background of the client and their goals to their liquidity needs; income and growth targets; as well as having the knowledge, depth, and insight into this turbulent economy we are trying to navigate.
Appendix A includes a variety of other investment plans for different individuals and will provide more exposure to building a successful financial table. You will see that everyone is different and no two plans will be the same, yet at the same time, many of the plans follow consistent themes of investment exposure, time lines of liquidity, and balance. Working with an experienced financial advisor is imperative to the process. If your current advisor does not offer these other types of investments, which are needed to build an ASSET class diversified table, you can always call us at 800-737-8552 or go to the website www.thewealthcode.com, and we will be happy to refer you to someone versed in this philosophy.