
Chapter 5: Building Your Hunting Lab – Part 2
Now that we've discussed the architecture and built our Elastic Virtual Machine (VM), let's continue with installing and configuring the components of the Elastic Stack and our victim VM and ingest some threat information into the stack.
Keeping with the process in previous chapters, we'll use this chapter to build and the next chapter (Chapter 6, Data Collection with Beats and Elastic Agent) to install and configure the host components on the victim machine.
In this chapter, we'll go through the following topics:
- Installing and configuring Elasticsearch
- Installing Elastic Agent
- Installing and configuring Kibana
- Enabling the detection engine and Fleet
- Building a victim machine
- Filebeat Threat Intel module
Technical requirements
In this chapter, you will need to have access to the following:
- VirtualBox (or any hypervisor) with at least 12 GB of RAM, six CPU cores, and 70 GB HDD available to VM guests.
- A Unix-like operating system (macOS, Linux, and so on) is strongly recommended.
- A text editor that will not add formatting (Sublime Text, Notepad++, Atom, vi/vim, Emacs, nano, and so on).
- Access to a command-line interface.
- The archive program tar.
- A modern web browser with a UI.
- A package manager is recommended, but not required.
- macOS Homebrew – https://brew.sh.
- Ubuntu APT – included in Ubuntu-like systems.
- RHEL/CentOS/Fedora yum or DNF – included in RHEL-like systems.
- Windows Chocolatey – https://chocolatey.org/install.
Important note
We'll be building a sandbox to eventually detonate malware for dynamic analysis. It is essential to remember that while we're taking steps to ensure our host is staying secure, we are going to be detonating malicious software that while extremely rare could have the potential to escape a hypervisor. Treat the malware and packet captures carefully to ensure there is not an accidental infection, using segmented infrastructure if possible.
The code for the examples in this chapter can be found at the following GitHub link: https://github.com/PacktPublishing/Threat-Hunting-with-Elastic-Stack/tree/main/chapter_5_building_your_hunting_lab_part_2.
Check out the following video to see the Code in Action:
Installing and configuring Elasticsearch
As we move forward in the chapter (and beyond), we'll not need to repeat these steps as Kibana, Fleet, and the detection engine all reside on the same guest.
Adding the Elastic repository
As discussed previously, using a package manager is much cleaner and easier than simply running binaries as we did in some examples in the previous chapter.
Once again, we'll be using yum or DNF as our package manager, but first, we need to add the Elastic repositories.
We'll use nano as our text editor (because it's a bit easier), but feel free to use vim or the like if you're more comfortable (or any other text editor).
Let's create the elastic.repo file in the /etc/yum.repos.d directory:
$ sudo nano /etc/yum.repos.d/elastic.repo
[elastic]
name=Elastic repository for 7.x packages
baseurl=https://artifacts.elastic.co/packages/7.x/yum
gpgcheck=1
gpgkey=https://artifacts.elastic.co/GPG-KEY-elasticsearch
enabled=1
autorefresh=1
type=rpm-md
Next, let's import the Elasticsearch signing key to validate the installations:
$ sudo rpm --import https://artifacts.elastic.co/GPG-KEY-elasticsearch
Installing Elasticsearch
Now that we have prepped the system to install Elasticsearch, we can run the installation using yum or DNF:
$ sudo dnf install elasticsearch
Once the installation is complete, let's do a quick functions check before we move on to deploying the required security configuration.
Let's set Elasticsearch to start on boot (systemctl enable) and start it (systemctl start):
$ sudo systemctl enable elasticsearch
$ sudo systemctl start elasticsearch
As we did in the previous chapter, let's hit the Elasticsearch API with the cURL program to validate that it's working:
$ curl localhost:9200
{
"name" : "elastic-packetpub.local",
"cluster_name" : "elasticsearch",
"cluster_uuid" : "_yiyiDYdQ620Y6FjODu1JQ",
"version" : {
"number" : "7.11.1",
"build_flavor" : "default",
"build_type" : "rpm",
"build_hash" : "ff17057114c2199c9c1bbecc727003a907c0db7a",
"build_date" : "2021-02-15T13:44:09.394032Z",
"build_snapshot" : false,
"lucene_version" : "8.7.0",
"minimum_wire_compatibility_version" : "6.8.0",
"minimum_index_compatibility_version" : "6.0.0-beta1"
},
"tagline" : "You Know, for Search"
Okay, so we've deployed Elasticsearch; let's move on to securing it so that we can use the detection engine and Fleet.
Securing Elasticsearch
As mentioned previously, the Elastic Stack can be looked at as blocks that you assemble in different ways to meet your specific use case. Some people use just Elasticsearch, some use just Logstash, and some use the entire stack. With that in mind, while greatly improved, configuring Elastic is still a bit of a disjointed process. I should say, I don't have a better solution, but that doesn't change the fact that it's still a bit cumbersome.
To get started, let's update the configuration to enable security.
There is a lot in this configuration file, but most of it is either kept as the default or commented out. Most of it is there as a guide (which is helpful). Again, using nano, open the configuration file and add a few lines. Remember, to save and exit in nano, use Ctrl + X, Y, Enter:
$ sudo nano /etc/elasticsearch/elasticsearch.yml
xpack.security.enabled: true
discovery.type: single-node
network.host: 0.0.0.0
discovery.seed_hosts: ["0.0.0.0"]
xpack.security.authc.api_key.enabled: true
After you've made that change, restart Elasticsearch and verify that the service restarts. If not, review the previous steps:
$ sudo systemctl restart elasticsearch
$ systemctl status elasticsearch
● elasticsearch.service - Elasticsearch
Loaded: loaded (/usr/lib/systemd/system/elasticsearch.service; enabled; vendor preset: disabled)
Active: active (running) since Fri 2021-02-19 04:40:04 UTC; 7s ago
...
Next, we need to configure the passphrases for the accounts. As I've mentioned previously, I prefer simplicity for demonstrations and labs, so I make all of these the same simple passphrase. If you have other processes, please feel free to use them.
Elastic provides a utility to allow us to set the passphrases for all of the accounts that we'll be using:
$ sudo /usr/share/elasticsearch/bin/elasticsearch-setup-passwords interactive
From here, you'll be asked to set the passphrase for several accounts. Remember them as we'll need them later.
Let's test to make sure that we've enabled security and we can authenticate.
Just as before, let's hit the Elasticsearch API with cURL and see what we get:
$ curl localhost:9200?pretty
We get a 401 error back, which as we can see is an authentication error:
...
{
"type" : "security_exception",
"reason" : "missing authentication credentials for REST request [/?pretty]",
"header" : {
"WWW-Authenticate" : "Basic realm="security" charset="UTF-8""
}
...
Now, let's try passing the elastic username, which we set in the previous step. To pass the username using cURL, we can use the –u switch, followed by the username. We should get prompted for a passphrase and then will get the welcome output from Elasticsearch:
$ curl -u elastic localhost:9200
Enter host password for user 'elastic':
{
"name" : "elastic-packetpub.local",
"cluster_name" : "elasticsearch",
"cluster_uuid" : "_yiyiDYdQ620Y6FjODu1JQ",
"version" : {
"number" : "7.11.1",
"build_flavor" : "default",
"build_type" : "rpm",
"build_hash" : "ff17057114c2199c9c1bbecc727003a907c0db7a",
"build_date" : "2021-02-15T13:44:09.394032Z",
"build_snapshot" : false,
"lucene_version" : "8.7.0",
"minimum_wire_compatibility_version" : "6.8.0",
"minimum_index_compatibility_version" : "6.0.0-beta1"
},
"tagline" : "You Know, for Search"
}
Okay, that's the easy part, an Elasticsearch deployment with basic authentication!
Important note
We will not be deploying TLS for Elasticsearch, Kibana, or Beats. TLS is extremely important for production systems to encrypt sensitive traffic between pieces of infrastructure. In a small, non-production lab environment, managing the certificate process falls well beyond the scope. I strongly encourage you to explore the best way for you to deploy TLS in your environment as necessary. The Elastic documentation on configuring and deploying TLS in the Elastic Stack can be found at the following link: https://www.elastic.co/guide/en/elasticsearch/reference/current/configuring-tls.html.
In this section, we built a CentOS VM for the Elastic Stack, installed Guest Additions, and deployed and secured Elasticsearch. While this was a long process, having this appropriately done now will make things easier as we progress.
Next, we will install Elastic Agent. This will be used later as the Fleet server, but we want to install it now and configure it later.
Installing Elastic Agent
On the Elastic VM, Elastic Agent is used to proxy Fleet policies to other enrolled agents. We'll get into Fleet in Chapter 6, Data Collection with Beats and Elastic Agent, and Elastic Agent in detail in almost every chapter later in the book.
Still on the command line, simply type the following:
$ sudo dnf install elastic-agent
$ sudo systemctl enable elastic-agent
This will install Elastic Agent and configure it to start on boot, but not start it yet. We will configure and start it later in this chapter.
Next, we need to move on to Kibana so that we can access Elasticsearch beyond via the API.
Installing and configuring Kibana
Now that we've deployed Elasticsearch, we need to build Kibana. A deployment of Kibana is pretty simple, and connecting it to Elasticsearch using basic authentication isn't terribly difficult either.
Installing Kibana
As we've already installed the Elastic repository, we can simply use that to install Kibana using yum or DNF and enable it to start on boot:
$ sudo dnf install kibana
$ sudo systemctl enable kibana
Now that we've installed and configured Kibana to start on boot, we can continue to connect Kibana to Elasticsearch.
Connecting Kibana to Elasticsearch
Kibana (and Beats for that matter) uses a Java KeyStore to manage and secure credentials. We're going to add elasticsearch.username and elasticsearch.password to the KeyStore.
This is the username and password used by Kibana to authenticate to Elasticsearch. We set these when we configured all of the credentials during the Elasticsearch setup. elasticsearch.username is kibana_system and elasticsearch.password is something you set:
$ sudo /usr/share/kibana/bin/kibana-keystore add elasticsearch.username
Enter value for elasticsearch.username: kibana_system
$ sudo /usr/share/kibana/bin/kibana-keystore add elasticsearch.password
Enter value for elasticsearch.password: ********
Next, we need to allow remote connections to Kibana and configure an encryption key for saved objects. To do this, we'll make one change and one addition to the Kibana configuration file.
Like the Elasticsearch configuration file, there is a lot here, but most of it is commented out and left for reference:
- Update: For the updated information, we'll uncomment #server.host: "localhost" and change localhost to 0.0.0.0 to allow external access.
- Add: For the addition, we'll add the following field with any random 32 characters. It doesn't matter what those characters are or where you add the field:
xpack.encryptedSavedObjects.encryptionKey: "any or more 32-characters"
As we'll be in a non-production development mode and are not using TLS, we need to disable this check for Fleet:
xpack.fleet.agents.tlsCheckDisabled: true
The Kibana configuration will look like this when completed:
# Kibana is served by a back end server. This setting specifies the port to use.
#server.port: 5601
...
server.host: "0.0.0.0"
xpack.encryptedSavedObjects.encryptionKey: "thirty-two-or-more-random-characters"
xpack.fleet.agents.tlsCheckDisabled: true
...
Once we've made those two small changes, let's restart Kibana and connect from our browser (finally):
$ sudo systemctl restart kibana
Now that we've gotten Elasticsearch built and Kibana connected, we should finally be able to use our browser to accelerate into the final configuration steps.
Connecting to Kibana from a browser
If you'll remember, when we built our Elastic VM, we enabled some port forwarding so that we could connect from our host to our guest. Now is when we'll get to see whether that all worked out.
Still on our Elastic VM, we need to make a few port changes to allow remote access. We can do that using the firewall-cmd command.
We'll be adding port 5601 for Kibana, port 9200 for Elasticsearch, and port 8220 for the Fleet server:
$ sudo firewall-cmd --add-port=5601/tcp --add-port=9200/tcp --add-port=8220/tcp --permanent
$ sudo firewall-cmd --reload
Back on our host machine, open a web browser and browse to http://localhost:5601, and you should be presented with a Kibana web interface asking for a username and password:

Figure 5.1 – Kibana login page
Let's log in with the elastic account we created earlier and prepare to connect our victim machines.
In this section, we installed and configured Kibana to connect to our Elasticsearch node.
Next, we need to enable the detection engine and Fleet so that we can deploy and configure Elastic Agent.
Enabling the detection engine and Fleet
Now that we've built and configured security for Elasticsearch and Kibana, let's enable the detection engine and Fleet. The detection engine is how we'll ingest and manage the prebuilt Elastic rules for the Security app and Fleet is how we'll centrally manage collection agents.
Detection engine
The detection engine is where prebuilt detection logic is created and managed for the Security app. Detection logic, as utilized in the Security app, is alerts that are generated by certain different conditions on the endpoints. This is not things such as malware alerts, but more like "a binary is being run from the recycle bin." These rules are hand-created by contributors to the Detection Rules GitHub repository (https://github.com/elastic/detection-rules). We'll spend more time on Detection Rules in the following chapters.
For now, we want to enable the prebuilt rules:
- From your browser, log in to Kibana (http://localhost:5601) with the Elastic account and passphrase you created in the Building Elasticsearch section.
- Once you're logged in, you can either click on the Security tile or click on the hamburger menu and scroll down to Security Overview:

Figure 5.2 – Accessing the Security app
Feel free to explore around here, but for this section, we're just going to be loading the prebuilt rules. We haven't sent any data in yet, so everything will still be blank.
- Click on the Detections tab to open the detection engine:

Figure 5.3 – Security app welcome page
- Next, click on the blue Manage detection rules button on the right:

Figure 5.4 – The detection engine welcome page
- Click on Load Elastic prebuilt rules and timeline templates to load the prebuilt rules. Again, we'll spend plenty of time in the detection engine rules:
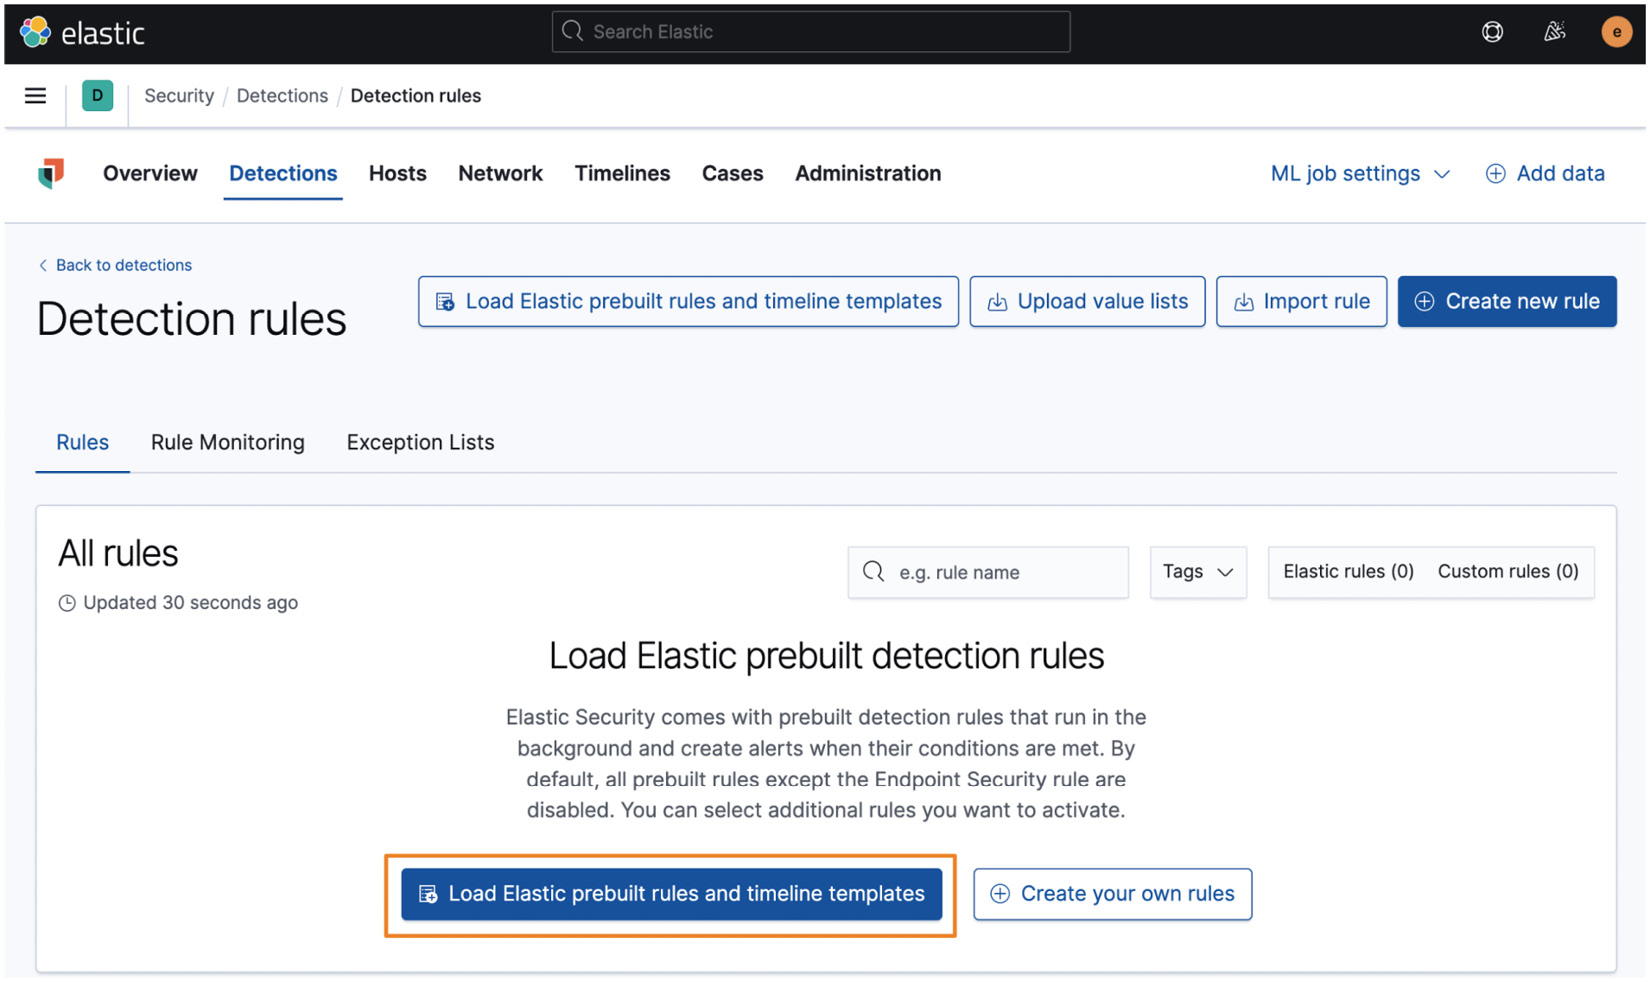
Figure 5.5 – The Detection rules welcome page
This will load hundreds of rules and we'll see a success flyout after a few seconds:
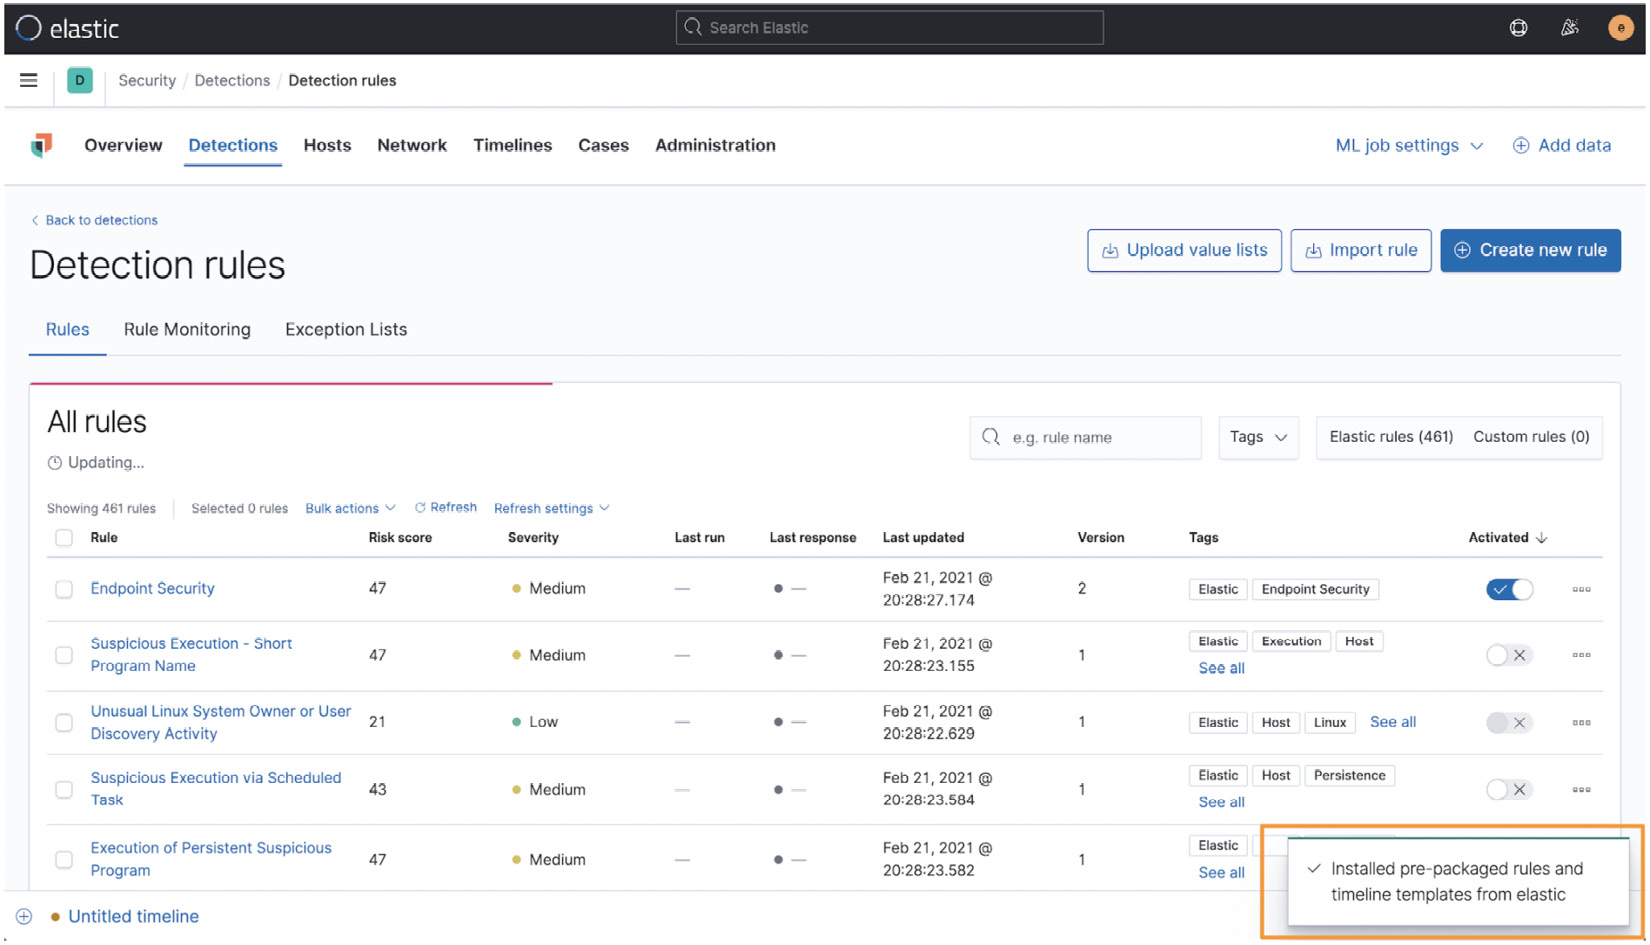
Figure 5.6 – The detection rules successfully loaded
In this section, we loaded prebuilt Elastic rules into the detection engine. We'll return to this Security app as we continue. Next, we're going to build a Fleet policy that we can deploy into our victim machines.
Fleet
Fleet is the central management hub for deployed collection and protection agents.
Important note
As of the time of writing, Fleet is still in beta. There could be modifications or changes needed to these steps as Fleet becomes Generally Available (GA) in the future. Review Elastic's official Fleet and Elastic Agent documentation for updates: https://www.elastic.co/guide/en/fleet/current/fleet-overview.html.
To get to Fleet, click on the hamburger menu and then scroll down to Fleet:

Figure 5.7 – Accessing Fleet
Fleet will take a minute or so to load for the first time. This is a one-time delay.
Once Fleet loads, you'll be on the welcome page. Feel free to explore this app, but for now, we're going to focus on building a Windows and Linux collections and defense policy:

Figure 5.8 – Fleet welcome page
Next, in the upper-right corner, you'll see a cog wheel and Settings. Click that and change your Fleet Server hosts to https://172.16.0.103:8220 and Elasticsearch hosts to http://172.16.0.103:9200 (respectively). Click Save and apply settings:
Note
Fleet Server and Elasticsearch are using the same IP and that IP is your internet network (intnet) IP address. This intnet IP was configured by the DHCP steps we completed in Chapter 5, Building Your Hunting Lab – Part 2. Additionally, the Fleet Server host is over HTTPS, not HTTP. There is no additional configuration needed to set up HTTPS; it is managed by Fleet. Ensure you use the right IP address as the screenshots here may be using a different IP schema.
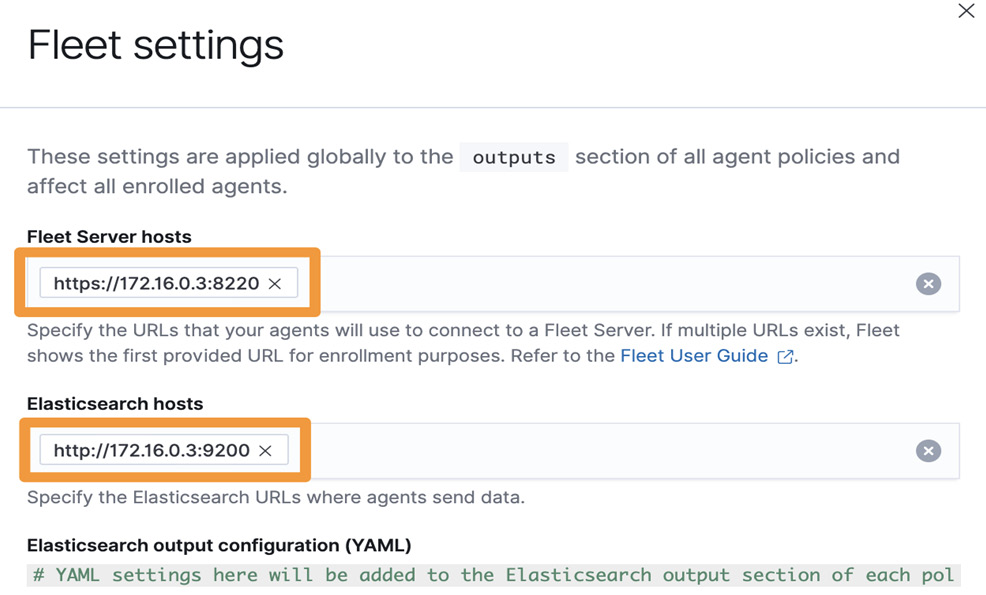
Figure 5.9 – Fleet settings
This setting will configure Elastic Agent so that it is reporting to Kibana for configuration updates as well as sending its data into the proper Elasticsearch instance.
Next, we need to collect an enrollment token. This enrollment token will be used to configure an Elastic Agent as an actual Fleet server. This Elastic Agent will run on the same Elastic server and handle the management of other Elastic Agents. All data will still be sent directly to Elasticsearch.
Click on the Agents tab and then click on Generate service token:
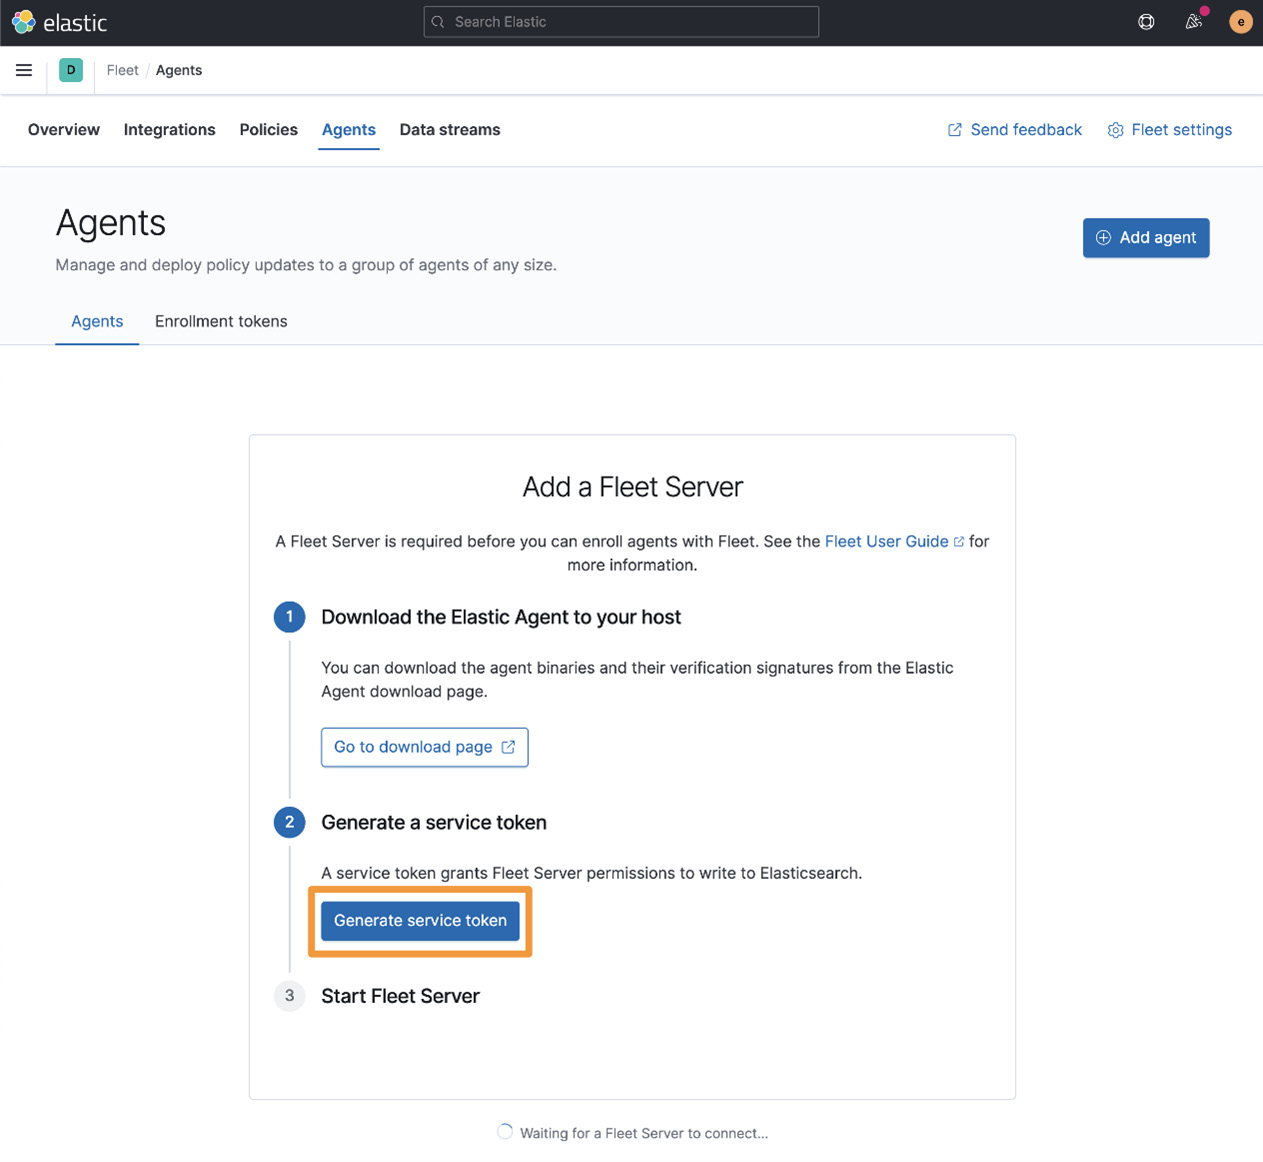
Figure 5.10 – Add a Fleet Server
Next, you'll be presented with a token. You shouldn't need this again for our lab, but you can copy it down.
Under the service token, you'll be asked what platform you want to configure Elastic Agent for. We're using CentOS and installed Elastic Agent using DNF in a previous step, so select RPM / DEB from the dropdown and copy the enrollment syntax:
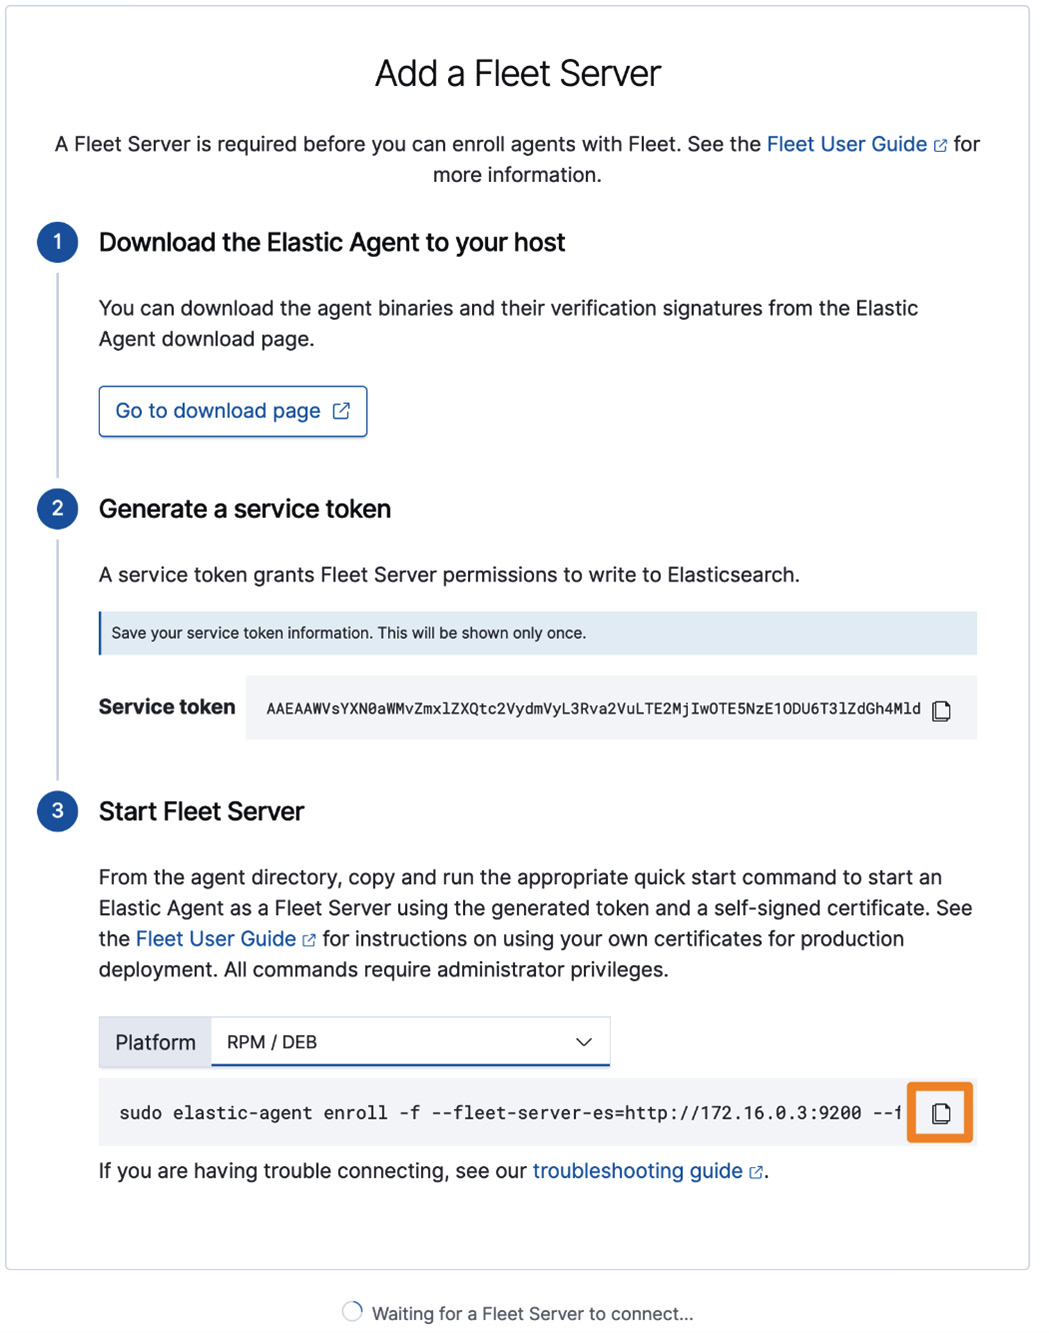
Figure 5.11 – Fleet enrollment command
Next, we'll leave Kibana and complete the enrollment on the command line of the Elastic VM.
Enrolling Fleet Server
On the command line of the Elastic VM, we simply need to run the command that we copied in the previous step (it will include your assigned service token). On the command line, type the following (your IP address may be different):
$ sudo elastic-agent enroll -f --fleet-server-es=http://172.16.0.3:9200 --fleet-server-service-token=your-service-token
Finally, let's restart Elastic Agent as a Fleet server and show it enrolling into Kibana. Still on the command line, type the following:
sudo systemctl restart elastic-agent
Next, back in Kibana, on the Fleet Agents page, we should see Elastic Agent enroll as a Fleet server. The agent could take a few minutes to check in:

Figure 5.12 – Elastic Agent enrolled as a Fleet server
In this section, we enabled and configured both the detection engine and Fleet. Both of these Kibana features will be paramount when we get into the Elastic Security app in Chapter 8, The Elastic Security App.
Now that we have built our storage and analysis platform (the Elastic Stack), we need to build the victim machine that we'll use to collect data from.
Building a victim machine
In this section, we'll be building a machine that will be used to collect data from. While collecting normal system information is valuable, we'll be collecting security-relevant data from these systems. We don't want to detonate malware or perform risky behavior on a production system, so we'll be making a system purely to generate malicious data for us to analyze. We also call these victim machines.
In this section, we'll build one victim machine. Feel free to mix and match this approach with more than one Windows or Linux machine, use a different version of Windows or Linux, or if you're running low on resources, pick one or the other instead of both.
Collecting the operating systems
First, we need to collect the operating system ISO images for Windows.
Windows
Microsoft uses the Evaluation Center to provide 90-day copies of their software to IT professionals for zero cost. These are not meant for production deployment as their functionality will be reduced after the 90 days. For a long-term strategy, you should consider purchasing a license for Windows.
Browse to the Evaluation Center (https://www.microsoft.com/en-us/evalcenter/evaluate-windows-10-enterprise) and download the ISO - Enterprise version of Windows.
Now that we've collected the operating system, let's build it into a VM in VirtualBox.
Creating the virtual machine
In these next steps, we'll install the operating system, perform updates, and configure the guest additions.
To get started with Windows, let's open VirtualBox and click on the New icon. Use the same steps that you used when configuring the Elastic VM previously. Note that you'll not need to forward any ports for the Windows VM.
Of note, for Windows, we'll be using Network Adapter 1 and Network Adapter 3:
- Name: Windows 10 Victim Box (this can be anything you want).
- Machine Folder: This should be pre-populated, but you can adjust it if needed.
- Type: Microsoft Windows.
- Version: Windows 10 (64-bit).
- 4,192 MB RAM.
- 30 GB hard disk (feel free to increase this if you have the resources).
- Set the boot order to Hard Disk then Optical.
- Network: Adapter 1 – Internet.
Remember to attach your Windows ISO:

Figure 5.13 – Windows virtual machine details
Now that we have built the VM, we can proceed with installing the operating system.
Installing Windows
First, we'll install Windows. The Windows VM is largely using default settings. There is a bit of a cumbersome process of setting up a local account instead of using an online Microsoft account, but there's a pretty simple workaround we'll use.
In VirtualBox, select the Windows VM and click the green Start button. Your VM should start up into the Windows installation process.
You should select the default options until you get to the section to enter your product key. As we're using an evaluation version, we can simply select I don't have a product key to proceed:

Figure 5.14 – Windows virtual machine product key selection
Continue with your default selections until you are asked what type of installation you need. Here, select Custom: Install Windows only (advanced):

Figure 5.15 – Windows virtual machine installation type
Allow the Windows installation to continue; it will take a few minutes. Afterward, the VM will reboot a few times.
Eventually, you'll get to select your region and keyboard layout. Select whatever keyboard layout you prefer.
When you get to the network configuration, click in the lower left on Skip for now. We don't have a network connection to the internet yet. You'll get asked a second time to configure the network; select No:

Figure 5.16 – Skipping the network connection
Now that you have bypassed using the internet to set up an account, you can move on to create a local account:

Figure 5.17 – Windows virtual machine – create your account
Create your account name, passphrase, and security questions. Decline enabling Cortana, decline the activity history, and uncheck all of the privacy settings. Finally, click on Accept and allow the installation to complete.
Once you're completed the installation, using the same steps highlighted previously, re-enable Network Adapter 3.
Finally, let's do a test to check to make sure that the Windows guest can reach the Elastic box.
Connection test
First, turn on your Elastic VM (if it isn't already running). Do a local test, from the Elastic VM, to make sure Elasticsearch is running properly (curl -u elastic localhost:9200). If you don't get the Elasticsearch welcome message, go back to the Building Elasticsearch section and ensure you've followed all the steps.
Next, from the Windows VM, open a terminal window (cmd.exe or powershell.exe) and check to see whether you can connect with curl -u elastic 172.16.0.3:9200 (remember, to use your intnet IP address as it may differ from the example). You should get the Elasticsearch welcome message!

Figure 5.18 – Windows virtual machine connecting to Elasticsearch
Now that we have a fully functional Windows VM, we should install Guest Additions to make the VM experience a bit smoother.
Installing VirtualBox Guest Additions
Unlike when installing Guest Additions on Linux, we don't need to hop around with adding and removing virtual disks. We can simply select Devices in the VM menu, and then Insert Guest Additions CD image….
Back in the Windows VM, open the D: drive, right-click on VBox Windows Additions, and select Run as administrator. Select all of the defaults and then shut down the machine.
Enabling the clipboard
While the Windows VM is still shut down, click on Settings and then Advanced, and then set Shared Clipboard to Host To Guest so we can copy data into the VM:

Figure 5.19 – Enabling Shared Clipboard
In the preceding screenshot, we're enabling the ability to copy data into the VM using the clipboard.
Enabling Network Adapter 3
Now we're going to add an additional network adapter. This will be Adapter 3. At the end of the configuration, you'll have two network adapters enabled: Adapter 1 and Adapter 3.
While your Windows VM is shut down, click on Settings and then Network and enable Adapter 3. Ensure it is set to NAT:

Figure 5.20 – Enabling Adapter 3
In the preceding screenshot, we're enabling Adapter 3 on the Windows VM.
Windows Update
I recommend letting your Windows updates run. This isn't necessary, but I've found that letting this process complete makes the process a bit easier versus trying to battle for resources.
If you choose not to run updates, that's totally fine, but I do recommend downloading the new Edge (or Chrome, Firefox, or Safari) browser because the default Edge has a hard time accessing some of the pages that we'll need to download additional packages.
Last mile configurations
Finally, we'll be doing some "last mile" configurations to ensure that we're collecting the most amount of value from the PowerShell logs.
PowerShell script block logging records the content of all the script blocks that it processes. This is very valuable in tracking the malware and adversaries that leverage PowerShell.
Enabling ScriptBlockLogging is accomplished with a simple PowerShell function:
- Open PowerShell as an administrator.
- Paste the following PowerShell function into the PowerShell window:
function Enable-PSScriptBlockLogging
{
$basePath = 'HKLM:SoftwarePoliciesMicrosoftWindows' +
'PowerShellScriptBlockLogging'
if(-not (Test-Path $basePath))
{
$null = New-Item $basePath -Force
}
Set-ItemProperty $basePath -Name EnableScriptBlockLogging -Value "1"
}
The preceding code will enable PowerShell script block logging, which will allow us to record detailed information about PowerShell activities on the victim machine.
Now that we have built our victim machine, let's learn how we can use Filebeat to import threat data.
Filebeat Threat Intel module
Filebeat has a Threat Intel module that is intended to import threat data from various feeds. We'll set up three of the feeds that do not require any third-party accounts, but you can set those up as well if you have accounts.
In Elastic 7.12, the Threat Intel module collects data from five sources:
- Abuse Malware
- Abuse URL
- Anomali Limo
- AlienVault OTX (free account required)
- MISP (additional infrastructure required)
We'll go through the steps to set up Abuse Malware, Abuse URL, and Anomali Limo:
- Log in to the command line of your Elastic VM and install filebeat using DNF:
sudo dnf install filebeat –y
Once you have installed Filebeat, you need to update the configuration and start collecting data.
- First, let's enable the Threat Intel Filebeat module. We can simply run the following:
sudo filebeat modules enable threatintel
- Now that we've enabled the Threat Intel module, we just need to do a few tweaks in the module configuration:
sudo nano /etc/filebeat/modules.d/threatintel.yml
- Once we're in the configuration file, change the settings for MISP and OTX from true to false. Under the Anomali section, uncomment the username and password:
# Module: threatintel
# Docs: https://www.elastic.co/guide/en/beats/filebeat/7.x/filebeat-module-threatintel.html
- module: threatintel
abuseurl:
enabled: true
# Input used for ingesting threat intel data.
var.input: httpjson
# The URL used for Threat Intel API calls.
var.url: https://urlhaus-api.abuse.ch/v1/urls/recent/
# The interval to poll the API for updates.
var.interval: 10m
abusemalware:
enabled: true
# Input used for ingesting threat intel data.
var.input: httpjson
# The URL used for Threat Intel API calls.
var.url: https://urlhaus-api.abuse.ch/v1/payloads/recent/
# The interval to poll the API for updates.
var.interval: 10m
misp:
enabled: false
# Input used for ingesting threat intel data, defaults to JSON.
var.input: httpjson
# The URL of the MISP instance, should end with "/events/restSearch".
var.url: https://SERVER/events/restSearch
# The authentication token used to contact the MISP API. Found when looking at user account in the MISP UI.
var.api_token: API_KEY
# Configures the type of SSL verification done, if MISP is running on self signed certificates
# then the certificate would either need to be trusted, or verification_mode set to none.
#var.ssl.verification_mode: none
# Optional filters that can be applied to the API for filtering out results. This should support the majority of fields in a MISP context.
# For examples please reference the filebeat module documentation.
#var.filters:
# - threat_level: [4, 5]
# - to_ids: true
# How far back to look once the beat starts up for the first time, the value has to be in hours. Each request afterwards will filter on any event newer
# than the last event that was already ingested.
var.first_interval: 300h
# The interval to poll the API for updates.
var.interval: 5m
otx:
enabled: false
# Input used for ingesting threat intel data
var.input: httpjson
# The URL used for OTX Threat Intel API calls.
var.url: https://otx.alienvault.com/api/v1/indicators/export
# The authentication token used to contact the OTX API, can be found on the OTX UI.
var.api_token: API_KEY
# Optional filters that can be applied to retrieve only specific indicators.
#var.types: "domain,IPv4,hostname,url,FileHash-SHA256"
# The timeout of the HTTP client connecting to the OTX API
#var.http_client_timeout: 120s
# How many hours to look back for each request, should be close to the configured interval. Deduplication of events is handled by the module.
var.lookback_range: 1h
# How far back to look once the beat starts up for the first time, the value has to be in hours.
var.first_interval: 400h
# The interval to poll the API for updates
var.interval: 5m
anomali:
enabled: true
# Input used for ingesting threat intel data
var.input: httpjson
# The URL used for Threat Intel API calls. Limo has multiple different possibilities for URL's depending
# on the type of threat intel source that is needed.
var.url: https://limo.anomali.com/api/v1/taxii2/feeds/collections/313/objects
# The Username used by anomali Limo, defaults to guest.
var.username: guest
# The password used by anomali Limo, defaults to guest.
var.password: guest
# How far back to look once the beat starts up for the first time, the value has to be in hours.
var.first_interval: 400h
# The interval to poll the API for updates
var.interval: 5m
- Now that we've configured our module, we need to configure Filebeat itself to write to Elasticsearch. If you remember, we set a passphrase for Elasticsearch, so let's update it in the Filebeat configuration:
sudo nano /etc/filebeat/filebeat.yml
- Go down to the Elasticsearch Output section, uncomment out the username and password, and update your password. Save and exit this file:
# --- Elasticsearch Output ---
output.elasticsearch:
# Array of hosts to connect to.
hosts: ["localhost:9200"]
# Protocol - either 'http' (default) or 'https'.
#protocol: "https"
# Authentication credentials - either API key or username/password.
#api_key: "id:api_key"
username: "elastic"
password: "password"
These configuration files are available in the chapter's Technical requirements section.
- Now that we've updated this configuration file, let's push our dashboards and ingest pipelines into Elasticsearch:
sudo filebeat setup
- Finally, we can start Filebeat and set it to start on boot:
sudo systemctl enable filebeat
sudo systemctl start filebeat
Let's go into Kibana and check to see whether our data is flowing into the Discover app.
Log in to Kibana, click on Discover App on the left, and change your index pattern to filebeat-*, and you'll see your Threat Intel data flooding in! We'll use this in Chapter 8, The Elastic Security App.
In this section, we finalized our configuration of Elasticsearch, Kibana, and the guests. This will set us up nicely for future chapters.
Summary
I agree, there was a lot covered in these last two chapters. There are a lot of moving pieces to get a working lab, between the victim machine and the collection and analysis platform. I thought about doing some "figurative hand waving" with a lot of what I have seen in these kinds of kits: "Step 1: Install Elasticsearch; Step 2: Install Windows; Step 3: Profit." I observe those kinds of guides frequently and find that that approach misses a lot of crucial details; so, we went from the ground up, through every step. While that may seem slow for some that are experienced, it's important to get this right or the rest of the book isn't going to be a lot of fun if all you can do is read about how this could work. Hands-on for the win!
In the next chapter, we will configure the systems that will collect our data from the victim machine and store it in Elasticsearch.
Questions
As we conclude, here is a list of questions for you to test your knowledge regarding this chapter's material. You will find the answers in the Assessments section of the Appendix:
- What port does Kibana run on?
a. 9200
b. 5601
c. 8220
d. 8080
- What port does Elasticsearch run on?
a. 5601
b. 22
c. 443
d. 9200
- What does Kibana use to store Elasticsearch authentication credentials?
a. KeyStore
b. Shadow file
c. Vault
d. Password file
- What is the name of the agent central management tool in Kibana?
a. Detection engine
b. Uptime
c. Fleet
d. Heartbeat
- What does script block logging do?
a. Records the content of PowerShell script blocks
b. Logs endpoint network traffic
c. Monitors access to the Elasticsearch API
d. Logs roles and users in Kibana
Further reading
To learn more about the subject, check out the following links:
- About logging in Windows: https://docs.microsoft.com/en-us/powershell/module/microsoft.powershell.core/about/about_logging_windows?view=powershell-7.1
- Elasticsearch reference: https://www.elastic.co/guide/en/elasticsearch/reference/current/index.html
- Kibana reference: https://www.elastic.co/guide/en/kibana/current/index.html
- Fleet reference: https://www.elastic.co/guide/en/kibana/current/fleet.html