4.2. LEARNING FROM OUR MISTAKES
Having both invested in the markets for just about 19 years now, we have logged a sizable blotter of mistakes, some bigger than others. Some mistakes have to do with the macro view of trading while some are more specifically related to trading mechanics. In some cases, mistakes have led to significant new developments in our trading methods. In this section we will examine some of the more significant mistakes from 19 years of investing in the markets and the solutions or lessons that were derived from these experiences.
4.2.1. A Case Study in Overconfidence: Gil Morales
After I made big money in 1995, as I discussed in detail in Chapter 3, I was on top of the world. For the first time in my life I had a significant amount of money to my name, well into six figures, and, to quote Gordon Gekko in the movie Wall Street, "At the time it seemed like all the money in the world."
That money alone would have been enough to get carried away with, but another force was working to help inflate my ego. As a broker at PaineWebber, Inc. (now part of UBS Financial Services) my success in the market was also spilling over into my business, which was taking off as well, and as an emerging "big producer" I was given a big, new office with floor-to-ceiling windows on the 30th floor of the Twin Towers in Century City, a city only in name that is essentially a posh cluster of high-rises wedged between Beverly Hills and Santa Monica, California. In many ways Century City serves as a stylish urban setting, away from the grime of downtown Los Angeles some eight miles to the east, that houses the financial, legal, and talent businesses that serve the entertainment-industry wealth that resides in the hills separating West Los Angeles from "the Valley" of San Fernando. It is, as some might say, "a preferred venue."
If there is any single industry where egoistic materialism and self-indulgence are acceptable, even glorified, traits, the retail brokerage business is it. Where else is one likely to witness two brokers getting into a steamy feud over who has a "real" Mercedes-Benz? And, of course, there was what I dubbed the "peacock syndrome," or the tendency for retail brokers to strut around in their well-tailored raiment. Many brokers took serious, perhaps far too serious, pride in their suits, shirts, ties, and shoes. How you folded your handkerchief and placed it in your suit jacket breast pocket, whether you used a single- or double-knot on your necktie, whether your cufflinks were sterling silver, and other pointless fashion details were given special regard. You might often find a small group of three or four brokers in the office admiring each other's tailored suits. Those who did not conform were scorned. I recall one broker, who fancied himself as a "broker to the stars," making fun of my eyeglasses. This struck me as odd, because up until that time, I had taken a rather utilitarian view toward my ophthalmologic needs, and had no idea my eyeglasses would become criteria by which to judge my "fashion-worthiness," and hence worth to society, at least by the standards of retail brokers!
Such was the culture of "consultative" sales in the financial industry. When I was new in the business, one of my sales managers admitted to me that he wanted new "FCs" (financial consultants) to buy a big house and an expensive car, and to get heavily into debt doing so. That way they would be highly motivated to work hard and sell, sell, sell in order to afford their lifestyle. The need for things and more things provided the essential Pavlovian stimulus necessary to inspire brokers to push the "sales process" along. It seemed that this basic premise provided the foundation for the retail broker culture that I was in at the time. The need to express one's worth through mindless materialism forced brokers to sell, and it was management's desire, if not its unstated goal, to have their brokers, their "sales force," out there selling with such material needs in mind.
All of these factors were stewing together in a toxic brew that caused my ego to mutate into a large, bulbous mass. I now fancied myself an "expert" investor of "Livermorian" stature, and I began to believe that I could employ my "hunches" on top of my investment system. The fact that I had made over 500 percent in one stock, C-Cube Microsystems (CUBE), the year before had confirmed my skill, had it not? Reading through O'Neil's book, How to Make Money in Stocks, one can find mentions of investors making 100 percent or 200 percent, but I knew of nobody who had ever made over 500 percent in one year, and so I was sure that this made me special. Unfortunately, I neglected to inform the market of my "specialness," as it was getting ready to inflict some painful lessons on my inflated ego.
4.2.1.1. The Lumisys Lesson
In November of 1995 a new company named Lumisys, Inc. (LUMI) came public, and at the time I was very impressed with its business, which consisted of technology used to digitize images for the medical industry. I saw this as revolutionary stuff similar to what C-Cube Microsystems had done with their technology compressed video images for transmission over the Internet and on personal computers. To me, Lumisys represented another company utilizing another type of image-related technology to create innovative new products that changed and made far more efficient the way physicians and medical staff used and accessed medical images such as X-rays. It had to be a winner; I was sure of it.
When Lumisys came public in November of 1995 I was still busy with C-Cube, and so it was easy to remain disciplined and wait for Lumisys to form its first base. This did not occur during April 1996, and by then I had been out of C-Cube for a few months and dabbling here and there with new stock ideas that were not altogether working too well. In 1996 I was relying primarily on Daily Graphs® for my charts, and so was focused mostly on the dailies. Figure 4.1 shows the daily chart of Lumisys in April 1996 when it came flying out of what looked like a five-week base to me at the time, and because I was already in love with the company's products, I didn't need too much persuading to buy what I saw as a perfect massive-volume breakout. However, it did not turn out as perfectly as I thought it would!
In Figure 4.1, the daily chart of Lumisys from April 1996, the trendline breakout looks quite impressive as it occurs on the largest daily volume spike in the entire chart going back to the November IPO date. The breakout also occurs after a shakeout below the 50-day moving average on increasing volume, which I saw as setting up a "shakeout-plus-three" type of buy signal where the stock drops out below the prior lows of the base at around 18 or so and then turns back to the upside. This constitutes the "shakeout," and adding three points to the support low at 18 gives you a buy point at 21, so that when the stock comes through that 21 price level it is generating a buy signal. In the case of Lumisys, I had a trendline breakout and a "shakeout-plus-three" buy signal. In my mind, this made the breakout even more powerful. Given that I already had a prior bias and that I was already in love with the company's products, I bought this breakout hand over fist in a sheer fit of overconfidence.
Figure 4.1. Lumisys, Inc. (LUMI), daily chart, April 1996.: Chart courtesy of eSignal, Copyright 2010

4.2.1.2. One Mistake Breeds More Mistakes
The first mistake I made here was having a prior bias in that I already believed that the company's products made it a sure win-win situation now that the technicals looked to be falling into place. While you can use your knowledge of a company's business and product line to help develop conviction in a potential winner, such conviction should never be allowed to override your basic system of stock selection and management. Your reasons for buying a stock should first be based on how well it fits the criteria for you to take action on it, based on your particular investment. What you are able to learn about the company should then help you develop the conviction necessary to fully capitalize on a potential big, winning stock. However, such knowledge should never get in the way of operating solely by your investment methodology. It should not work the other way around—don't fall in love with a company's business unless and until your system is telling you to buy the stock for the right reasons first. I was doomed from the start by being in love with Lumisys before I had ever bought a share of the stock. This was a classic case of getting the cart before the horse.
My overconfidence was further encouraged by the fact that I thought that two buy signals—the trendline breakout and the shakeout-plus-three buy setup—somehow gave added power to the stock's big-volume move run for new highs. On this basis I bought the stock aggressively. When I think back on this, my naïveté amazes me, and studying old charts of Lumisys makes that fact even more apparent. Probably the most painful thing about reviewing one's past mistakes is seeing just how much capacity one can have for making incredibly stupid investment decisions.
Figure 4.2, another daily chart of Lumisys breakout shows some other flaws I did not consider in the stock's chart back then. The first was the depth of its base and the fact that the stock came up straight off the bottom of the base without taking any time to digest some very rapid gains as it motored back up through the 50-day moving average and toward new high price ground. The second mistake was getting aggressive; that is, buying a large position, in a stock that traded only 120,000 shares a day on average. The price move that followed the breakout was very playable as a short-term trade, actually, and if one had recognized the flaws in the breakout one could have sold and taken a profit. Instead I was convinced I had another C-Cube Microsystems on my hands. And since I was convinced of this, it was only a matter of holding the stock long enough to realize the huge upside price move!
Figure 4.2. Lumisys (LUMI), daily chart, 1996—straight up off the bottom.: Chart courtesy of eSignal, Copyright 2010
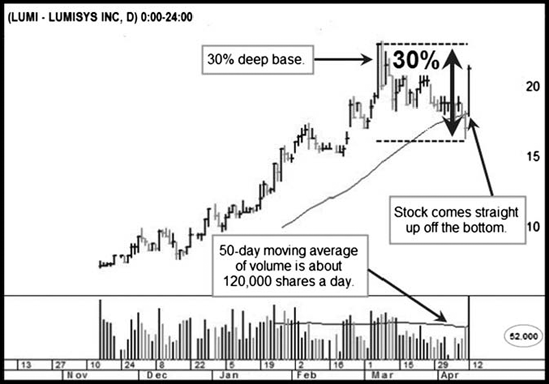
Figure 4.3. Lumisys, Inc. (LUMI) weekly chart, 1996–1997.: Chart courtesy of eSignal, Copyright 2010

The weekly chart of Lumisys (Figure 4.3) also reveals that the five-week base I thought I saw on the daily chart was only a three-week base. The first two weeks of the base, as I saw it, were actually up weeks, and it is only on the first week down that we begin counting weeks in a base. Also notice that those two weeks had very wide weekly ranges and closed mid-range. The base itself was not long enough to properly consolidate the move the stock had made from the time it went public in November 1995 to April 1996. That move was a threefold move, and it is likely the stock should have built a longer, more constructive base of at least six weeks in order to properly digest the prior upside move. On top of it all, even if Lumisys' base had been five weeks in length, this still would have been too short for a first-stage base. Generally second-stage base breakouts can have a base-length of five weeks minimum, but a first-stage breakout should likely put in more time in order to properly set up a big intermediate-term price move, particularly if the stock has had a big upside move prior to building its first base.
Once Lumisys had broken out, it ran up more than 20 percent in only three weeks, thus causing me to invoke the "eight-week rule" whereby a stock that is able to break out and move up that far that quickly must be held for at least eight weeks. As you can see in Figure 4.3, sitting with the stock for eight weeks resulted in getting blown out of the position as it broke down below its original breakout point and headed back to its original IPO price.
4.2.1.3. Lumisys Leads to Broader Understanding of O'Neil Methods
While Lumisys was a painful lesson, it did help me refine my technique a bit. The first thing I did was stop falling in love with and trying to figure out great company concepts before the stocks themselves showed up on my radar screen. Unless and until the stocks showed up in my weekly scans of the printed Daily Graphs® books, they were not to be bothered with. From then on, I would never buy a stock without consulting a weekly chart to make sure I was buying a stock that has built a proper base of at least six weeks in length. Also, first-stage bases had to be a minimum of six weeks in length. Second-stage bases of shorter five-week durations would be acceptable, but for first-stage bases the stock should be coming out of a longer consolidation, and certainly no less than six weeks in length.
I did not address the problems created for me by the eight-week hold rule since I believed that had I paid attention to the initial factors, such as the improperly short base, I would not have been placed in the situation of invoking the eight-week hold rule to begin with. Based on the difficulty I had in selling the stock because it was so thin, I established a rule of never buying stocks that traded less than 300,000 shares a day. I recall quite clearly when Lumisys was breaking down and how I was frantically trying to sell the stock. For me the situation was exacerbated since I had a number of clients in the stock as well, and I had to get them out first. Every time we entered an order to sell, it took several minutes to get filled since we had to go to outside market makers in Lumisys and bids were scarce. I was so shell-shocked by that experience that I vowed to never buy another thinly-traded stock.
Back in 1996, 300,000 was a reasonable minimum average daily trading volume requirement number, but these days I use a minimum of 350,000 to 500,000 shares in average daily volume when screening for stocks on the long side, and prefer to buy stocks that trade into the millions of shares of stock a day. When I conducted my post-analysis on my Lumisys mistakes I looked at other historical big winners that started out as thinly traded stocks, and I noticed that while they would start out as thinly traded stocks, once they asserted their roles as serious market leaders their average daily trading volume would increase substantially. In general, average daily volume is a sign of the types of investors trafficking in any particular stock. Stocks with heavy institutional participation tend to be highly liquid and relatively actively traded. Thus the higher the average daily trading volume in a stock, the more likely it has strong institutional participation and sponsorship. As well, I determined that waiting for an IPO's average daily trading volume to "mature" as institutional interest and participation in the stock increased over time was a good way to determine when a stock was approaching "big stock" status, for instance, one that was gaining a strong institutional following and hence could be nearing a strong upside inflection point. This was a key discovery that resulted from my Lumisys experience, and in the end likely made it worth the high "tuition" that I was charged for the education.
To illustrate this concept of average daily trading volume "maturing" as a stock gains leadership status and a larger institutional following, we can observe the weekly chart of Crocs, Inc. (CROX) from 2006 through 2007 (Figure 4.4). Note that the small gray line running through the volume bars, the 10-week moving average of volume, steadily moves higher as institutional investors flock to CROX. In this case, the significantly expanding volume reached a critical mass in April of 2007 when CROX assumed the role of a major market leader in the 2007 bull market and began to move sharply to the upside.
Figure 4.4. Crocs, Inc. (CROX), weekly chart, 2006–2007.: Chart courtesy of eSignal, Copyright 2010

4.2.1.4. The Big Stock Principle Is Born
My experience with Lumisys served as the genesis for what eventually became my Big Stock Principle, a basic underlying principle of O'Neil methodologies that slowly dawned on me over the next couple of years. The essence of the Big Stock Principle is that in any economic and market cycle certain companies appear on the scene that represent the leading edge of what is happening in the economy with respect to the new industries, new economic developments, and other themes that serve as essential drivers for the economy at any given point in time. In turn, because of their status as key companies representing the niches of growth, whether broad or narrow, in any given economic cycle, institutions have no choice but to own these stocks, and once they do they tend to be a staple of institutional portfolios through many market cycles, even when they aren't bona fide leaders. In the 1970s these were stocks like Pic N Save and Tandy Corp., in the 1980s they were stocks like Intel Corp. (INTC) and Microsoft (MSFT), in the 1990s America Online (AOL) and Cisco Systems (CSCO), in the 2000s names like Amazon.com (AMZN), Apple, Inc. (AAPL), Google, Inc. (GOOG), Baidu.com (BIDU), and Research in Motion (RIMM), to name just a few from each cycle out of many, many more. These are the stocks to own in any bull market cycle as they represent the areas to which institutional research will direct money flows, and in the process create huge upside price moves. As well, because of the broad, committed institutional sponsorship in these stocks you have a sort of insurance policy when these stocks sell off since there are usually logical pullback areas where institutions will naturally come in to support their positions.
One of the key characteristics of "big stocks" is that they don't trade 120,000 shares a day on average, they trade several million. Unless there is a cartel of grandmothers out there who instead of buying two shares each of Microsoft and AT&T are buying large blocks of leading stocks, it is institutional money that drives the market, and it is in this river of money flow where you want to set yourself right into the middle. And the only way you can do that is by striving to own the "big stocks" in any market cycle. My horrendous experience in Lumisys led me on the path to discovering for myself this "big stock" principle as I realized thinly-traded stocks cannot possibly be big stocks.
It was not until December of 1998, when I was long a huge position in Charles Schwab & Company (SCHW) as it was rocketing to the upside (Figure 4.5), that I received a quick call from Bill O'Neil, who liked the look of American Online (AOL), another fast-moving winner in the late 1998 bull market. The funny thing about AOL was that during workshops that we also presented at, albeit in a supporting role, Bill would sometimes get moving very fast as he discussed with the audience various leading stocks from many diffrent historical market periods, rapidly pulling up data from his memory, he would refer to AOL as "American" Online, instead of "America" Online, which is the correct name. If you understood how Bill's mind works, which is essentially a vast database of stock market history and information, you realize that this was due to a wire in his brain that was crossing over another wire that was remembering when "American" Airlines was a huge winner back in 1962–1963 when the market started a big rally right in the midst of the Cuban Missile Crisis. I answered the phone, and Bill said one thing: "AOL, now that's a big stock." At that point I had an epiphany, complete with trumpets trumpeting and angels heralding, as the skies opened up and the Big Stock Principle suddenly became clear to me.
Figure 4.5. Charles Schwab & Company (SCHW), weekly chart 1998–1999.: Chart courtesy of eSignal, Copyright 2010

I also found that the Big Stock Principle is also at work in short-selling, since the best short-sale targets in a bear market are precisely those stocks that were the big leaders in the immediately preceding bull market phase. Institutions that have loaded up on big leaders will in turn create a wave of selling that continues to wash over the stock in a sustained downtrend during a bear market, and we will have more to say about short-selling when we get to Chapter 8.
4.2.2. Missing the Move in Solar Stocks: Gil Morales
One of the primary pitfalls, at least for me, of managing money in the public realm and with other "partners" in your money management firm is that you will be subject to outside influences from clients and business associates who have their own sets of emotions and opinions. Not that this is necessarily bad, but you have to insulate yourself from these influences in spite of how difficult it may be in real time, particularly if such individuals and influences come from an academic point of view that is outside one's investment methodology's "epistemology," so to speak.
In September–October 2007 I went long a number of solar stock names at exact, perfect buy points. One of my biggest positions was in First Solar (FSLR), which I had correctly identified as one of the "big stock" solars and which was forming a jagged cup-with-handle formation similar to what America Online (AOL) had formed in October 1998, just before it launched on a 67-week, 460 percent price run to the upside. The weekly chart of First Solar (FSLR) in Figure 4.6 shows the jagged cup-with-handle formation. I had noticed this pattern setting up before the breakout, and the three weeks that closed tight around the 10-week (50-day) moving average looked very constructive. I also put together the idea of AOL as a precedent for a "jagged," V-shaped cup-with-handle formation that worked quite well in late 1998 to early 1999. The similarity of FSLR's chart (Figure 4.6) to AOL's from 1998 (Figure 4.7) was very compelling, and the solar group as a whole was also starting to set up technically, with a number of strong patterns in several other potential solar leaders. FSLR also had an interesting, lower-cost technology that did not use the more common polysilicon in its solar cells. In 2007, shortages of polysilicon gave FSLR's non-silicon, thin-film technology an advantage over its polysilicon-dependent competitors.
Figure 4.6. First Solar, Inc. (FSLR) weekly chart, 2007, a "big stock" in the solar group.: Chart courtesy of eSignal, Copyright 2010

Figure 4.7. America Online (AOL), which became Time Warner, Inc. in 2000, weekly chart, 1998.: Chart courtesy of eSignal, Copyright 2010

This was my "big stock" solar stock, and I was playing it big, buying shares along and around the 50-day moving average and the $100 price level before the stock began to break out. On September 21st, volume in FSLR began to pick up early in the trading days, so I began adding to my position, as I intended to get very heavy in the stock on the breakout. You could not ask for a better buy situation, both in FSLR and the group at large, which was breaking out en masse. With such group confirmation, it was clear that a major group move was taking place. As a group, the solar stocks offered a compelling, buyable group opportunity, since the 1999 move in dot-com, Internet-related stocks. Cup-with-handle bases were seen in stocks like Suntech Power Holdings Co., Ltd. (STP) shown in Figure 4.8, as well as JASO Corp. (JASO), shown in Figure 4.9.
Figure 4.8. Suntech Power Holdings Co., Ltd. weekly chart, 2007–2008.: Chart courtesy of eSignal, Copyright 2010

On Friday, October 17, 2007, my business partner wrote me the first of what became a long chain of emails on Friday and continuing into the weekend where he insisted that the market was not acting right, and that I should "lock in" gains of around 10 percent that I had as of Friday's close. To understand how far away this type of thinking is from my style, I should point out that movements, and hence "gains," of 10 percent are actually quite miniscule relative to the normal volatility and movement I experience given my specific investment approach within my overall methodology which dictates that one let one's winners run. One email, which was written with a tone of supercilious authority, in my view, argued against my view that we were in a window of opportunity:
I have gone back to 1985 looking at periods when a NASDAQ rally has occurred on conspicuously light volume including a dearth of major accum[ulation] days. The only NASDAQ advance that even comes close to the present one—when measured by either light volume or major accum[ulation] days—was the July 16, 1996 move, which showed only one major accum[ulation] day in the first eight weeks, but then showed a bunch of them from that point on. As you know, light volume reflects uncertainty among market participants.
Figure 4.9. JASO Solar Holdings Co. Ltd. (JASO) weekly chart, 2007—another perfect cup-with-handle setup in the solar group.: Chart courtesy of eSignal, Copyright 2010

My big mistake was in entertaining such drivel. The fact is that I was taught by Bill O'Neil to watch my stocks FIRST and the action of the indexes SECOND. Indexes can weaken, sometimes having intermediate corrections of 7–12 percent with leading stocks holding in tight and building normal, constructive bases. To unload your holdings on the basis of what the indexes are doing is ridiculous given this basic concept. I replied to my partner by citing this exact principle. I received the following response: "At different times, yes, I believe the leaders do provide subtle hints and are more important (e.g., dozens breaking out while the averages languish following a correction). However, the leaders can only go so far amid shoddy demand in the general market."
What makes this exchange so comical is that the immediate week before the weekend when this email exchange took place I had told my trader and Director of Trading Bill Griffith that the move in solars was significant, and that we were in the middle of a perfect window of opportunity to make some decent profits going into year-end. I also felt that the mass, group breakout in solars, with so many of them simultaneously forming perfect base formations such as we see in the charts of FSLR, STP, JASO, and SPWRA (Figures 4.8 through 4.10), was signaling a significant move was under way, and hence a fantastic profit opportunity. Given my experience and the fact that I know the market always tries to buck you off your positions, I told my trader, Bill Griffith, that we would have one "hairy pullback" before these things launched and that we must do everything we could do to hold our positions in solar stocks given some basic parameters that gave the stocks room for a shakeout.
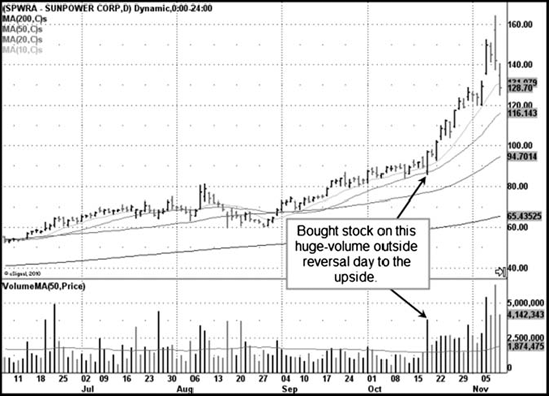
During that trading week I had also taken a position in another solar that had broken out and was in the middle of an upside run, Sunpower Corp. (SPWRA) shown in Figure 4.10. On October 18th SPWRA staged a big outside reversal to the upside on huge volume. Given that the solar group was on fire, I viewed this big-volume turnaround as quite positive, and took a position in SPWRA in one of my funds in the mid-90 price area. In hindsight, I am amazed at just how perfectly the ducks lined up in September–October 2007.
Unfortunately, the barrage of bearish emails from my partner over the weekend of October 17–19, worried about "locking in profits" as well as numerous stories in the media over that particular weekend about the market's resemblance to October of 1987, the infamous Black Monday crash, started to unnerve me and essentially threw me off track.
Figure 4.10. Sunpower Corp. (SPWRA) daily chart, 2007.: Chart courtesy of eSignal, Copyright 2010
On Monday, October 22nd, the big shakeout that I had told my trader was coming and through which we must strive to hold our solar stock positions, finally came. Because I had allowed the influences of the bearish media and a bearish business partner within my money management firm to shake me off my predetermined path I veered from my plan. I had already laid out the parameters of how I would handle a nasty market shakeout, which I was fully expecting sometime in October, and I had complete conviction in the solar stocks given the evidence of all the ducks lining up in a row in the group and the window of opportunity that was opening in the market. The lesson here is clear, and I want to make it plain that I do not blame my former partner or the media. I blame myself, because I violated a simple premise of trading, and that is to plan your trade and trade your plan—alone and free of distractions from the emotions and opinions of others! Despite the fact that I knew I was in all the right stocks at the right time, on Monday, October 22nd I dumped my FSLR and other solar stocks, overcome by the fears induced upon me by external influences.
As Figure 4.11 shows, FSLR simply shook out below its 20-day moving average, closed up on the day, and never looked back. I had a huge position in that stock, and I dumped it all that day. I tried to come back into the stock later on over the next few days after dumping it, but being so shell-shocked by the initial mistake, I never got my position back. The irony is that on the same day FSLR reversed and closed back in the black and above the 20-day moving average. This is in fact a pocket pivot buy point! I could have simply recognized this and bought all my FSLR back and then some on the very same day I sold it all.
Figure 4.11. First Solar, Inc. (FSLR) daily chart, 2007.: Chart courtesy of eSignal, Copyright 2010

In addition to having the pocket pivot point weapon I didn't have in 2007, today I also use a rule of letting a stock close before selling on any break of the 20-day moving average, as stocks often will reverse intraday to close back above the moving average. If I had this rule then, I would have held FSLR on October 22, 2007. Rather than using a moving average, such as the 20-day or 50-day line, as an "absolute" barrier, I now view moving averages as the median of a "zone" and instead watch how a stock acts "around a moving average." Stocks can frequently venture below a key moving average on a short, intraday basis, or even for a day or two or more, before climbing back above the moving average. It is likely that so many traders are conditioned to sell on breaches of perceived "absolute" support such as right at a moving average line that this naturally carries a stock past a moving average as the momentum of selling, as the stock breaks the line, carries it downward temporarily. This creates price/volume action around the moving average that should be monitored to ensure that the move below the moving average line does not shake one out of one's position. Today, my view of moving average lines and support levels encompasses the idea that they actually represent the medians or mid-points of "zones" around which stocks find support or resistance. In addition, once a stock breaks a key moving average, such as the 20-day moving average for the first time, it must also confirm the "violation" of the moving average by moving below the intraday low of that first day where it breaches the 20-day line. This can be applied to any moving average, by defining this as a clear "violation" if and only if the stock moves below the intraday low of the first day under the moving average, so that one day's action is not enough to confirm such a violation.
The last quarter of 2007 also proved the principle that you must watch your stocks FIRST and the market indexes SECOND, as the NASDAQ chart in Figure 4.12 shows. While the NASDAQ topped out in early November, those very solar stocks whose action I had insisted to my partner that I should be watching instead of getting caught up in the minutiae of the indexes, well, they just continued on higher.
In the end, traders must insist that they trade alone, free from distractions and interference from the outside world, whether such distractions come from business partners, the media, or any other source of external input that can throw you off your path. Remember this rule: Trade your plan, and plan your trade, and do it all with a minimum of outside influence or input, preferably remaining in the Livermorian ideal of "trader's isolation."
Figure 4.12. NASDAQ Composite Index daily chart, July–November 2007. The market tops but solar stocks continue higher, proving that you must watch your stocks first, and the market indexes second.: Chart courtesy of eSignal, Copyright 2010

4.2.3. Too Short for Too Long: Gil Morales
My biggest losses have always come on the short side of the market. Since I consider the size of a mistake to be directly correlated to the size of the loss resulting from the mistake, these are then by definition big mistakes. In 2002 I took some serious heat by staying too short too long off the bottom in October of that year. By the second year of the most brutal bear market in 70 years, everyone and everything was negative, and there were plenty of compelling and logical reasons why things were likely to get worse. I remember giving a presentation to a group of institutional investors in a very nice high-rise office building in downtown Los Angeles. During the presentation, we let one eager institutional technician come up and give his view on why the Dow and the S&P 500 had to come down further because they had not yet caught up to the NASDAQ on the downside. There were nods all around the room, and I was one of those nodding heads. After all, the year before, 2001, I had been up over 170 percent, mostly on the short side, and I was still intoxicated by the taste of blood playing the short side of the market.
By the time the bottom in 2002 came around, everyone had become so conditioned to the bear market that nobody could see their way through to the possibility that the market had bottomed. By this time, all of us at William O'Neil + Company, Inc. were so tired of looking for a bottom that we were starting to feel as if we would never see a bottom, and if we did, none of our indicators would help us find it. After a discussion with Bill O'Neil on September 9, 2002, I wrote in my trading diary, "On a super-cycle basis it may be that the market has come into a once-every-20 years, once in every five cycles phenomenon—that's why all the indicators and methods don't work in finding the bottom. This last bull cycle has an extraordinary number of excesses—like a two-headed monster."
As late as September 23, 2002, the market was still suffering from the overhang of gloom and doom, and the following entry from my trading diary gives some idea of how Bill O'Neil perceived the muck of a long, two-and-a-half-year bear market: "Bill feels the administration's emphasis is all on Iraq, where it should be, but he thinks there should be some emphasis as well on the economy. The failed Japanese bond offering is very bad, but also due to the fact that the Japanese have failed to let bad debt fail and allow their system to clean itself out via the 'creative destruction' process that is the hallmark of our system. Weakness in Japan and in Europe is significant, [and] will have an effect on our markets." By the end of September the market was breaking to fresh lows, and at this point I was very short the market going into October 2002. I could feel my saliva glands working overtime as the expectation of tasting blood on the short side again overcame me.
Figure 4.13 shows the NASDAQ Composite Index breaking to new lows in late September into early October. The market was certainly not looking too happy. If you were already as morose about the market as I was, this move to new lows was a sign to get aggressive on the short side. Even Bill O'Neil was looking for more downside, as he called me around October 4th to tell me he was looking at shorting a big-cap tech leader from the 2000 bull market! That's how bad it was looking! Bill told me he believed this particular big-cap tech company has a big problem in that they have bought too many companies. In business you don't want to put yourself in the position of having to manage too much—if you buy fifty companies you then have fifty managements to straighten out. It's just too daunting."
We didn't know it at that time, but we were in for a big surprise. On October 10th, the market bottomed and began to move sharply to the upside, with the NASDAQ Composite Index posting a 4.42 percent move off what would be its final lows in the 2000–2002 bear market. Three days later the NASDAQ put in a fourth-day follow-through, gapping up and rallying a total of 5.06 percent on the day with volume up big. If you were short those first four days off the bottom you felt some serious blast heat as the market launched off the lows. Being heavily short, I was one of those lucky investors standing in the way of this freight train. The follow-through day smacked me good, but the next day the market gapped down, although on lower volume, enticing me to stay short, but the second day after the follow-through gapped back to the upside, and the market began to grind higher over the next 12 days before gapping up again. After that initial gap-up, the market pulled in hard over the next several days, with the NASDAQ pulling down from the high of 1420 that was hit the day after the election to a low five days later at 1319.06.
Figure 4.13. NASDAQ Composite Index, daily chart, 2002–2003. The bottom of 2000–2002 bear market is finally put in.: Chart courtesy of eSignal, Copyright 2010

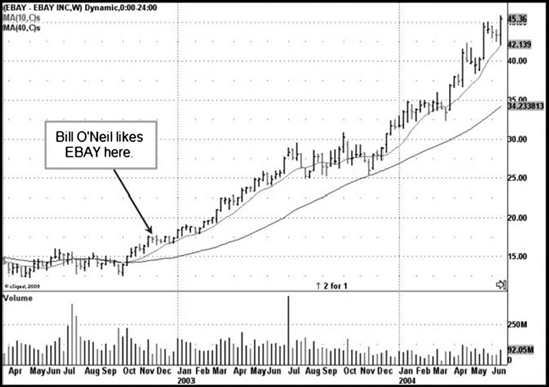
All of the erratic movements in the indexes kept me trying to short the market, as I could not find any traction on the long side. I still could not see how the market could continue to rally. Then, on November 20th Bill O'Neil called me on my cell phone while I was teeing off at the 11th hole at the country club. Golf outings are far and few between for me, and Bill had never called me on the golf course before, so I knew something was up. He sounded pretty excited as he discussed the Bush Administration's announcement earlier in the day that it would be implementing broad economic stimulus measures, including tax cuts, in their pending economic stimulus plan. At that point Bill told me he thought the firm's institutional advisory group, which I was managing at the time and which was responsible for advising over 500 institutional investor clients of William J. O'Neil + Company, Inc., should "be aggressive on the idea that the market environment is getting more constructive, and that October was likely a permanent bottom." One of the names Bill had identified as a potential, re-emerging type of leader from the prior dot.com bubble market in 1999 was EBAY. As well, he felt that "some new, underplayed names have a good shot at working." I made a note, "Bill likes EBAY," and left it at that. Slowly, however, it dawned on me that, unlike Bill, I was not sensing the flow of the market at that stage. In early October, Bill O'Neil was thinking about shorting stocks, and I was shorting stocks as well. By November, Bill was probably buying EBAY, and I was still shorting the market! I had missed the boat by a long shot. Sure, Bill O'Neil could consider shorting stocks near a market bottom, but the difference is that, unlike me, he recognized that this was incorrect and simply and decisively turned with the market when it counted. Buying EBAY in mid-November 2002 was typical of his ability to smell the big stock when the market began to turn. Watching him do this was a big lesson for me in the wake of my stupidity and stubborn persistence in shorting a market that was bottoming and starting a new bull market. I was so blinded by my negativity that I could not see anything positive at the very moment when the market was turning positive.
Figure 4.14. eBay, Inc. (EBAY), weekly chart, 2002–2003. Bill O'Neil identifies the "big stock" following the market turn in late 2002.: Chart courtesy of eSignal, Copyright 2010
To confuse matters even more, by December the market was beginning to roll over again as the market's recovery remained uneven, at best. Even Bill O'Neil was feeling a little frustrated, despite owning EBAY, which was still acting well as it continued to track sideways. As my trading diary entry of December 5, 2002, indicates, "Bill says it is difficult to stick with the system. The Dow could pull back to 8200–8400 and the NASDAQ to 1250–1350. The market won't come out of this very well unless the government does something dramatic." The next day a quick call from Bill yielded the following short trading diary entry on December 6, 2002: "The market is just reacting to news—has no rudder. But the real problem remains the post-bubble economy."
At this time gold was beginning a new move to the upside, and Bill O'Neil observed on December 13, 2002: "The move in gold is concerning. It's telling you something!" To me, the market's action in December 2002 got me negative enough to start looking at the short side of the market again. The move in gold was offering another cautionary clue, as I saw it, and on December 20, 2002, I logged in my trading diary the following comment from Bill O'Neil: "Gold responds to fear, but there is some fundamental basis to the recent move in gold. We must get through the next couple of months before we can see where the market is going."
The key point here is that despite the fact that the market's recovery off the October low was uneven and choppy, this was not necessarily indicating that the market was about to go into a bear phase and a new leg to the downside. I learned here that markets are not always black or white. Sometimes they can be gray and uncertain, and the smartest position to take is no position at all—just let the market work itself out. Bill O'Neil understood that while the market was still having a tough go of it, it was more a matter of waiting for the window of opportunity to open wide than taking one side or the other, bull or bear, with respect to the market.
On January 8th, the Bush administration announced a stimulus plan that included accelerated reduction of income tax rates for individuals and the elimination of taxes on dividends for individual investors. On January 23rd, Bill O'Neil conveyed what is an essential stock market truth, and the final lesson of my late 2002 punishment in the markets, which I logged in my trading diary as, "Regardless of how bad things get in the market don't underestimate the power of the government to do something." Accommodating Fed monetary policy combined with a newly elected Bush administration's ability to push through an agenda of tax cuts to stimulate the economy, given the Republican majorities in Congress at the time, meant that the government was going to have its way. By the time the regime of Saddam Hussein collapsed in March 2003, the new bull market was in full swing.
The main theme underlying all of my mistakes that resulted from persistently trying to short a market bottom was that I failed to understand that after a long, brutal bear market, the major market indexes can put in a final, permanent low, but that doesn't mean they have to immediately shift into bull mode. The market is not always black or white, bullish or bearish; and because it was difficult to make upside progress after the October follow-through, that is, was not strongly "bullish," I came to the conclusion that the market must then be "bearish." Jesse Livermore himself said that he preferred to avoid using terms like "bull" or "bear" to describe a market since he believed that prevented him from being objective about what the market was telling him in real time. My need to label the market a "bear" or a "bull" led me to do so deductively, so that if it wasn't definitively bullish, then I "deduced" that it must be bearish. In reality, the market was still in a phase where it was, despite the strong follow-through on October 15 that marked the final low of the great 2000–2002 Bear Market, not in a bull or bear phase, but more accurately in a "recovery" phase. This was a valuable lesson at the time, and helped me avoid getting raked to death on the short side for many years. Then the bear market of 2008–2009 came.
The bear market of 2008–2009 was without question the most unnerving I have ever experienced. Other bear markets were simple affairs for me—I was either in cash or I was selling short. In March of 2008, the end of the first leg down in the 2008–2009 bear market set in with the panic that occurred when Bear Stearns, for all practical purposes, went out of business over the weekend of March 15–16. It likely would have just been another panic low experience for me, but this time something was quite different, because I was now personally involved in the financial crisis. Bear Stearns was the prime broker for both of the private funds I was running at the time, and the funds were domiciled with Bear Stearns. I was staring at the possibility of having my funds lost in a potential Bear Stearns insolvency. Although our Bear Stearns representatives assured us our funds were safe, I didn't assume that I could trust them, as they were only telling us what somebody else higher up was telling them to tell us. The uncertainty of the entire situation over that weekend was quite unsettling. Needless to say, that was not a pleasant weekend for me. Sure, I can handle losing money in the market, but watching money evaporate into thin air because your prime broker went belly up was just too much for me to take. When you find yourself in the grip of an exogenous event that is beyond your control, it is a very uncomfortable feeling. As a trader, I like to think that at least I am in control of my own destiny. In this case, I was in a situation not of my making and quite out of the realm of my control. It was, quite frankly a frightening experience that left me somewhat shell-shocked and with a strange sense of insecurity and foreboding.
The crisis of March 2008 was averted when J.P. Morgan stepped in and bought out Bear Stearns at $10 a share. J.P. Morgan also took over as prime broker of the private funds I was managing at the time, which was ironic since The House of Morgan was considered the safest place to be at the time, and here we were, prime brokered with Bear Stearns, which was going to be saved via a J.P. Morgan acquisition. While we were out of the woods with respect to the possibility of seeing our funds evaporate in a Bear Stearns insolvency, the entire affair left me with a sense of distrust and mistrust, something similar to what people might experience the first time they are in an earthquake. That solid ground you thought you were standing on is now perceived as not being as solid as it used to seem, and so your sense of security is diminished. I suffered from a sort of financial stress-disorder syndrome for several months after that.
As I regained my composure I played the short bear market rally that lasted roughly from March to the beginning of June 2008 successfully. By the end of summer, another leg down in the bear market was brewing, and by September the market began to split wide open. I was again playing the market on the short side, but not as aggressively as I should have. While I did make money on the short side in 2008, finishing up a few percent for the year after posting a deficit in the first three quarters of the year, I felt that I could have been up much more, perhaps 50 percent or more, based on my post-analysis. I was far too timid, and missed what was essentially the "sweet spot" of a severe leg down within an overall bear market that was shaping up to be quite brutal. Again, however, I was letting the opinions of a business partner unduly influence me as he insisted with professorial superciliousness and authority that "nobody can make money on the short side."
I came to realize that making about 10–15 percent on the short side in the last quarter of 2008 represented a very poor showing given the extent and velocity of the downdraft in September–October 2008. I had essentially allowed myself to be influenced by outside forces that led me to become overly cautious and timid in my approach to the short side. Because I had difficulty making money on the short side earlier in the year I allowed others to influence me into believing that my short techniques were deficient and that shorting is simply "too difficult" to execute. What I have learned since then is that the methods detailed in the book I co-wrote with William J. O'Neil, How to Make Money Selling Stocks Short are perfectly sound, but the key is to wait for the exact moment when the "line of least resistance" has been broken and the optimal window for short-selling is opening. As you can see in Figure 4.15, the "sweet spot" for short-sellers was essentially a sharply accelerating three-week downside break. If you sat there with your finger in your ear, you missed the sweet spot. If you caught the sweet spot, that's all you needed, and you could have taken the rest of October through December 2008 off. My colleague Chris Kacher has confirmed that the patterns and methods outlined in How to Make Money Selling Stocks Short are deadly accurate when the proper window of opportunity opens, as we will see in Chapter 8, and that this is the key to fully and optimally exploiting a downside break in the market during a bona fide bear market leg down. You must wait for your opportunity! As Livermore said, "There have been many times when I, like many other speculators, have not had the patience to await the sure thing." When it comes to shorting, avoiding danger is best achieved by having the patience to wait for the sure thing. That window in September–October 2008 was that sure thing, and I played it meekly as I had allowed myself to be talked into the idea that "nobody can make money on the short side."
Figure 4.15. Dow Jones Industrial Averages daily chart, 2008. The "line of least resistance" is broken for the short-seller, providing a short, "sweet spot" window of opportunity.: Chart courtesy of eSignal, Copyright 2010

Frustrated by not fully exploiting a massive downside break in September–October 2008, despite being up in a year when the markets were down some 50-odd percent, toward the end of 2008 I became fascinated with the situation in the banking sector, which represented "ground zero" of the bear market. I had already had a visceral experience with the chaos that was engulfing the financial sector with my Bear Stearns experience in March of 2008, and when I began to research the situation it was evident to me that the situation was quite dire. I concluded that the bear market of 2008 would not end until we had seen at least two or three major money center banks go under, such as Citigroup (C), Wells Fargo (WFC), or Bank of America (BAC). At that time I felt that if one could add two-plus-two one could comprehend that the big banks were all insolvent, and it was only a matter of time before the final housecleaning would arrive and that it would be marked by one or more of these money center banks being taken over by the government. At that point the excesses in the system would begin to be allowed to be wrung out of the system, and the market and the economy could go about the process of recovery and rebuilding again.
What I didn't realize was that the excesses were going to be propped up instead, and I severely underestimated the ability of the U.S. government and the Federal Reserve, in concert with central banks and sovereigns across the globe, to orchestrate it so successfully. This was a major mistake, and it was fostered by my belief that by March 2009 the Fed had no traction and that you could "fight the Fed." I had surmised that since preemptive rate cuts throughout 2007 and 2008 combined with $1.8 trillion in bailouts by the end of September 2008 did nothing to prevent the market's sharp break in September–October 2008, the excesses of the financial establishment were going to be washed away in a final break to new lows. In addition, an uncharacteristic reliance on examining the financial statements, the "fundamentals" of the financial stocks reinforced such dire conclusions to the point that I allowed it to override my basic price/volume approach to the markets. This reliance on "fundamentals" coincided with my reading of doom and gloom investment newsletters detailing all that was wrong with the world. My research into the financial crisis took me to all kinds of web sites with their own version of why the crisis would drag down and destroy the global financial system. While their prognostications of Armageddon may yet turn out to be correct, they have little to do with what is going on in the stock market at any particular moment. Unfortunately, given my shell-shocked memories of the Bear Stearns meltdown in March 2008, I was easily persuaded that the worst was yet to come.
Three major factors in my psychology were coming together to create a perfect storm: (1) frustration over not fully exploiting the September–October 2008 short-selling window of opportunity, (2) allowing myself to be influenced by outside sources, and (3) allowing fundamentals and my sense of dread as a result of my experience with Bear Stearns in March 2008 to override my normal reliance on price/volume action. By March of 2009, newspaper headlines were regularly featuring the word "depression." Given that I have 19 years of experience as a professional investor, this was one time when I could not see the forest for the trees. When everyone is talking "depression" and all looks lost, historically, this is when markets bottom! But I could not see it, and so I kept fighting the market.
Figure 4.16. American International Group (AIG), daily candlestick chart, March 2009.: Chart courtesy of eSignal, Copyright 2010

Some of the rebounds off their lows in financial stocks such as American International Group (AIG), shown in Figure 4.16, were absolutely insane, or at least I thought so at the time. It flew in the face of the "fundamentals." AIG had collapsed to a low of $6.60 a share by March 9, 2009, and eight trading days later hit $40 a share intraday. As you can see on the chart, on an intraday basis, the stock doubled on one day alone, the fifth day up off the bottom and the second day of a sharp move off the lows that took the stock right up into the 50-day moving average. Notice the long "candle wick" indicating that the stock was hitting some serious resistance at the 50-day line. The next day showed a small "hanging man" type of formation, which is a cautionary sign at the end of a sharp move to the upside, and so I decided AIG could be shorted in size right here. The next day the stock ran to the upside, nearly 50 percent. Given what I knew about the financial state of financial stocks, I considered these moves to be "preposterous," and I was certain that they would immediately reverse course to the downside, despite the fact that there was absolutely no price/volume evidence to indicate that such an occurrence was imminent! As I saw it, the only thing to do was to short the stock again as it got above the 25 price level. Of course from there, the stock gapped up another 10–15 points, finally "kissing" the 40 price level. Shorts in AIG, even persistent shorts that kept shorting and covering as the stock ran up, got hurt badly.
Figure 4.17. Financial Select Sector SPDR (XLF), daily candlestick chart, March 2009.: Chart courtesy of eSignal, Copyright 2010

These types of moves off the lows were typical for most of the financials, as the daily chart of the Financial Select Sector SPDR ETF known as the "XLF" in Figure 4.17 shows. For short-sellers like myself who just wouldn't take "no" for an answer, the XLF offered a couple of teases when it broke below its 50-day moving average on heavy volume twice during the latter part of March 2009, gapping down the second time, before launching again to the upside.
They say that wood ticks wait up in the branches of trees, and when an animal passes below the scent of the animal triggers a response in the wood tick whereupon it drops down, presumably onto the subject animal where it then digs in and proceeds with taking a warm meal from its unsuspecting host. If, by chance, the animal passes before the tick drops down and gets to it and the tick instead lands on the ground, perhaps, say on a decent-sized rock, it will attempt to "dig" into the rock until it kills itself, literally grinding itself into the rock. I now refer to this as "tick syndrome" in traders when they persist in digging into a rock; essentially continuing with the same strategy or trade that the market continues to punish. Watch out for "tick syndrome," which I define as a situation that can occur whenever you find yourself stopped out of the same trade twice or more. What I was doing in March of 2009 was entirely opposite to my normal methods of "flowing" with the market; I was in fact "fighting" the market instead, and this alone was a sign that I was on the wrong track. Today, I ask myself a key question from time to time, Am I flowing with or fighting with the market? The answer is often useful in getting back on the right track.
In my post-analysis it is clear that the mistakes I made were primarily psychological, and a chain of events and situations served to fuel excessive reliance on what I thought I knew, as well as what I feared, about the instability and potential for further crisis in the global financial system. The events of March 2008 set me off on a psychology of dread and insecurity that had fuelled rising concern on my part regarding the "trustworthiness" of the financial establishment, and this led to my delving into the "fundamentals" of the situation to the point where I was certain it would all be over only when some of the big money center banks began to topple. I also began subscribing to and reading a number of gloom and doom newsletters, which also reinforced my negative views on the market. Also, as a result of missing an opportunity in September 2008 to make big money on the short side by playing what was the true short-selling "sweet spot" too lightly, and given that I "knew" the financials were going down, I was primed to make big money shorting banks, brokers, insurers, commercial REITs, whatever else I was certain was about to collapse as a result of the "final solution" in the 2008–2009 financial crisis.
While all of this doom and gloom made sense from an "intellectual" level, it doesn't mean the market is going to follow any preset path as a result of its "sensibility and logic." Remember this basic principle: The market is going to do what the market is going to do at any point in time, not what you think it should do. Therefore, do not ever allow yourself to get into a state of mind where you begin interpreting the market's action in terms of what you think "should" occur, but rather learn to remain in the present and allow the market to tell you what it is actually doing. Had I adhered to this principle I could have avoided most of my troubles.
As a trader there will be many times when you will be thrown by the market; basically it fools you by throwing you into a situation that is unfamiliar, or cluttered with other exogenous factors. When this happens, you are most susceptible to deviating from your normal rules, and it is precisely such simple, and often minor, deviations that are the cause of most investment mistakes. If you find yourself thrown in this manner, and put into a position where the market is not making any sense to you, then the best course of action is to simply back away and wait for the market to return to a state where you are able to make sense of it. Ask yourself at any time, Is the market making me want to operate outside of my normal methods? If so, this may be telling you that it is a good time to back away from the market, a practice Livermore himself admitted he failed at doing many times, which is to insist on "always having an interest" in the market. Not simply backing off to wait for the sure thing to develop can be costly.
One of the big lessons for me after my debacle of March 2009 was that, like Livermore, I did not always have to be in the market, to have "an interest at all times." But this need to always be "doing something" in the market is fed by the fact that since 2005 I have been running money in the public realm for private, high net-worth investors, and this is quite a bit different from managing money in the "cocoon" of William O'Neil + Company, Inc., where I did very well. In the public realm, particularly the hedge fund world, "monthly performance" is ridiculously overemphasized. At O'Neil this was never a factor, and for the most part you were left alone to manage your portion of the internal account in isolation, in keeping with the Livermorian ideal of trading in solitude. Bill O'Neil might saunter into your office once or twice a year, but usually this was for the purpose of going over mistakes, particularly if you were in a trading slump, in the interests of helping you get "out of the ditch." In the public realm, some investors are constantly calling, asking "how're we doing?" over and over again, like Bart and Lisa Simpson in the back of Homer's car incessantly parroting, "Are we there yet? Are we there yet?" With people trying to look over your shoulder constantly and wondering "how we're doing" at every twist and turn in the market this begins to affect your psychology, which is a very fragile thing, particularly for O'Neil–style investing. Professional portfolio managers who are reading this book will likely understand what I am talking about, especially the way that overly skittish investor clients can affect one's psychology. For me, it kept me trading far too long and during periods when I should have been doing nothing, rather than pushing to "do something" in order to meet the unrealistic expectations of investor clients who overly emphasize short-term, monthly performance. Today, I have adopted Ed Seykota's policy of allowing his investors one phone call a year—any more than that and he sends their money back. There is nothing more distracting or damaging to one's fragile psychology than nervous and emotional investor clients—Ed Seykota understands this better than anybody. So rather than entertaining their emotion with soothing comments, he simply amputates the distraction entirely by eliminating the client. I call this, the Seykota Standard, and I now adhere to it.
Another "thematic" lesson that I learned in September–October 2008 and March 2009 was that I was wrong to lose faith in my short-selling investment methodologies in the spring–summer of 2008. Instead, I did not recognize an important principle of short-selling, which is that my short-selling methods work quite well when implemented at the proper stage of a market decline, but lose their effectiveness at certain stages of a bear market. "Tick syndrome" kept me trying to make money in March 2009 on the short side that I felt I "should have made" in September–October 2008. Unfortunately, I foolishly failed to recognize that March 2009 was not September–October 2008 because the market was in a much different stage of the bear market decline, and that it was in fact reaching a full-court-press panic low in March 2009.
There are many academics who will give you hundreds of reasons why you cannot do something, or why something cannot work. If you surround yourself with such individuals, you will never even attempt to accomplish anything for fear of failing. In my view, it is best to limit outside influences when it comes to one's investment thinking, whether that is related to a current market view or perceived opportunity in a particular stock or whether it is related to your methodology. If you choose to converse or consort with other investors, then do so with like-minded investors who will reinforce your investment "epistemology," but for the most part, strive to trade independently at all times.
Jesse Livermore preferred to ensconce himself in the solitude of his special trading office with no opportunity for disturbance. At William O'Neil + Company we used to joke that we should all trade from a room where we would remain "cocooned" from all outside influences, and only our chart books would be allowed to be passed under the door, along with "three squares" (meals) a day. Whenever I had a major cable financial channel on the TV that was mounted on the wall of my office at William O'Neil + Co., Inc. and Bill O'Neil walked in, the first thing he would say is "turn that thing off." Richard Wyckoff wrote: "When you understand stock market science you have no concern about important developments in your morning newspaper." I believe this is the ethic all traders and investors should strive for, and in my view it cannot be emphasized enough. Avoid the sensationalism of the news, of cable financial TV, of the pundits and commentators, because the market will always tell you all you need to know. Many investors concern themselves with "positioning" ahead of major news announcements such as the monthly employment report of the Bureau of Labor Statistics. In my view, there is no need to "position" one's portfolio for a news event as all the market evidence up to that point should already have you positioned on the basis of what the market is actually doing, not what you think it might do based on any number of news event scenarios that have not occurred yet. On its face, this is a silly way to invest, but it is exactly what I was doing in March 2009, and as we have seen it was caused by a confluence of malodorous factors. As traders, we must always remain objective and focused on what the market is telling us in real time, and the best way to do this is to check yourself by constantly stepping outside of your head and questioning the motives of any trade. Justify the trade in your head according to the rules of your methodology and system, not according to scenarios you think might happen or how you are currently feeling, whether that is characterized by fear or elation. Make every trade measure up to the criteria that your investment methodology dictates, and if it does not, nix the trade! By focusing on the criteria of the trade and the market's action, you will also trade with less stress, which is caused by trading in a manner that tries to anticipate rather than flow with the market and individual stocks.
For the record, I should mention that my March debacle in 2009 occurred in only one of the two funds I was managing at the time, and the second, less aggressive fund was left unscathed by the mistakes I made, which were for the most part isolated in the first, far more aggressively managed fund. Both funds were up in 2008, a year when the market was down big, so it was not as if there was any hint of what was to come by year-end 2008 or a pattern of continuous bumbling. During my career I have had several periods where I have drawn down close to 50 percent in aggressively managed portfolios, but such drawdowns have, based on my long-term track record, always been made up over time, sometimes quickly, sometimes not so quickly.
4.2.4. When Base Breakouts Fail During a Bull Market: Birth of the Pocket Pivot: Chris Kacher
The first decade of the new millennium, 2000–2009, has created a whole host of new challenges for traders and investors. While the major market averages in the United States enjoyed steep uptrends and downtrends throughout the 1980s and 1990s, they changed their character after 2003. From January 2004 to mid-2006, the U.S. market tended to move in a lackluster, sideways-to-slightly-upwardly grinding, sloppy market where most textbook, technical breakouts in individual stocks failed. Figure 4.18 shows the grinding nature of this reluctant bull.
Figure 4.18. S&P 500 weekly chart. Nearly three years of difficulty.: Chart courtesy of eSignal, Copyright 2010
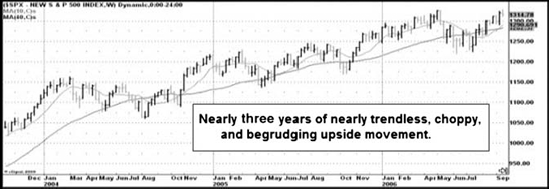
Figure 4.19. NASDAQ Composite 1991–2002 monthly chart. Throughout most of the 1990s the market moved in a steady, parabolic uptrend.: Chart courtesy of eSignal, Copyright 2010

In such an environment it was often difficult to gain an edge, so in mid-2005, I explored other possible trading avenues. My research led me to some useful conclusions, and the pocket pivot point concept was born, which we discuss in greater detail in Chapter 5. That said, even after 14 years of trading success based upon capitalizing on upside moves in the market while sidestepping every significant market downturn since 1992, including the mother of all NASDAQ bear markets from 2000 to 2002 (see Figure 4.19), I began to think on some subconscious level that the markets will always trend, either up or down.
I did not stop to think that the major U.S. market indices could behave in a prolonged, sloppy, reluctant sideways move that would persist for years, so this grinding market action caught me by surprise. That said, certain developing, emerging markets like China and India, as well as commodities in general, were leading, and their bull market was much stronger than the general U.S. market averages. However, outside these specific groups, the environment was considerably challenging. I came to understand that the tone of the markets had changed into something I had not experienced in the 14 years I had traded. It is essential during such challenging periods that traders keep a clear head and not let their emotions control their actions, so they will find the best solution.
My pocket pivot buy point discovery in mid-2005 helped to turn my 2005 performance around so that I was able to turn it into a winning year. Armed with the pocket pivot, in 2006 I was able to achieve triple-digit returns in excess of 100 percent. However, 2007 brought new challenges. Price/volume action in the major market indices misled me through much of 2007, an extremely rare situation. This resulted in a negative return for my market timing model that year, the only other year in 35 years that it had a negative return. During 2007 my timing model produced numerous false signals, as can be seen in Figure 4.20. As it turned out, the fact that the model was generating so many false signals was a big clue that 2007 was indeed a highly unusual year.
While 2007 was the only other year besides 1993 where I logged a negative return for my timing model in its 35-year run, the unusual behavior of the model was helpful in shining a light down these dark and treacherous trading corridors. Numerous distribution days naturally led to sell signals issued by my timing model. However, these sell signals led not to a falling market but to a market that stubbornly continued to grind higher, and was the first time this had persisted for as long as it did looking back over many decades of price/volume market action. But by capitalizing on the window of opportunity that presented itself in late 2007, and by making full use of pocket pivot points, I was able to reverse my draw downs that had occurred in my own trading account up until August 2007 and finish the year up +30.6 percent despite my timing model being down for the year.
Figure 4.20. NASDAQ Composite daily chart May–November 2007. Timing model signals are shown, many of which were false in 2007.: Chart courtesy of eSignal, Copyright 2010

4.2.5. Overtrading: Chris Kacher
Since I always let the stocks have the final say on exactly what degree of market exposure I will take in any environment, I ended up with solid returns for 2007 by buying the fundamentally strongest stocks at proper pivot points and staying heavily invested through September and October of 2007 as the brief window of opportunity was clearly open during those months. Had I invested only during such periods, when the window was clearly open as measured by a buy signal from my timing model together with a confluence of strong, fundamentally sound stocks hitting proper buy points more so than at any other time that year, I would have limited my market exposure and kept more of my profits.
One might ask how to tell when the window is truly open versus only being partially open. The general answer is experience. Traders develop a feel for the market by running their screens each day. Over a period of many months, one will develop sensitivity as to when enough good stocks are starting to hit their pivot points, whether a pocket pivot or a breakout pivot. For example, in August 2006, the general averages turned a corner, and began heading back up. By late August 2006, many stocks with strong fundamentals began to hit my buy screens. Constructive pocket pivot points started showing up all over the place for the first time since October 2005. I began buying the best ones and found myself on full margin within just a few days. The other times when this occurred, launching the beginning of a bull run, were as follows, with the length of window of opportunity in parenthesis: April 2003 (6 months), October 2004 (3 months), October 2005 (2 months), August 2006 (3 months), September 2007 (2 months), and March 2008 (1 month), as shown in Figure 4.21.
From 2005 onward, I found myself well into margin rather quickly during each of these windows of opportunity and thus was able to more fully capitalize on the bull run, which typically lasted three months or less, a short period compared to the 1980s or 1990s, and is one big reason why this decade has been far more challenging. I believe overtrading is one of the toughest challenges for any trader, whether a novice or a deeply experienced professional. It is often far too tempting to let one's prior successes in the market cloud one's judgment. Being trigger happy in the markets when they are only acting half-right can create losses, especially in the difficult decade of the 2000s.
Figure 4.21. NASDAQ Composite Index weekly chart, 2003–2008.: Chart courtesy of eSignal, Copyright 2010
