9.2. 1999–2000
Observant readers will notice that the chart of Qualcomm (QCOM) in 1999 which is shown at the beginning of the previous chapter (Figure 8.1) is also similar to the examples of Peoplesoft and Charles Schwab in Figures 9.10 and 9.11. Amazon.com (AMZN) in 2009 also had a similar Rule of Three type of set-up, as Figure 9.12 shows. Two prior breakouts within a "macro-base" that is actually trending upwards very slightly both fail before the third breakout from a cup-with-handle base works. Again, the crowd is conditioned to believe the stock will not succeed on the breakout by the third time, and the crowd, as is often the case at turning points, is fooled. Once AMZN cleared the top of the cup-with-handle base it formed in late September 2009 it never violated its 10-week (50-day) moving average before launching up through the 100 price level into all-time price ground.
In any case, the precedent of Peoplesoft in 1994 was helpful in discerning these jagged bases, and stocks like America Online (AOL) and Charles Schwab (SCHW) were rocketing higher. On March 16, 1999, we put out a price target on Schwab based on some similar historical examples as well as some simple price target analysis based on earnings growth, forward earnings estimates and any potential P/E expansions in Schwab. At the time Schwab was trading at a split-adjusted $90 a share, and O'Neil was looking for a $140 price target on the upside. Most of the institutional sales force was incredulous, thinking that Schwab had "come too far too fast." Again, the misperception of overwhelming upside strength as a reason to be negative on a stock because it is just "too high" is seen at work here. In about four month's time, Schwab had gone from a split-adjusted $28 a share to nearly $90, and it wasn't finished yet. O'Neil was using an historical precedent in establishing his price target for Schwab. He had noticed that Quotron Systems, a hot stock back in 1979, had come out of a similar base as Schwab's, and the magnitude of its move indicated that Schwab could go to 140. As it turned out, Schwab eventually topped out at 155, a little higher than O'Neil's 140 price target.
Figure 9.12. Amazon.com (AMZN) weekly chart, 2009. The Rule of Three is at work again in AMZN's September 2009 breakout.: Chart courtesy of eSignal, Copyright 2010

9.2.1. The Use of Historical Precedence
Using historical precedence when trying to figure out possible price targets for stocks he owned was one technique O'Neil employed when trying to figure out just how far a big, winning stock that he owned could go. O'Neil believes that the chart patterns are essentially maps of psychology, and that chart patterns will remain useful as long as human psychology remains the same. For this reason, he felt that if a stock he owned today exhibited very similar chart characteristics to a big, winning stock from the past, then using the stock from the past as a "historical precedent" in order to guide his handling of a stock in the present was valid. In the case of Schwab and its similarities to Quotron Systems of 1979, it turned out to be quite valid.
O'Neil understood that it is the big institutional investors that run the market, and since big fund managers all think the same, then the chart patterns of the stocks they traffic in generally will show their psychology at work. O'Neil looked for institutional support, and in his observations he found that stocks which have upside price runs and then consolidate, forming a base structure of one sort or another, usually need five weeks of pulling back in order to digest their gains as some institutional investors finish accumulating their positions and others sell part of their positions after the stock has run up because it has either become "overvalued" within their framework of how they look at stocks and also because they will trim a position that goes up too far, too fast and hence becomes a larger-than-normal percentage of their portfolio. For example, if fund manager A can only have 2 percent maximum position sizes in his fund, and he buys 2 percent of stock XYZ which then doubles, becoming more like 4 percent of the portfolio, he may have to cut that position back to 2 percent if it becomes too heavy of a weighting in his portfolio. As this process occurs, and the stock consolidates, other institutions who like the stock will accumulate on pullbacks. One interesting rule that O'Neil had was that after a stock has consolidated and built a base of at least five weeks, then usually the stock can be bought on pullbacks that are near to or undercut the prior low of the base in the sixth week or later. In many cases after a stock has based for at least five weeks the 50-day, or 10-week, moving average has a chance to catch up to the stock, at which point it serves as critical support.
By the end of April 1999, O'Neil was beginning to have his doubts about the market, which was in a choppy uptrend and running into some trouble as the Dow was trying to clear the 11,000 level. Distribution in the form of higher-volume down days as the Dow approached the 11,000 mark looked suspicious to O'Neil, particularly when he combined this with the action in leading stocks. As we quote him in our trading diaries, "One of the problems is that most, if not nearly all of the big leaders have undergone serious distribution and liquidation. Even the retailers, which are considered a steady, stable sector, are getting hit." Pointing out the current weekly chart of Home Depot (HD) shown in Figure 9.13, O'Neil gave a quick assessment of what was wrong with the stock. "It broke out at 20 in early 1998 and ran up to the 50 area, then built a big, loose base in the summer/fall of 1998, broke out again in October, then had a smaller run up to 60, and then built a base around 55–60. There are only two down weeks in that base on the left side which is characteristic of an improper base. You need to see four to five down weeks on the left side which allows the psychology to set up correctly by shaking out ALL the weak holders before it moves up. The three weeks before it broke out were all wedging up slightly."
Figure 9.13. Home Depot (HD) weekly chart, 1998–1999.: Chart courtesy of eSignal, Copyright 2010

Authors' Note: O'Neil is a natural teacher with a natural feel for developing talent in this manner, and these short "market school" sessions where he would call us to talk about a real-time example in the market that illustrated a lot of the concepts he teaches in his books and workshops were always a privilege and a treat given that we were receiving "one-on-one" real-time instruction from one of the stock market's greatest mentors.
This concept is very important in order to understand a proper base formation. O'Neil was concerned that breakouts from improper bases were failing, as in the case of Home Depot, and this was a bad sign for the market. Note the Three Waves Down type of structure similar to the example of TJX Companies (TJX) in Figure 9.7. The critical point here is that the base Home Depot formed in early 1999 only came down two weeks before it started drifting back upward again. As it tried to break out in late February, it was not pulling back but was instead wedging along the lows for three weeks as it drifted higher on light trading volume. Normally, a stock should pull back a little as volume dries up before launching out of a base. Because Home Depot's base was faulty, by late April 1999 it was starting to roll over.
9.2.2. 1999—A Challenging Year!?!
Throughout much of 1999 the market's trend was a slow, choppy, and grinding upside affair that would break out to new highs and then pull back in again, which it did several times in succession. All the while there were reasons to become bearish, and reasons to become bullish. Throughout all the "chop and slop" there were some stocks that continued to go about the business of breaking out of sound bases, moving up, building another base, breaking out, and moving up again. Most of these were stocks that were simply stair-stepping their way higher as they slowly built up for the parabolic move that was coming at the end of 1999, but which nobody saw coming in late spring.
On May 20 O'Neil called to discuss two of these new leaders, Broadcom (BRCM) and Qlogic (QLGC), and to go over how to set price targets for Broadcom. O'Neil frequently discusses how to use price-to-earnings ratios and their associated expansions during a stock's uptrend to come up with price targets, but there are actually three different methods that can be used. We've already seen how O'Neil used the example of Quotron Systems in 1979 as a historical precedent to set an upside price target for Charles Schwab Corp. (SCHW), which had a similar chart pattern. This is the second type of method he employs to determine price targets, and there is a third, even simpler method, which O'Neil describes as follows as we observe the chart of Broadcom in Figure 9.14 (note that the chart is not split-adjusted, so prices mentioned in the following diary entry are three times the prices shown in the charts, which we put in parentheses): "If you have a big position in Broadcom and have pyramided properly, now you have to figure out where the stock could go to. This is the more difficult half of capitalizing on a big winner—buying the stock is easy. The process can go one of two ways. First, look at the prior base which was formed from July through September 1998. The stock broke out at 40 (13.33) and ran up to 90 (30), a 125 percent run. The stock's most recent breakout is now at 77 (25.67) coming out of the base formed between January and April 1999. Figuring it could make a similar move as the move from 40 (13.33) to 90 (30) would take the stock somewhere to 173 (57.66). Also note the number of weeks of the move from 40 (13.33) to 90 (30) was 11 weeks. So you would figure the next move from 77 (25.67) should go about the same duration. If you hit your price target of 57.60 within five weeks, you would not sell as this indicates a lot of power, and a big leader will not run up and poop out after five or seven weeks. Your durations should be comparable. This also assumes that BRCM is in fact a big, institutional leader and not a thin, wild thing that could go up five weeks and blow up. Some thin, wild things can do exactly that—but a big institutional, heavy-trading leader will not."
Figure 9.14. Broadcom Corp. (BRCM) weekly chart, 1998–1999. Measuring the first up leg in BRCM's chart pattern to estimate the extent of subsequent upside price moves.: Chart courtesy of eSignal, Copyright 2010

O'Neil also reiterated the use of a similar historical precedent to generate price targets. At O'Neil we had "model books" of all the big, leading stocks that were huge winners in prior historical cycles going all the way back to the 1880s, and these were very helpful in finding historical precedents that could be used in assessing stocks we were handling in real time. O'Neil describes this process as follows, "A third way to gauge the potential move is to look for a similar leader in the model books. If BRCM has gone up 33 percent in the first five weeks since breaking out at 77 (25.67) look for another big leader in the model books that also moved up 33 percent in the first five weeks. Don't pick a second-tier leader—look for a big leader that is similar in its base structure and how it acts right out of the chute. Maybe there are some similar industry characteristics but this is not necessarily a key thing."
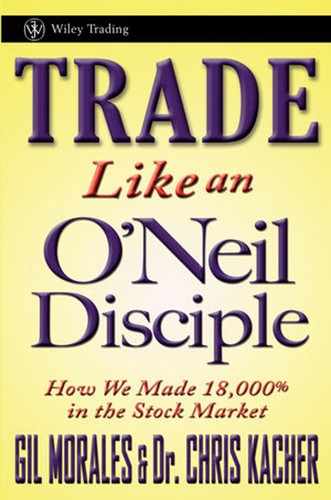
By June 6th O'Neil was starting to look for a bear market to develop, as he believed the market was topping. He ran through the process he believed was unfolding: "Note that the market topped in late April when Schwab and AOL topped. At that point the Dow started running up due to buying in cyclicals. The market will top in a couple of ways: First, distribution occurring on the Dow sucks in shorts who are then run in and the market moves to new highs and then rolls over, making a final top. The second is as you get distribution in the big leaders one other index keeps going up which fakes everyone out. This divergence camouflages the real top in the market." Despite the bearish evidence in the market, the indexes soon stabilized in mid-June before turning and making a run for new highs, as Figure 9.15 shows.
In Chapter 1 we discussed the difficult period that most of 1999 represented, despite being considered a "bubble" market as it went parabolic at the end of the year. But there were plenty of cross-currents that could throw you off. We remember buying a pretty large position in WorldCom, Inc. which gained infamy during the bear market when the company went bankrupt and its CEO, Bernie Ebbers, was sent to prison. This all occurred right around the bear market bottom in 2002, but the hints of trouble brewing for WorldCom were evident even in June of 1999. We noticed that as we were buying WorldCom the stock was actually moving lower (Figure 9.16), something that O'Neil insisted should never happen to any stock while you are buying a large position in it. Buying more than just a few thousand shares of any stock should never be easy, but somebody was pelting our order with stock they wanted to sell, and the stock kept going down in earnest. About half-an-hour later we called our trading desk to dump the stock, which was down about half-a-point from where we had bought the shares, and exited the position in its entirety. O'Neil later called up to ask, "What's up with WorldCom?" We told him of the experience we had trying to buy a good-sized position in the stock and that it kept coming down as we were executing the order. Perhaps, we speculated, WorldCom was simply under pressure because of news that the Federal Trust Commission was investigating undersea cable operators, of which WorldCom was one at the time. O'Neil pointed out that he had noticed that whenever WorldCom tried to break out of its base, a seller would show up and hammer the stock. O'Neil wanted no part of it as he surmised, "Maybe Janus or someone big is dumping their stock. What I want to know is, 'Why?'"
Figure 9.15. NASDAQ Composite Index daily chart, 1999—a top that wasn't.: Chart courtesy of eSignal, Copyright 2010
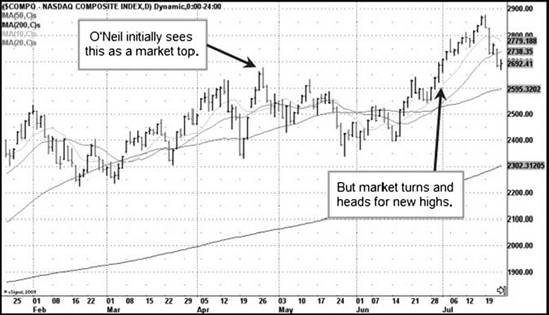
Figure 9.16. WorldCom, Inc. (WCOEQ) weekly chart, 1998–1999. The "line of stiff resistance" overcomes WorldCom.: Chart courtesy of eSignal, Copyright 2010

By 2002, we had our answer, but the price/volume action of the stock was telling you that something was very wrong well in advance. In this case we were lucky, since using O'Neil's "50,000 share rule," whereby any stock you are buying 50,000 shares of or more should be difficult to buy, got us out of WorldCom immediately. This was typical of O'Neil's understanding of the "line of least resistance." In WorldCom's case, the different points at which it tried to break out to new highs in 1999 were not lines of least resistance, but rather lines of very stiff resistance!
9.2.3. "Watch Out, It's Billy O.!"
Most investors who follow O'Neil know of the "ascending base," but most do not know that there are a number of corollaries to the ascending base, which is a jagged sort of formation where the stock has three sharp pullbacks in an overall ascending formation of 9 to 18 weeks long with each pullback ending just above the low of the previous pullback, such as Home Depot, which formed an ascending base in the second quarter of 1998 (Figure 9.17). We recall going down to the floor of the New York Stock Exchange when O'Neil was playing Home Depot very heavily. At the time, O'Neil owned one seat on the floor and leased the other. O'Neil once grumbled that he hired some consultants to review his business, and they advised selling one of the seats and leasing one instead. This turned out to be a big mistake, as the value of the seat went up quite a bit after that, leading to O'Neil's subsequent distrust of "consultants" of any kind.
Running around the floor of the exchange with Lou Sulsenti, O'Neil floor broker at the time, was always an interesting and educational experience. In this case, we recall Lou telling the story of getting a "G" order to execute in Home Depot, which means an order that a member firm is making on its own behalf, so when he went up to the post Louie yells out, "50,000 HD to buy, G!" The Home Depot specialist, in testimony to O'Neil's recognized prowess on the floor, rolls his eyes, "Back again? Don't tell me this thing is going higher again?!?" Short-sellers in Home Depot who were in the crowd see O'Neil's "G" orders coming in to buy the stock, prompting them to warn each other, "Watch out, [it's] Billy O.! Watch out [it's] Billy O.!" Such was O'Neil's reputation on the floor, and it was not limited to his trading ability, but also his gestures as a human being. Way back when, a floor broker for O'Neil, whom we knew as "Bob," was working on the roof of his house one weekend and fell off, injuring himself severely and becoming paralyzed from the waist down. O'Neil brought the floor broker back to California and gave him a job at the home office in Los Angeles, making sure that he was well taken care of. Every time we went on the floor, certain floor brokers on the exchange would ask, "How's Bob?" The NYSE members and floor brokers were like a big family, and they recognized that O'Neil had taken care of one of their own. For this O'Neil was afforded great respect, perhaps even more than for his trading prowess, on the NYSE floor.
Figure 9.17. Home Depot (HD) weekly chart, 1998. HD forms an ascending base before pushing sharply higher in mid-1998.: Chart courtesy of eSignal, Copyright 2010

O'Neil's buying spree in Home Depot came as a result of the breakout from the ascending base in Figure 9.17 as this is a very powerful pattern to buy off of, and O'Neil knew what he was looking at. Certainly the upside action of the stock after O'Neil started buying Home Depot stock with his "G" orders on the NYSE floor was enough to impress the specialist, who probably didn't want to have to act as a seller of last resort in the face of O'Neil's relentless buying of the stock. In such case, the specialist was more likely to turn and start buying the stock for his own firm's account.
9.2.4. A Boring Base Is Not so Boring
Another "little pattern" that O'Neil discussed is one that is somewhat similar to an ascending base but simply looks like three little bases all on top of each other instead of the more "jagged" look of the ascending base seen in Home Depot. Overall the stock appears to be making little net progress as it "breaks out and moves up a little bit, forms another little base, breaks out again and moves up a little again, and forms another little base." This is one of those patterns that lull you into thinking the stock isn't able to make any real upside progress. As O'Neil put it, "The pattern fakes you out into thinking that the stock is boring and won't go anywhere—but then it moves out and takes off. Watch for it." In late 1999, Ariba, Inc. (ARBA), part of the "dot-com sub-craze" in emerging business to business or "B2B" e-commerce plays, was showing this type of formation as it set up in three little "stair-step" style bases, each three to four weeks in length so that they are not of sufficient duration to meet the definition of a "flat base" which must be five weeks or more in length (Figure 9.18). From August to November 1999 Ariba slowly wended its way higher, launching on a three-fold price move that carried into March 2000.
Figure 9.18. Ariba, Inc. (ARBA) weekly chart, 1999–2000. Three little bases form a dull-looking stair-step formation, which then launches higher.: Chart courtesy of eSignal, Copyright 2010

The essential force behind any of these patterns is that they indicate a stock that is "coiling" as it prepares to spring to the upside. Often, such patterns, unless you understand them and know how to look for them, can lull you into thinking that the stock can't get any kind of consistent upside movement going. In particular, if you buy a stock, say, in the first little base of a three-base stair-step type of formation, it is very likely that the stock's lack of decisive upside action will wear you out so that you sell the stock, perhaps taking a small profit, and then forget about it, missing the huge price move when it begins. Recognizing when the "line of least resistance" has been broken, however, and the stock is free to romp higher, is critical in understanding these types of patterns. In the same manner that the ascending base has three pullbacks in the formation, the "stair-step" formation has three little bases, which do not pull back down into the prior range. The basic idea is that what looks "dull" may actually be coiling up, and one should pay close attention to these types of patterns when they occur.
Before the advent of online services like William O'Neil Direct Access (WONDA), one of the best-selling and most popular institutional products offered by the firm to its institutional clients was the Data Monitor. This was a custom chart book created for each client's portfolio, containing a weekly O'Neil Data Graph®, with the option for a daily chart to be shown on the left-facing page (at additional cost, of course), for each position owned by a particular client in their respective portfolios. In this manner institutional portfolio managers had the ability to quickly reference, review, and monitor each of their portfolio holdings at a glance. Data Monitor contained an "alerts matrix" in the front of the chart book, which alerted the portfolio manager to any negative or positive changes in the stock's fundamental or technical data points. Earlier in 1999 we had noticed that Waste Management Industries (WMI) was triggering several such negative alerts, and normally this would cause us to advise a client who might have owned the stock to consider selling WMI, or at least reviewing the position carefully. Those who may not have acted on the negative alerts, unfortunately, reaped the consequences of their decision to hold the stock, as Figure 9.19 shows.
9.2.5. Listening to the Market
O'Neil always views the market as a feedback system, whereby the market is either confirming or disconfirming your decisions in real time. If you make the decision to buy a stock and the stock goes higher, the market's feedback mechanism was confirming the correctness of the decision. O'Neil's great strength is in totally accepting the market as a feedback mechanism, and abiding by the evidence the market offers in real time, even if it contradicts his earlier views. An example of this is seen in Best Buy (BBY) in Figure 9.20, which we were fairly bullish on as it broke out of a seven-week base, paused for one week, and then continued higher over the next four weeks. BBY began to falter, however, and as the market began to mistreat him, O'Neil became suspicious of the overall environment.
Figure 9.19. Waste Management (WM) weekly chart, 1999. WM splits wide open after weak sales growth flashed an early sell signal.: Chart courtesy of eSignal, Copyright 2010

Figure 9.20. Best Buy (BBY) weekly chart, 1998–1999. Best Buy moves to new highs but quickly begins to falter as the general market begins to weaken.: Chart courtesy of eSignal, Copyright 2010

Figure 9.21. Dow Jones Industrials daily chart, 1999. A powerful follow-through day on October 28, 1999 leads O'Neil to buy, and buy big.: Chart courtesy of eSignal, Copyright 2010

On September 24, O'Neil was fairly certain that "the market's back has been broken." He summed it up tersely, "I think it's through." Indeed, the market looked quite weak (Figure 9.21) as the Fed began to raise interest rates, and enough feedback was provided by both leading stocks and the general market to validate this view. However, O'Neil recognizes at all times that market conditions can change very rapidly, and this is why he never, ever assumed a rigid position, no matter how certain he was about the state of the market at any given time. This is a critical lesson for investors of all stripes. In the market there are no constants, and changes in the market environment, some more rapid than others, are part and parcel of the game. Modern civil engineers understand that large structures which are subject to the more intense forces of nature, such as hurricane-force winds or earthquakes, must have certain features built into the design that allow the structure to sway, move, and bend with these forces, which decreases the chance that they will be toppled instead. In the same way, investors who cling to rigid opinions, and thereby resist the forces of the market as they shift and change, risk being snapped in half like a brittle little twig.
The market continued to plumb new lows going into mid-October, and there was still no concrete evidence that the market decline was ending, until it finally undercut the September lows and began to rally, posting a massive follow-through day on the ninth day off the bottom (Figure 9.21). Reacting to new evidence, O'Neil was no less than decisive as he adamantly declared, "The market is telling us to buy and buy big!" There were plenty of stocks to buy, and the ensuing price runs in many of these stocks made us a fortune.
On the way up, however, given the sharpness and steepness of the rally, some leading stocks would exhibit a great deal of volatility as they ran up sharply, pulled back sharply for a few days, and then turned and charged to new price highs. During one of our "market school" sessions, Bill talked about handling volatility in a high-flying stock, using the example of Immunex (IMNX) as he advised, "It is wise to go back and map out all the pullbacks the stock had during a rally phase. Check the percentage decline off the top and the number of days over which the decline occurs. This gives you some idea of where the stock can trade within a normal uptrend and will keep you in when it corrects sharply." This basic idea kept us in some of the volatile leaders we were playing, and IMNX's weekly chart (Figure 9.22) shows the typical one-week pullbacks that the stock put in as it moved higher. Once the duration of the stock's pullback in early March 2000 exceeded those seen on the way up from December through February, it was clear that at the very least the uptrend was starting to run out of gas, and at the very least would have to build a new base and set up again if it had any chance of pushing into new high price ground again.
Figure 9.22. Immunex (IMNX) weekly chart, 1999–2000.: Chart courtesy of eSignal, Copyright 2010

9.2.6. "You Screwed Up!"
In February of 2000 it was time for Bill O'Neil to pass out the "commission checks" for all the internal portfolio managers who had made money that year. As is standard at most proprietary trading outfits, the portfolio managers were paid a percentage of the gross profits they made in their internal account. You might think that clocking performance numbers in the low 500 percent range in 1999, as we both did, would merit some heavy praise from O'Neil, but far from it. He brought in your check and handed it to you, and then started flipping through what we used to call the famous O'Neil Personal Data Assistant, which was essentially a very fat legal pad on which he wrote endless notes, folding back the pages that already had notes scribbled in every available square millimeter of their cellulose surface.
O'Neil kept track of his portfolio managers, particularly their mistakes, and these often found their way onto his non-electronic, legal pad PDA. O'Neil respected those who could perform well in the market, and you only gained credibility with him as a portfolio manager if you could keep up with the group and its high performance standards. He was always happy if you were making big money for the firm, but he just didn't gush over it, or waste time allowing you to bask in the warm afterglow of a very profitable trading year. He preferred to go over mistakes, which is what he would do as he flipped through 30 pages of his legal pad and found the exact page where he had his notes on your trading mistakes. After reviewing critical mistakes you made, despite being up over 500 percent on the year, he quickly concluded, "You screwed up. If you had done everything exactly right you could have been up 1,000 percent."
9.2.7. The Bursting of the Bubble
As we moved into the end of February 2000, the market was becoming even frothier as many leading stocks burst into climax runs. As well, money poured into ever more speculative stocks, in particular the mass dot-com bubble IPOs with no sales, no earnings, and no real business plan that related to generating either. The climactic action in leaders combined with this increased "speculative flavor" to the market was to O'Neil a clear sign of danger lurking in the shadows. This was not necessarily a sign to hurl your stocks at the nearest seller and run for the hills, but to be on a Code Red alert ready to instantly react to the confirming action of a technical top in the market. Obviously, sentiment had become frothily bullish, but this was merely one lesser, but still key, piece of the puzzle, and in and of itself was not sufficient to call a top. When the associated technical evidence began showing up as climax runs turned into climax tops and heavy distribution began to beset the market, it simply added conviction to the conclusion that it was time to begin exiting the market in earnest.
After the top on March 17th, O'Neil wisely counseled us to stay out of the market for at least three months. O'Neil told us, "Watch stocks that were big winners—they will break once and then try to rally sharply and then they break again, at which point you can put a fork in 'em." O'Neil recalled that in prior market cycles "you might have two or three 'story stocks' going nuts, but to see 200 to 300 like you have the past several months means we've seen a tulip craze or 'bubble,' if you want to call it that. The magnitude of this tulip craze indicates that it needs time to work out of the system."
The steepness of the market's decline caused O'Neil to begin seeing some similarities to the bear market of 1962, which finally culminated in a climactic low during the Cuban Missile Crisis of October 1962. As we all flew to New York in early June of 2000 to present at the Investor's Business Daily workshop to be held at the Hyatt Regency Central Station on Saturday the 3rd, we did not realize just how eventful this trip would be.
9.2.8. Overpaid Analysts
We were both tagged to participate in the workshop by making a presentation on the Daily Graphs investment tool after lunch, so along with our faithful assistant Mike Webster, one of the newest internal portfolio managers at O'Neil at the time, the three of us landed in New York that Wednesday night. Holing up at the Peninsula Hotel on Fifth Avenue we began preparations for the weekend event as well as the next day's full slate of appointments we had scheduled with several O'Neil institutional clients with offices in the city. On Thursday, June 1st, we went in to see one client firm which had just hired a hot-shot "million-dollar" Internet analyst who allegedly "knew everything" about the Internet "space." Hiring a high-priced Internet analyst after the dot-com bubble market had topped didn't seem too smart to us, but we went into the meeting with the best of intentions.
This particular client firm gave us a very gracious reception when we showed up at their offices on Park Avenue. After a bit of bantering about the current state of the market, we were all ushered into their conference room to begin a meeting during which we were to review their current portfolio holdings. The three of us, along with several staff, including the "million-dollar" Internet analyst, began viewing WONDA charts that were being projected up onto a screen on the wall at the end of the long conference table. Mike Webster sat in the back, since he could only act as an observer, and as we went through the stocks, an almost surreal, yet comical repartee began to take form as Mike kept instinctively reacting to each new chart that he saw by softly saying to himself the same phrase, over and over again: "That's a top. That's a top. That's a top." While he was actually saying this quietly to himself, the room was quiet enough so that everyone could hear him, and each time he uttered this simple but accurate phrase the million-dollar Internet analyst harrumphed and laughed quietly at the "naïve" upstart calling tops in his beloved Internet holdings. Among the stocks that they owned was Infospace (INSP), shown on a weekly chart in Figure 9.23. We advised them to sell the position, but their analyst began a long-winded discourse on why INSP was "undervalued."
Figure 9.23. Infospace (INSP) weekly chart, 2000. The top is in.: Chart courtesy of eSignal, Copyright 2010

At the time, Mike Webster was a rookie portfolio manager at O'Neil, and the spectacle of him outanalyzing a hot-shot "million-dollar" analyst without even trying was something that was truly, as the famous credit card commercial puts it, "priceless." We should note that while the analyst was both arrogant and ignorant, the CEO of the client firm was himself extremely gracious and grateful for the meeting. At one point we had told this client that we expected the NASDAQ Composite Index to push below 2500 at its nadir. In 2001, when it finally did, the CEO sent our entire institutional services department a case of very fine Dom Perignon, congratulating us for accurately making what he had originally thought to be an "unbelievable" prediction.
9.2.9. Avoiding the Nokia Trade
Friday morning, June 2nd, we found ourselves at breakfast in the Luncheon Club of the New York Stock Exchange, where our firm of William O'Neil + Company, Inc. was a member. We met up with O'Neil NYSE floor broker Lou Sulsenti when we first arrived at the exchange and headed upstairs to eat, where we were joined shortly thereafter by Steve Porpora, the second floor broker whom many readers may recognize as a former NYSE floor commentator on CNBC throughout a good part of the 2000s until O'Neil shut down his floor operations in 2008.
At 8:30 a.m., just as we were settling in and enjoying our blintzes, omelets, and Canadian bacon, the monthly jobs number hit the newswires: 131,855 jobs had been added in May when many feared that the brutal market top and bubble-bursting in March might have severe economic consequences. Employment tends to lag market turns, but the futures were reacting big to the upside. The room began to clear out very quickly as most of the floor brokers in the room headed downstairs. An avalanche of buy orders was expected at the opening, so Steve Porpora, who functioned as Director of Floor Operations for O'Neil headed downstairs while we finished up with breakfast. It was somewhat surreal to be sitting in an almost empty room that just a few minutes before had been filled with a multitude of floor brokers devouring their healthy start to the day. A lot of very fine breakfast fare was left uneaten on those NYSE Luncheon Club tables that morning. In some cases, you had to admire the dedication of the NYSE members as duty took precedence over sustenance. When you run all over a floor the size of perhaps half a football field, racing from post to post throughout the day, all those carbs come in very handy. On the other hand, we don't recall ever seeing a skinny NYSE floor broker.
Either way, once we had finished eating, it was down the elevator to the floor, but not before stopping in the men's room to snare a "souvenir" comb. Trays of black combs with New York Stock Exchange stamped on the side in gold letters could always be found in the Luncheon Club restroom, and it became a custom to take one each time we showed up at the exchange and stuffed our faces. We are not telling how many of these combs we have. Once we were on the floor, the excitement began to build. In those days, before traders began letting electrons run their orders around for execution, nothing would get the floor in a good mood faster than a busy morning, because when the floor brokers are busy executing orders that means they are making commissions, while the specialists are ringing the cash register as they work the spreads, providing supply and taking stock for their own account as supply and demand shifted throughout the day.
Once the bell rang, what had been a steady, low-volume drone rose sharply to a roar as the flood of orders hitting the floor translated into a flood of sound. Standing in the O'Neil floor booth, we decided to check out Nokia (NOK). Using the phone in the booth, we called the trading desk at O'Neil's home offices, yelling to our trader over the phone, "Jack, buy 50,000 Nokia." We then handed the phone over to O'Neil floor broker Louie Sulsenti so that Jack Hodges, the O'Neil desk trader back in Los Angeles to whom we had just given the order, could in turn give the order to Louie. A bit circuitous, as one might wonder why we couldn't just tell Louie to buy the 50,000 NOK ourselves. After all, we were on the floor, in the O'Neil floor booth, standing right next to him. But those were the rules for giving an order, and we had to follow them. Order in hand, and correctly "routed," off to the NOK trading post we went (Figure 9.24).
Figure 9.24. Nokia (NOK) daily chart, 2000. Watching institutional distribution in action on the floor of the NYSE.: Chart courtesy of eSignal, Copyright 2010

As we approached the NOK post, a small group of three or four floor brokers was standing around with orders to buy, but they were all sitting on the bid side of the market waiting for the stock to come to them. Louie, a street-smart floor broker if there ever was one, noticed a guy standing off to the left, away from the crowd. As we said to Louie, "Let's go in and take stock," he waved us off, barking, "Wait a minute. See that guy over there? Watch him." The "guy" we were to watch was a floor broker from Donaldson Lufkin and Jenrette, or DLJ. Louie's instincts proved to be correct, as the DLJ guy suddenly leapt into the crowd and took the offer price for 50,000 shares. The other brokers in the crowd who had been lying back, waiting for a seller to show up, suddenly had to execute their orders or risk being left behind. When they all stepped up to buy stock at the offer price, the DLJ floor broker turned around and yelled out, "Sold, sold, sold!" pointing to each buyer in succession. Louie curtly ordered, "Let's get outta here." We did not argue and left NOK for someone else to buy. In this case, Louie saved us from making a dumb stock purchase. In hindsight, the pattern was never really right, but NOK had actually bucked the March market top in 2000 and remained only 3 percent off its all-time high. It was an interesting lesson in the truism that faulty chart patterns are often indications of institutional distribution, and in this case we witnessed such distribution in action, right on the NYSE floor, where the rubber meets the road. June 2, 2000, was a follow-through day for the market, signaling that it was now in a rally phase. O'Neil immediately grasped onto the bear market bottom of October 1962 as a precedent for the market bottom in June 2000. In his experience, the sustained velocity of the 1962 bear market decline was the only thing he had seen that was similar to the NASDAQ's decline off the March 2000 top. Because the NASDAQ Composite was also the index in which the dot-com bubble phenomenon was centered, it bounced the hardest off the late May lows (Figure 9.25). These lows had in turn undercut the April lows, constituting a shakeout that faked out short-sellers as the market turned and began to rally. Seven days after that May 24th bottom, the huge gap-up move on June 2nd constituted a clear follow-through day, given that it came on heavier trading volume than the prior day.
Despite the follow-through, there were very few stocks breaking out from proper bases and into new high price ground. Most of the movement was occurring in former leaders that had topped with the market in March 2000 and that were now bouncing sharply off lows. Groping around for something to buy on that June 2nd follow-through took us to Nokia (NOK), which we decided not to buy, but in the process we missed Corning, Inc. (GLW), a glassmaker that was spinning fiberoptic cable for the new high-speed Internet age. While we were getting lessons in institutional distribution at the NOK post, O'Neil zeroed in on GLW's clean breakout from a slightly "udder-like" cup-with-handle formation, seen in Figure 9.26.
Figure 9.25. NASDAQ Composite Index daily chart, 2000. After undercutting the April lows, the NASDAQ bottoms and then posts a follow-through day on June 2nd, 2000, signaling the start of a new rally phase.: Chart courtesy of eSignal, Copyright 2010
Figure 9.26. Corning, Inc. (GLW) weekly chart, 2000. One of the few stocks to break out with the June 2nd follow-through day.: Chart courtesy of eSignal, Copyright 2010

9.2.10. "Bill the Rock Star"
Saturday morning, on June 3rd, we woke up bright and early to get ready for the Advanced Investment Workshop. Arriving at the Hyatt Regency Central Station, we noted that a crowd was already starting to gather. Previous workshops had been a one-stage affair with perhaps 200–300 attendees at most, but this place was packed with what was later estimated to be around 800 attendees, the largest O'Neil investment workshop in history. In hindsight, it makes complete sense, considering the tulip craze of the market that had topped in March 2000. On that Saturday, the crowd was quite bubbly and excited about the previous day's follow-through, and there was tremendous electricity in the air. Steve Porpora, O'Neil's Director of NYSE Floor Operations, proclaimed, "Bill's a rock star!"
Because of the tremendous size of the audience, instead of the usual single-stage set-up we were used to dealing with, we had two stages stretching across the front of the room. Looking back on it all now, the mass ebullience in that room that day was clearly a sign that the bear market of 2000 was far from over. Leaving the hotel conference area that evening as we departed the workshop, attendees tried to follow us as some ran down the up escalator adjacent to the down escalator on which we were descending to continue asking us questions. As we tried to get into our cab, some attendees tried to get into our cab with us, but since we were headed off to dinner with O'Neil NYSE floor broker Lou Sulsenti, a street-smart, tough Italian boy from "Jersey," who was also in the cab with us, he played the role of bodyguard as he kept our would-be taxi-cab-mates at bay. All we could do was look at each other and say, "Major market top!"