
6.2. SHORT SALE SET-UPS
The key to successful short-selling lies in waiting for the proper window of opportunity to open. This requires waiting and watching as potential short-sale formations that begin to form complete their chart patterns. There are three primary short-selling set-ups that we use, the head & shoulders top, the late-stage-failed-base, and the punchbowl of death double-top. Each has its own unique characteristics, but sometimes patterns can overlap and can be therefore be interpreted as a "hybrid" of two or even all three of these formations, as we will see later in this chapter. Ultimately, the exact shape and label we assign to a particular topping formation is less important than the actual price/volume action within the pattern that indicates the stock is very likely under systematic and sustained distribution.
One feature that each of these topping formations and short-selling set-ups have in common is a sharp downside price break and breakdown on massive volume, which occurs right off the peak of a sharp upside price run of several months or more. Heavy volume selling off the top after a sustained uptrend usually signals the first wave of distribution in a former market leader, and it is at this point that such a stock should be placed on one's short-selling watch list as it potentially continues to form some sort of valid topping formation. Screening for stocks with heavy-volume price breaks on a daily and weekly basis is the most effective way to catch potential short-sale targets as they initially come under distribution. Keep in mind that in not all cases will a price break down off the peak in a former leader result in the stock building an overall topping formation. Leading stocks can and often do simply correct and build new chart bases from which they begin new price advances. It is possible to build elaborate screens that identify head & shoulders formations, but this is not necessary. Keeping a watch list of "broken" leaders that have had big-volume sell-offs off the peaks of big price runs in the immediately prior bull market phase is sufficient.
6.2.1. The Head & Shoulders Formation
The basic "mechanics" of a head & shoulders topping formation are best illustrated with the picture-perfect, textbook example of Crocs, Inc. (CROX) in 2007–2008 (Figure 6.3), one of the few true "poster children" of the head & shoulders topping formation. The prerequisite for any short-sale set-up and topping formation is a substantial prior price run, such as CROX's 13-month upside romp through late 2006 and most of 2007. In October of 2007 CROX was slammed off its absolute price peak on massive selling volume, as Figure 6.3 shows. The stock then bounced to form a single right shoulder that briefly rallied above the 40-week (200-day) moving average before breaking down again. Note that the right shoulder forms below the left shoulder in the head & shoulders formation, which is the optimal configuration as it indicates severe weakness in the stock. As well, the left shoulder can represent a stiff area of resistance if the right shoulder forms below it in the pattern.
Figure 6.3. Crocs, Inc. (CROX), weekly chart, 2000–2008—the modern "poster-child" example of the head & shoulders top formation.: Chart courtesy of eSignal, Copyright 2010
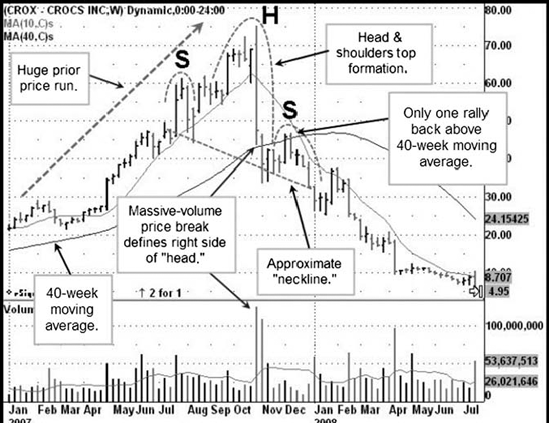
Once the head & shoulders formation has "filled out" it is possible to draw a "neckline" along the lows of the left shoulder, head, and right shoulder. In CROX's case, the neckline slopes downward, and hence is a "descending neckline." This is also an optimal configuration, as a down-sloping or descending neckline is much weaker than a neckline that is flat or upward-sloping (ascending). Initial downside breaches of the neckline can often result in "fakeouts" as the stock turns and rallies briefly. Note that when CROX finished forming its right shoulder it broke down through its neckline, but after spending three weeks below the neckline in January 2008 it turned and rallied back up into its 10-week (50-day) moving average before rolling over again and breaking down through the neckline for good. Because breaches of support within topping formations are often too obvious, and because they often occur as gap-downs on the daily charts, something that is not detectable on the weekly charts, we prefer to short stocks as they rally weakly into logical resistance or a moving average line, such as the 50-day or 200-day moving averages (Figure 6.4).
To get an idea of how these formations coincide with the general market, let's first look at another example of a head & shoulders topping formation, this time in Garmin, Ltd. (GRMN) that occurred at the exact same time. In GRMN's 2007 weekly chart (Figure 6.5), we can see the head & shoulders formation set up similar to CROX with the initial big upside price run, the end of which is signaled by the huge volume price break off the peak. GRMN was an interesting case because the left shoulder in the formation also had a sharp price break-off its peak in the 120 price area peak on very heavy volume, so that by the time GRMN broke off the peak of the head in the formation, evidence of the stock's weakness was beginning to stack up decisively. This distribution in the left shoulder and the head made GRMN a prime short-sale target as the market began to top in late 2007. Following the second price break off the peak, which finished forming the head in the formation, GRMN began to work on its right shoulder as it rallied back above its 10-week (50-day) moving average on declining volume. This is the point at which we want to watch the stock's rally for signs that it is running out of gas as it rallies on declining volume.
Figure 6.4. Crocs, Inc. (CROX) daily chart, 2007.: Chart courtesy of eSignal, Copyright 2010

Figure 6.5. Garmin, Inc. (GRMN) weekly chart, 2007–2008. GRMN sets up in a head & shoulders topping formation.: Chart courtesy of eSignal, Copyright 2010

Figure 6.6. Garmin, Inc. (GRMN) daily chart, 2007–2008. Very low volume as the peak of the right shoulder is the optimal short-sale point.: Chart courtesy of eSignal, Copyright 2010
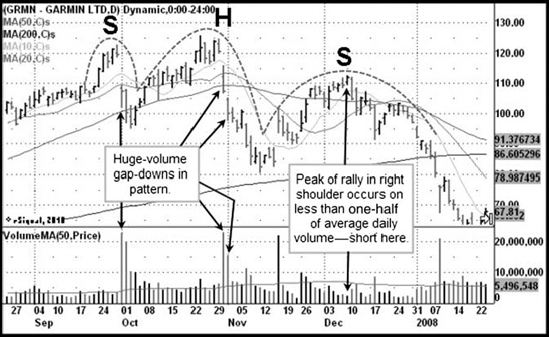
By examining the daily chart of GRMN (Figure 6.6) we can see the rally in mid-November 2007 that took the stock back above the 50-day (10-week on the weekly chart) moving average in early December. As GRMN reached what would become the peak of the right shoulder, daily trading volume declined precipitously as can be seen on the chart. Volume on the peak day was less than half of average daily volume for the stock, a strong sign of declining demand for the stock on the rally. In most cases, when volume on a rally within a right shoulder gets to −35 to −40 percent below average or lower, around one-third to one-half of average daily volume or less if you eyeball it on the chart. We call this a "volume dry-up" day, which can be shortened to the acronym "VDU," but we prefer to call it a "VooDoo" day. When it occurs, the odds of the stock giving way to the downside as it runs out of gas begin to increase, particularly if selling volume begins to increase sharply following the weak-volume up days in a rally/bounce. In most of the best examples, a very light-volume up day right around the peak of the right shoulder will mark the end of the rally as the stock will roll over to complete the right shoulder. Notice also that once GRMN starts to decline off the peak of the right shoulder it drops below its 50-day moving average but still manages to rally a couple of times back up into the moving average on light volume before rolling over altogether and plunging through the neckline of the head & shoulders, as I've delineated on the weekly chart of GRMN in Figure 6.6.
Figure 6.7. NASDAQ Composite Index, daily chart, 2007. The market top coincided with tops in big, leading stocks CROX and GRMN.: Chart courtesy of eSignal, Copyright 2010

The timing of short sales also coincides with the action of the general market. It is important to understand that the head & shoulders formations of both CROX and GRMN did not form in a vacuum; they topped and formed their short-sale set-up formations as the market itself was building its top. Figure 6.7 shows the NASDAQ Composite Index in late 2007 as it built its overall top before plunging lower in early 2008. By comparing Figure 6.7 with the daily charts of CROX (Figure 6.4) and GRMN (Figure 6.6) you can see that both stocks initially peaked out right at the exact same time as the NASDAQ Composite Index. Once the NASDAQ Composite had broken down off its late October 2007 price peak, this initial decline was followed by nearly two months of backing and filling, which also coincided with CROX and GRMN building the right shoulders within their overall head & shoulders topping formations.
How topping patterns form is largely a function of the general market and usually peaks in the right shoulder of a head & shoulders topping formation, coinciding with peaks in general market rallies that occur after an initial break off the peak, just as CROX and GRMN built their patterns in a manner that is very much in synchrony with the NASDAQ Composite, e.g., the general market. Short-sale target stocks that may be building right shoulders in an overall, potential head & shoulders topping formation must be watched within the context of the general market as the two are inexorably linked. CROX and GRMN were big leaders during the bull market rally of 2007, and when the general market topped in late October 2007 it was no surprise that these stocks topped as well.
The examples of CROX and GRMN illustrate quite well the head & shoulders template that encompasses all the critical characteristics one should look for when identifying a head & shoulders top. While these were both examples of head & shoulders formations with one right shoulder, you will run into stocks that form more than one right shoulder, but this is often a function of the general market as it continues to back and fill before breaking down further as well as the stock's "institutional status." Big-cap favorites can take longer to break down, but normally as a stock forms two or more right shoulders it will typically break down through the neckline in the pattern at some point that coincides with the market starting a new down leg in an overall bear market. For example, while stocks like CROX and GRMN topped with the market in late 2007, larger-cap favorites like Apple, Inc. (AAPL) and Baidu, Inc. (BIDU) continued to build topping formations from which they broke down in September 2009, nearly a year after the October 2007 market top, as the market began a second major down leg in the 2007–2009 bear market (Figure 6.7). After the initial break off the peak in late 2007, we can see the backing-and-filling phase in the last two months of 2007 before the first real down leg of the bear market took CROX and GRMN with it. Another phase of backing-and-filling through most of 2008 finally ended with a second major down leg that began in September 2008. This was the point where another wave of leaders began to break down from their topping formations, which is typical of most bear markets (Figure 6.8). Leading stocks will begin to come apart and break down on each successive down leg during a bear market.
This is a very important concept to keep in mind as we discuss the other topping formations and set-ups that we look for in our short-sale operations later in this chapter. The market offers optimal windows of opportunity with each major down leg within an overall bear market, and it is critical that investors remain patient and vigilant in order to come in on the short side just as the market is starting another down leg and the optimal window of opportunity is opening.
Monsanto Co. (MON) in 2008–2009 (Figure 6.9) is an interesting head & shoulders example that formed in the midst of the bear market following the top in October 2007. Note that MON did not top with the market in October 2007, but instead continued higher as it nearly doubled in price by the summer of 2008 during what was actually a bear market rally within the overall 2007–2009 bear market environment.
Figure 6.8. NASDAQ Composite Index weekly chart, 2007–2009. Leading stocks top in "waves" that coincide with each new down leg in an overall bear market.: Chart courtesy of eSignal, Copyright 2010

Figure 6.9. Monsanto Co. (MON) weekly chart, 2007–2009.: Chart courtesy of eSignal, Copyright 2010

Figure 6.10. Monsanto Co. (MON) daily chart, 2008.: Chart courtesy of eSignal, Copyright 2010

Eventually, however, MON began to form a head & shoulders topping formation after peaking in June 2008. Although it is not labeled on the chart in Figure 6.9 you can see the high-volume price break off the peak in June that defines the right side of the "head" in the formation, after which MON forms two right shoulders, roughly, and then finally breaks down through its neckline at the exact same time that the market begins its second major down leg in the bear market. In MON's daily chart (Figure 6.10) we can see that right around the peak of the first right shoulder the stock showed three up days where volume was −45 percent, −54 percent, and −63 percent below average daily trading volume, indicating that demand for the stock was potentially drying up. The stock then breaks down through its 50-day moving average down 19.5 percent to the neckline of the head & shoulders formation. As we discussed previously in this chapter, the first break through the neckline is usually a fakeout as it sucks in shorts and natural sellers before undercutting the neckline and then turning and rallying. In this case, MON rallied back up to a point just above its 50-day moving average to form the second right shoulder in the pattern.
Note that as the second right shoulder began to form MON's 50-day moving average had crossed below its 200-day moving average (corresponding to the 10-week moving average crossing below the 40-week on the weekly chart), a bearish "black cross." If an investor had successfully shorted MON off the peak of the first right shoulder as upside volume was drying up, the first break down to the moving average would have yielded a quick profit, and the ensuing rally could have been monitored for a potential failure point. Typically, stocks forming right shoulders will rally to a point just above the 50-day or 200-day moving averages, at which point a reversal back below the specific moving average, whether the 50-day or 200-day, can be shorted. After forming the peak of the second right shoulder MON breaks down to its neckline again, hovers around for a couple of days before splitting wide open to the downside.
Relatively smaller stocks like the CROX and GRMN examples will tend to break down faster, often only forming one single right shoulder in the head & shoulders formation, while very large-cap leader "favorites" like a MON can form two to three or more. Ultimately, however, the final break down will occur at the same time as a new down leg in a continuing bear market, so it is imperative to conduct short-sales in synchrony with the beginning of a new market down leg.
6.2.2. Late-Stage-Failed-Base (LSFB) Set-Ups
The second primary short-sale set-up and topping formation is the late-stage failed-base (LSFB), a corollary to the head & shoulders top that is usually seen more frequently than the head & shoulders formation, but which can also be seen as part of a head & shoulders formation, as we shall see a little bit later in this chapter. The LSFB, as we call it, forms when a stock breaks down from a late-stage base, which can happen after a failed breakout attempt or with the stock simply falling out of bed from a late-stage base formation. As always the pattern will have a big upside price run preceding it. After a long price run, each successive base that a leading stock forms on the way up becomes more and more obvious. When a stock finally builds a very late-stage base, usually the third or later base formed on the way up and after the initial breakout that began the price move several months earlier, it becomes very obvious to the crowd, which is then set up to be fooled.
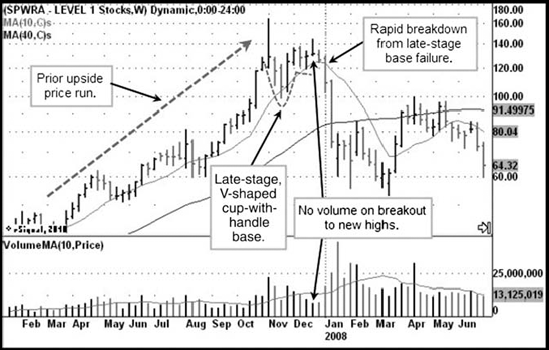
When the LSFB gives way to the downside it can often do so very rapidly, but just as often can break down through a major moving average, such as the 20-day or 50-day line, first and then back-and-fill several times as it rallies back up into the moving average before splitting wide open. In the most ideal example, Sunpower Corp. (SPWRA) in 2007 (Figure 6.11) was a late-stage, V-shaped cup-with-handle formation that failed very rapidly. SPWRA's weekly chart shows that the breakout attempt from this cup-with-handle formation occurred on light weekly volume as the stock stalled out and reversed to close at the very low end of the weekly trading range. Two weeks later, the stock pierced the 10-week (50-day) moving average and plummeted to the downside in rapid order, losing over 50 percent of its value in just about three weeks.
Figure 6.11. Sunpower Corp. (SPWRA) weekly chart, 2007–2008.: Chart courtesy of eSignal, Copyright 2010
As always, the daily chart (Figure 6.12) gives a much better picture of how the breakout failure occurs, and we can see that the initial V-shaped cup-with-handle base formed after the stock had put in a climactic type of price run into the peak on the left side of the cup. After the cup forms a handle, the breakout day comes on just average volume, making it suspect, and the ensuing days roll over as volume actually dries up.
For seven days the stock drifts down toward its 50-day moving average before bursting through the moving average on very heavy volume and moving sharply lower. In this case shorting the immediate breach of the 50-day moving average would have been the proper entry point. The stock plummets rather quickly from that point, pausing for three days in a short, inverted bear flag, what we also like to think of as "walking the plank." The third day in the "plank" or inverted bear flag, volume dries up to a very low −36 percent below-average, a VooDoo day. Using a stop at the prior day's high, it would be possible to add to a short position in the stock at this point. SPWRA did not waste any time making a beeline right through its 200-day moving average to the downside where it finally stabilized for several weeks underneath the 200-day line. SPWRA would have given a very quick 25–30 percent profit, which is where our profit rules might come into play and cause us to cover our short on this basis, which would obviously be premature given the extent of the additional downside that actually ended up occurring. The key here is to assess the velocity of the breakdown, so that if it is extremely weak to the downside as it collapses on heavy volume, one can use the 10-day moving average as an upside stop. Notice how SPWRA's 10-day moving average trails just above it on the way down once the stock breaks the 50-day moving average.
Figure 6.12. Sunpower Corp. (SPWRA) daily chart, 2007–2008.: Chart courtesy of eSignal, Copyright 2010

"Big stock" fertilizer play Potash Corp. Saskatchewan (POT) is an interesting example of a late-stage-failed-base that eventually morphs into a head & shoulders formation (Figure 6.13). Focusing on the LSFB, however, gets you into the stock on the short side a lot sooner. After breaking out from a late-stage five-week base in June 2008, POT drifts higher on declining volume before pulling back to its 10-week (50-day) moving average, which it tests for the next three weeks before finally failing and breaking down toward the 40-week (200-day) moving average. A final rally up into the 40-week line occurs just as the 10-week line crosses below the 40-week line, a bearish "black cross," before the stock splits wide open, literally blowing apart in four weeks.
While the weekly chart of POT makes it look rather easy, the daily chart (Figure 6.14) paints a slightly different picture as it demonstrates how persistence is necessary in successful short-selling, as well as waiting for the exact right moment to short the stock. POT's initial breakout from the five-week late-stage base was actually a short trendline breakout that occurred on reasonably strong volume. The stock actually looked very strong as it pushed higher on several higher-volume up days, but eventually this all gave way as the stock descended back down toward the trendline breakout and the 50-day moving average, corresponding to the 10-week moving average on the weekly chart (Figure 6.13). In Figure 6.14 we can follow the numbers as we track the stock's steady but somewhat stubborn breakdown. (1) A very low bounce occurs off the 50-day moving average and rallies to a point just above the 20-day moving average. A retest of the 50-day moving average briefly looks successful at (2) for one brief day before the stock breaks down again. At this point it appears that some support at (3) is coming from the five-week base from which POT had previously broken out as the stock seems to rally right out of "thin air" and back up into the 50-day moving average at (4) on below-average volume. Note that the next day the stock actually touched the 50-day moving average on intraday basis, and that volume was very light, showing that the stock ran out of upside fuel at that point. POT broke down hard from there before finding support at the 200-day moving average where it rallied up into and around the 20-day moving average, which we would use as a reference for a trailing upside stop. Note that POT was unable to clear the 20-day line on any volume at (5), which is a VooDoo day with volume coming in at −44 percent below average on the day. The stock then broke down again through the 200-day moving average before rallying once more into the 50-day moving average in a violent rally that accompanied a similar violent rally in the general market.
Figure 6.13. Potash Corp. Saskatchewan (POT) weekly chart, 2008.: Chart courtesy of eSignal, Copyright 2010

Figure 6.14. Potash Corp. Saskatchewan (POT) daily chart, 2008.: Chart courtesy of eSignal, Copyright 2010

If we take a chart of the S&P 500 Index and label it 1 through 6 as we have in Figure 6.14, we come up with Figure 6.15, which gives a good idea of how POT's breakdown was correlating to the general market action. In fact, POT was breaking out of its five-week late-stage base about two weeks after the actual top in the S&P 500. As the market continued to move lower throughout most of June 2008, POT's price action reflected this as its breakout began to fail and the stock flailed around its 50-day moving average, as we saw in Figure 6.14. You can also see how the little twists and turns in POT from points 1 through 4 correlate to some degree with the twists and turns of the general market. The movement from points 5 to 6 most certainly was a function of the general market, and the jagged break and final two-day "jack-up" rally into point 6 in POT's daily chart clearly mimics that seen in the S&P 500 chart. The window of opportunity becomes opens wide at point 6.
We cannot stress the importance of monitoring the general market when stalking your short-sale targets in individual stocks. In most cases, stocks' topping patterns can be seen to move in synchrony, at least to some degree, with the general market.
Figure 6.15. S&P 500 Index daily chart, 2008.: Chart courtesy of eSignal, Copyright 2010

As was mentioned earlier, short-sale set-ups and topping patterns can overlap, and in more than a few cases we observe a combination of topping patterns that occur as pieces of the overall topping process. Research in Motion (RIMM) in 2008 is an excellent example of at least two topping formations overlapping. To illustrate this we begin with the RIMM daily chart (Figure 6.16) which shows two distinct patterns up around the top between early May and late August 2008.
The first breakout occurs right at the very peak of RIMM's long-term upside price move in mid-June from a four-to-five-week base formation. The breakout quickly rolls over into the end of June and breaks to the downside. It was likely not possible to enter a short on the gap-down breakout failure given that the stock was already extended to the downside and well through the 50-day moving average. However, when it comes to short-selling, opportunity can often knock more than once, even twice, within a stock's overall topping phase. As we see in Figure 6.16 RIMM recovers to some extent to form a short, cup-with-handle formation with a handle that is moving straight across rather than drifting slightly lower as is preferred in a proper cup-with-handle formation (See O'Neil's How to Make Money in Stocks, 4th edition). Notice that as the stock finishes the handle it wedges up just a bit, logging a VooDoo volume signature as trade declines −36 percent and −37 percent below average on these two days, respectively.
Figure 6.16. Research in Motion (RIMM) daily chart 2008.: Chart courtesy of eSignal, Copyright 2010

This breakdown in late August coincides with the market's breakdown at the same time, as we can reference back to in Figure 6.15. The weakness in the late-stage cup-with-handle formation is accented by the heavy-volume gap-down in late June that marks the right side of the cup in the formation. The rally coming back up into the handle on the right side of the cup shows a general pattern of declining volume as the stock progresses into the end of the handle and flashes two VooDoo days right at the end, just before it begins to break down sharply. This is where the stock can be shorted.
What is most interesting about RIMM, however, is its hybrid combination of two LSFB's teaming up to form an overall head & shoulders topping formation with a "pinhead" that consists of the breakout from the five-week late-stage base up to the stock's ultimate peak in June, and then the one-week decline that marks the breakout's official failure. The handle in the ensuing cup-with-handle formation forms the right shoulder of the head & shoulders formation, which eventually pierces the neckline and plummets to the downside, as we see in Figure 6.17.
RIMM points out the importance of focusing on weak price/volume action within the pattern, looking out for potential VooDoo volume signatures within wedging little rallies or consolidations rather than obsessing over the precise "shape" and "label" you want to give the pattern. Short-sale set-ups all have some basic characteristics that can be summed up as follows: (1) a big, prior price run-up of several weeks to several months; (2) a high-volume break off the peak that takes the stock below a critical moving average, such as the 50-day or 200-day moving averages; and (3) a series of weak rallies back up into the moving averages where we seek to find optimal short-sale points based on the VooDoo day concept.
Figure 6.17. Research in Motion (RIMM) weekly chart, 2008.: Chart courtesy of eSignal, Copyright 2010

6.2.3. Punchbowl of Death (POD) Set-Ups
Late-stage-bases that fail and set-up as LSFBs can often occur from cup-with-handle formations that are wide and loose. When these cups begin to get more than 50 percent deep in what is essentially a rapid price break down from a peak price that follows a prior huge price run-up, they become something more than mere "cups." What they become, quite frankly, are "punchbowls," hence the short-sale set-up and topping formation we refer to as the Punchbowl of Death or POD formation.
The basic concept behind the POD formation is a rapid price run-up in a "hot" leading stock followed by an equally rapid price decline of more than 50 percent. When the stock declines so sharply, investors who missed the first run to the upside see the stock as extremely "cheap," driving the stock up rapidly back up to its prior highs, giving the impression of a giant double-top, "cup," or as we refer to it, "punchbowl." The problem with a second priced run-up to the right side of the punchbowl is that it is simply too rapid to be sustained, and so it breaks down very quickly from that point. As in the example of Ariba, Corp. (ARBA) in Figure 6.18, a high-volume failure of the peak of the punchbowl's right side marks the beginning of the final decline.
Figure 6.18. Ariba Corp. (ARBA) weekly chart, 2001.: Chart courtesy of eSignal, Copyright 2010

ARBA demonstrates this as the POD failure occurs with the stock breaking the 10-week (50-day) moving average on very heavy volume. Several rallies back up into the 10-week line occur before one last rally precedes a final break through the 40-week (200-day) moving average, after which the stock plummets precipitously. In most cases a POD should be of a short time duration, anywhere from 28 to 40 weeks or more, but often the shorter the better. ARBA has a 26–28 week long POD formation in the example shown, but in longer POD formations, such as we will see in Charles Schwab Corp. (SCHW), the formation can be a year in duration but should also have a very sharp run up the right side of the punchbowl. It is the rapid run-up to old highs in a former, beaten-down leader that is the critical characteristic in any POD that determines whether the formation is sustainable and hence prone to failure. Long, rambling punch bowl-like formations with gradual slopes up the right side of the formation are not what we are looking for in a POD.
Figure 6.19. Ariba Corp. (ARBA) daily chart, 2001. Shorting the POD failure.: Chart courtesy of eSignal, Copyright 2010

As the daily chart of ARBA shows (Figure 6.19) the mechanics of shorting a POD failure are very familiar since they do not differ very much from what we've seen in our previous discussions of the head & shoulders and LSFB set-ups. Essentially, a breakdown from the peak of the right side of the POD occurs on heavy volume as the stock breaks through the 50-day moving average until it finds support at the 200-day moving average and rallies back up into the 50-day moving average at point 1. Another test of the 200-day is followed by another rally at point 2 right into the 50-day moving average, and this rally occurs on a number of below-average volume days. Both points 1 and 2 would serve as logical short-sale entry points, and profit-taking rules would likely have you covering around the 200-day moving average and then shorting the second rally into the 50-day moving average at point 2 on the chart. In this example the rallies pushed right into the 50-day moving average and were halted in their tracks at the line. In other cases, as with head & shoulders and LSFB short-sale set-ups, the stocks often will rally to points just above the 50-day moving average after the initial breakout failure off the right side of the POD.
Figure 6.20. Charles Schwab Corp. (SCHW) weekly chart, 1999–2000.: Chart courtesy of eSignal, Copyright 2010

Charles Schwab Corp. (SCHW) in 1999–2000 is an example of a longer-term POD that is nearly a year in duration (Figure 6.20). In this case the stock displays a necessary characteristic for such a long-duration POD formation to be valid as a short-sale set-up, and that is the very rapid, four-week price run-up on the right side of the one-year-long punchbowl. This rally closes in new high price ground on a weekly basis before immediately gapping down the next week and beginning a rapid descent that takes the stock down about 40 percent. Had SCHW instead rambled higher, slowly climbing up the right side of the punchbowl, it would likely not have had a sharp break off the peak. The rapid run up the right side does not allow for any consolidations that would weed out weak hands and bring in strong hands as the stock builds a base, moves up, builds another base, and moves up in a slow-moving ascent. By running up so sharply, the stock creates a lot of weak hands who are now seeing a big profit in the stock they bought lower in the POD and are likely to sell, as well as catching some overhead supply from the left side of the formation from investors who bought near the peak in March 1999. For these reasons, as well as the action of the general market which topped in March 2000, SCHW's POD failure worked very well on the short side.
Figure 6.21. Charles Schwab Corp. (SCHW) daily chart.: Chart courtesy of eSignal, Copyright 2010

The daily chart of SCHW (Figure 6.21) shows the rapid ascent up the right side of the POD and the subsequent breakdown back through the 20-day moving average on the down side. This results in a very sharp break down to the 50-day moving average, at which point the stock bounces violently back up into just above the 20-day moving average. The stock backs down below the 20-day moving average and the third day up around the 20-day moving average flashes a volume dry-up (VDU) or VooDoo volume signature as trade drops to −34 percent below average. This is the point at which to short the stock. Later on, once the stock drops below the 50-day moving average, rallies up into the 50-day line to become shortable as we see on the very far right of the daily chart in Figure 6.21. Another example observed at the same time and which played out very similarly to SCHW, but which we do not show here, was America Online (AOL) in 1998–2000. We leave it to the reader to investigate AOL (at one time TWX following the merger with Time-Warner Co.) on their own.
During the 2007 general market rally otherwise "dull" shipping stocks, that is, the stocks of companies that put "stuff" on big boats and move them around the globe so consumers around the world can get their "stuff," became all the rage as the group launched on a massive upside price run. The leader of the pack at that time was Dryships, Inc. (DRYS) which had a tremendously steep upside price run through most of the year (Figure 6.22). When the general market topped in October 2007, the shippers, as one of the big "darling" groups in the bull rally, topped with it. DRYS, and its shipping brethren all collapsed, plummeting over 50 percent from their bull market price peaks, as we see in DRYS' weekly chart. In January 2008, however, the stock found a bottom, retested it once on the weekly chart, and then took off on a steep eight-week run up the right side of the POD. Interestingly enough, DRYS has a sharp, climactic type of run at the end of the rally up to the peak on the right side of the POD, which is potential topping action that should be watched for as a stock comes up the right side of a POD. This can provide a clue that is useful in developing conviction to short the stock once you see the first high-volume reversal at the peak on the right side.
Figure 6.22. Dryships, Inc. (DRYS) weekly chart, 2007–2008.: Chart courtesy of eSignal, Copyright 2010

When viewed on a weekly chart, DRYS short-sale set-up looks almost exactly like a POD that was formed by Reading Railroad in 1907. Copyright issues prevent me from showing that chart here, but it is fascinating to see the exact same pattern work the exact same way, even though they occurred 100 years apart. But then, as O'Neil and his predecessor like to say, the stock market is simply human nature on parade, and as long as human psychology remains the same we can expect that the same chart patterns and set-ups, whether on the long side or the short side, will continue to reappear both now and into the indefinite future.
Figure 6.23. Dryships, Inc. (DRYS) daily chart, 2008.: Chart courtesy of eSignal, Copyright 2010

After running rapidly up the right side of the POD, DRYS quickly flames out as it reverses on very heavy volume, breaks down below its 10-week (50-day) and 40-week (200-day) moving averages, and then proceeds to bump up into both of those moving averages for the next 11 weeks before blowing apart completely as the general market broke down in September 2008 (refer to Figure 6.15)
You can see in Figure 6.23 that DRYS looks very similar to ARBA and SCHW on the daily chart, reversing sharply on huge volume right off the peak of the right side of the POD, crashing down through first the 20-day moving average before rallying up into the 20-day line twice with volume drying up sharply on two VooDoo days right at the line, as the daily chart shows. The second rally up to the 20-day moving average reversed as volume that was −40 percent below average indicated a severe lack of demand for the stock at that point, and so it gapped down the next day as volume picked up meaningfully. Once the stock breaks down through the 50-day and 200-day moving averages, those moving averages become reference points for short-sale points as the stock rallies twice up into its 200-day moving average before rolling over again in early July 2008. One of the things working against the POD at the peaks are the mad rushes to the upside that characterize both the left and right peaks of the POD formation. The first one on the left side results from a normal, but sharp bull market–related rally in the stock, usually a stock that is considered one of the hot leaders of any particularly bull market phase. The second rush up the right side of the POD occurs so quickly, without ever taking time to shake out weak hands and bring more strong hands into the stock, so that the wild run becomes unsustainable. DRYS' run up the right side of the POD gets so out-of-control that it culminates in a climactic-type of five-to-six-day run to the peak before the stock reverses back to the downside. The stock is often shortable on the first high-volume reversal off the peak on the daily chart, but once it breaks, the 20-day moving average rallies back up into the 20-day line and can be used to short into as they come up on weak volume, certainly like the VooDoo volume signature days seen at the 20-day in the DRYS example.
Another instructive Punchbowl of Death short-sale set-up can be found in Apple, Inc. (AAPL) during late 2007 into September 2008, which actually began forming its POD top with a late-stage-failed-base (LSFB) short-sale set-up in late 2007, as we see in the weekly chart (Figure 6.24). During the period in which AAPL formed its POD top, other "big stocks" of the bull market that ended in late 2007 like Baidu, Inc. (BIDU) and First Solar (FSLR) formed POD tops of their own, roughly in synchrony with AAPL. We leave it to readers to investigate those on their own and instead focus on AAPL. Following the late-stage failure in late 2007–early 2008, AAPL's stock price was cut nearly in half in six short, brutal weeks. It then bottomed after 12 weeks and turned to the upside, scampering back toward the 200 price level in a mere eight weeks. This made the entire POD a short 20 weeks in duration. AAPL was a "big stock" favorite in the immediately prior bull market, and so it spent a lot of time bouncing between its 50-day moving average and resistance at the 180 price level on the upside, and the 200-day moving average on the downside, before finally giving way and splitting wide open in conjunction with the market break in September 2008.
Figure 6.24. Apple, Inc. (AAPL) weekly chart, 2007–2008.: Chart courtesy of eSignal, Copyright 2010

We will split the view of AAPL's price/volume action during 2007–2008 on the weekly chart (Figure 6.24) into two daily charts for a more detailed look at how AAPL broke down on both the left and right sides of the punchbowl. Figure 6.25 shows the breakdown from the late-stage cup-with-handle formation AAPL formed in late 2007, moving higher even after the general market had topped in late October 2007 before it finally topped in late December. Note that once AAPL broke down through both the 20-day and 50-day moving averages, it only spent another six days backing and filling as it wedged up into its 50-day moving average on weak volume. The rallies into the 50-day line were the optimal short-sale points, and put you in position to benefit from the ensuing, sharp break to the downside that extended into February of 2008. It is interesting to note that the breakout day for AAPL came on VooDoo volume that was −56 percent, less than half, of average daily trading volume for the stock. This was a clear sign of a lack of demand for AAPL as it cleared to new highs and failed to hold the highly-publicized 200 price level.
Figure 6.25. Apple, Inc. (AAPL) daily chart, 2007–2008.: Chart courtesy of eSignal, Copyright 2010

AAPL's move into the 200 price level was reminiscent of Jesse Livermore's comments regarding his play in Anaconda Copper back in 1907, when he said, "It was an old trading theory of mine that when a stock crosses 100 or 200 or 300 for the first time the price does not stop there but goes a good deal higher, so that if you buy it as soon as it crosses the line it is almost certain to show you a profit." When Anaconda Copper cleared the 300 price level for the first time in 1907, Livermore observed the action in the stock, "I figured that when it crossed 300 it ought to keep on going and probably touch 340 in a jiffy." Anaconda, however did not act as it should, and Livermore noted that "Anaconda opened at 298 and went up to 302 but pretty soon it began to fade away. I made up my mind that if Anaconda went back to 301 it was a fake movement. On a legitimate advance the price should have gone to 310 without stopping. If instead it reacted it meant that precedents had failed me and I was wrong; and the only thing to do when a man is wrong is to be right by ceasing to be wrong" (Edwin Lefevre, Reminiscences of a Stock Operator Illustrated [Hoboken: John Wiley & Sons, 2004], 101). A modern-day example of Anaconda Copper, AAPL could not clear the 200 price level in late December 2007, and that action was further confirmation of its bearish, topping action, and the stock began to break down rapidly.
Once AAPL had broken down into the February 2008 lows, it began to turn in March and rallied back up in an eight-week rush into the right peak of the POD formation (Figure 6.26). Note that as AAPL came up to the peak, upside volume was below average, while two above-average selling spikes hit the stock on the way up. The stock made a little double-top right around the 190 price area, with weak −36 percent below-average volume on the second top.
Once AAPL began to fail off the right side of the POD, it took several weeks before it completely broke to the downside at the same time that the general market broke in September 2008. The last-gasp rally that AAPL logged when it pushed up into logical resistance at the 180 price level was the optimal spot to begin shorting the stock. Note also that there is a little, wedging (e.g., up on the day with very light volume) day with volume −45 percent below average, a VooDoo volume signature. Shortly thereafter the stock begins to roll over and busts through all of its moving averages in a matter of days as the general market began a very sharp down leg in September. It is important to note that short-sale reference points occurred throughout the backing-and-filling phase that began in late June and continued until the stock split wide open in September. In most cases, light-volume moves up into or just above a key moving average or a logical area of support, such as the 180 price level in AAPL's daily chart, were the best spots to short shares of AAPL in 2008.
Figure 6.26. Apple, Inc. (AAPL) daily chart, 2008.: Chart courtesy of eSignal, Copyright 2010

Some of the most rapidly-rewarding POD formations to play can be those that occur in very "hot" IPOs such as the solar stocks in 2007–2008. Hot IPO merchandise can often start "flying off the shelves" when a particular theme catches the investing community's eye, such as the Internet stocks in 1999–2000 or the solar stocks in 2007–2008. Often, hot IPO stocks that go straight up have a nasty habit of coming straight down, particularly if they are coming in on the tail end of all the excitement over a particular theme, such as Trina Solar (TSL) was in 2007 (Figure 6.27). TSL had a great move from its initial IPO date in late 2006, but after that it had several failed breakout attempts from what were essentially IPO POD type formations in that they had the straight up and then straight down, followed by straight up again, look that typifies these unsustainable, speculative rocket moves in such stocks.
TSL's weekly chart in Figure 6.27 actually shows two shortable POD formations, a "double-POD" rarity. These are both very short patterns of about 8 weeks and 12 weeks, respectively, and both PODs have a right peak that is characterized by a high-volume reversal week on the chart.
Figure 6.27. Trina Solar Ltd. (TSL) weekly chart, 2007.: Chart courtesy of eSignal, Copyright 2010

If we break this down into two separate daily charts for each POD formation (Figures 6.28 and 6.29), we see that the mechanics are roughly the same as we've seen in the prior POD examples of ARBA, SCHW, and AAPL that we've discussed previously. The first POD that TSL formed is shown in Figure 6.28, and again we see the high-volume reversal right off the right peak of the POD, marking the end of the stock's upside rush. This is then followed by a series of jerks back up into the 32 price level that start to define a clear area of resistance. On the third and fourth rallies up into and around the area defined by the 20-day moving average and the 32 price level resistance, volume begins to lag, and the stock becomes shortable at this point. The breakdown is very rapid from that point.
The breakdown off the right side of the POD that TSL formed in Figure 6.28 led to another wild, upside rally, but in this case the stock pauses to form a handle through most of October 2008 (Figure 6.29). When it tries to break out, the high-volume reversal off the peak of the right side of the POD rears its head yet again in this example and clocks the stock, knocking it straight down through its 20-day, 50-day, and 200-day moving averages in a matter of three days. The stock then rallies weakly back up into the 50-day moving average before breaking down and gapping lower. You can here see why taking profits when a short-sale position becomes extended to the downside is critical in handling these types of plays. After the sharp gap-down in mid-November TSL, it then rallies back up into the 50-day and 200-day moving averages before it finally flashes a low-volume VooDoo day at the peak of a rally into the end of December 2007 and then rolls over altogether.
Figure 6.28. Trina Solar Ltd. (TSL) daily chart, 2008.: Chart courtesy of eSignal, Copyright 2010

Figure 6.29. Trina Solar Ltd. (TSL) daily chart, 2008.: Chart courtesy of eSignal, Copyright 2010

Other examples of IPO PODs during the solar stock craze of late 2007 are Yingli Green Energy (YGE) and LDK Solar Ltd. (LDK), which readers can study on their own.
The Punchbowl of Death short-sale set-up and topping formation can be a very rewarding one, particular if a short-seller is able to identify the "rush" up the right side of the POD and wait for the first high-volume reversal day to short the stock off the right peak. Some very quick, sharp profits can be gained thereby, as the examples we've discussed have demonstrated, but once the stock has broken down off the right side there are numerous areas and points where the stock can be shorted again as one "campaigns" it on the short side.