
Chapter 5
Trading with the Moving Average Template
In this chapter, we'll go through a series of examples of trading with the moving average template, each starting with a chart and followed by an explanation of the trade. Let's get started.
I use the Williams %R a little bit differently than some of the other indicators. For a long-side trade, I want to see the Williams %R above the second line from the top. For a short-side trade, I want to see the Williams %R below the second line from the bottom.
In each case, the trade must be corroborated by a rising or falling moving average trend. Moreover, the moving averages should be aligned correctly. By that I mean, for a bullish trade I want to see the 21-period average on top, followed by the 55-period average in the middle, and the 89-period average on the bottom. For a bearish trade, I want to see the 21-period moving average on the bottom, the 55-period average in the middle, and the 89-period average on top. Very simply, this alignment shows that recent momentum, as reflected by the shorter moving averages, is moving in the direction of the potential trade. I don't follow this rule exactly in every situation. At a minimum, I want to see the two faster moving averages trending in the direction of the potential trade.
As the session opens in Figure 5.1, the moving averages are in a bearish alignment, with the fast-line, 21-period average on the bottom, the 55-period average in the middle, and the 89-period average on the top. All of the averages are sloping downward. The Williams %R is also moving down. When the %R crosses the lower line, you can put on a short-side trade.
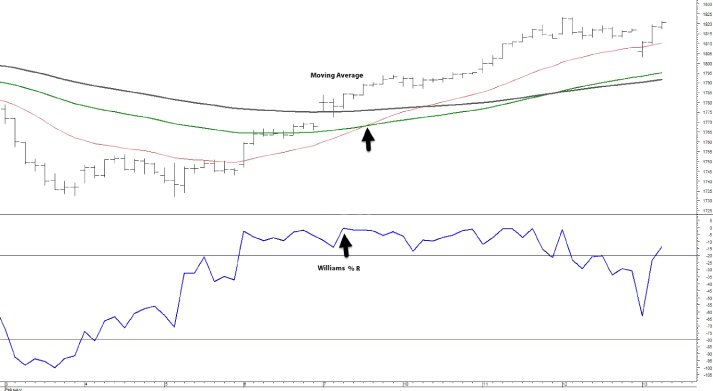
Figure 5.1 Moving Average Template Trade 1
As the session continues, the market begins to flatten and then rally. The %R follows suit. About a third of the way into the session, the %R crosses the top line and stays there, setting the stage of a potential long-side trade. When both the 21-period and 55-period moving averages turn up, I feel comfortable going long the market.
The market flattens toward the later part of the session and the %R falls below the top line. Toward the right edge of the chart, the %R again crosses the top line and the moving averages are in a bullish alignment and are trending upward. This might be an opportunity for a longer term trader, but it's too late in the day for me.
The market opens flat in Figure 5.2. The %R moves into a bearish condition early on, but the moving averages do not confirm. Then, the %R spikes up, entering bullish territory, but again there's no confirmation from the moving averages.
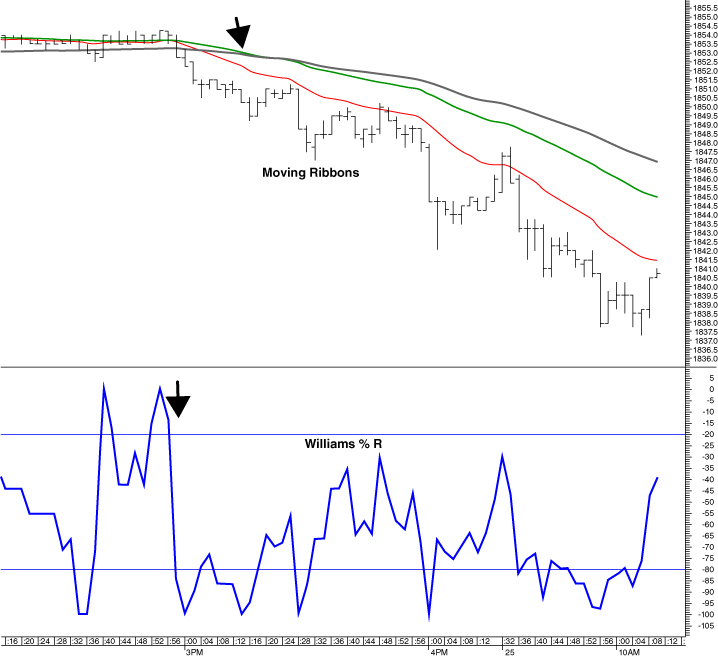
Figure 5.2 Moving Average Template Trade 2
About one third of the way into the session, prices start to decline; the %R moves sharply lower, crossing again into a bearish condition; and all three moving averages trend lower. This is an excellent 80/20 opportunity.
If you took your profits quickly on the first opportunity, there are other short-trade opportunities through the remainder of the session. The moving averages trend down and are in a bearish alignment until the end of the session. Each time the %R falls below the bottom line, you have the signal to take a short position.
Early in the session in Figure 5.3, prices start moving higher, and the %R enters bullish territory. The moving averages are in a bullish alignment, with the fastest lines above the slower lines. When the averages tilt upward, you have an 80/20 long-side trade.

Figure 5.3 Moving Average Template Trade 3
The market continues higher, producing a profitable trade. Shortly thereafter, the market retreats and the %R falls below the bottom line into bearish territory. The moving averages do not confirm a short-side trade.
About one third of the way into the session, the market starts moving higher again. The %R quickly moves into a bullish condition and the fast-line moving average tilts upward again after a brief downward bend. Once that happens, you have permission to go long.
The fast-line moving average flattens out through most of the second half of the session. The %R briefly turns bearish, then bullish, and then bearish again. Just as quickly, the %R retreats from tradable conditions. In none of these cases does the moving average provide a strong enough signal to make a trade.
Finally, toward the end of the session, the %R again crosses into bullish territory. And this time, the fast line tilts upward. With the alignment of the moving averages still bullish, this is an opportunity to make a quick long-side trade. I might take this trade as there's still enough time in the session for the trade to work.
The market is choppy at the beginning of the session in Figure 5.4. The Williams %R moves into bearish territory and the fast line of the moving average crosses below the medium line. However, the moving averages are not in the proper alignment for a bearish trade. What you want to see is the fast line at the bottom, the medium line above the fast line, and the slow line on the top. Without that sequence, this is not a good short trade.
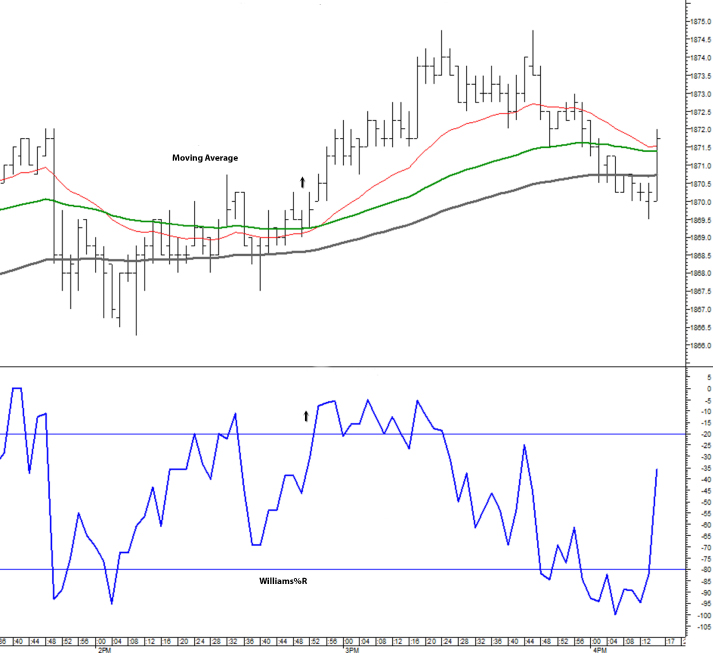
Figure 5.4 Moving Average Template Trade 4
Just before halfway into the session, the Williams %R moves higher and crosses into bullish territory. At about the same time, the fast line of the moving average crosses the medium line. The moving averages are in a bullish alignment and they are all tilted upward. This is an excellent 80/20 trade.
The session opens with the moving averages in a bullish alignment and the Williams %R in bullish territory in Figure 5.5 but sinking fast. I would stay away from this situation and wait for more clarity.

Figure 5.5 Moving Average Template Trade 5
About one fifth of the way into the session, the Williams %R rallies into bullish territory. The moving averages are still in a bullish alignment, and they are all trending upward. You could take this trade. However, at best, you would take a small profit or a scratch here. You very well might take a loss.
This is beginning to look like a market that is trying to go higher but can't get any traction. Many times, when a clear bullish or bearish trade setup has no follow-through momentum, it's a signal that the market may be ready to go the other direction.
About two thirds of the way into the session, the Williams %R begins to break sharply lower and lands in bearish territory. Prior to this, the fast-line moving average descended to the bottom of the moving average alignment and all three moving averages started to accelerate down. Particularly because of the failure of the market bulls to move prices higher earlier in the session, this is an excellent short-trade opportunity.
This session in Figure 5.6 has a nice bullish tilt, with the moving averages in a continuous bullish alignment.
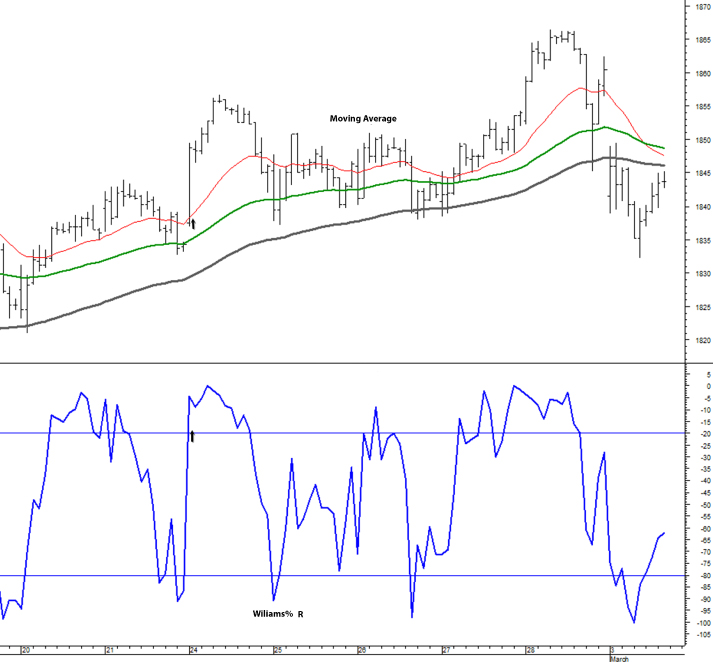
Figure 5.6 Moving Average Template Trade 6
Notice the three occasions when the Williams %R moves significantly above the .20 top line. Each time, there was a profitable trade to be made. In the first instance, when the fast-line moving average begins to tilt up, it's OK to go long. The second and third instances provide stronger setups because of the sharper angle of the fast-line moving average moving higher reflects rapid upward price momentum.
This session shows there are often multiple low-risk/high-reward entry points in a trending market. If you miss the first trade or you exit quickly, you'll often have an opportunity to get back into the market.
Throughout most of the period in Figure 5.7, the moving averages are in a bullish alignment. The Williams %R moves into bullish territory on three occasions: at the beginning of the period, about one third in, and about two thirds in. Then, late in the session, the Williams %R moves into bearish territory, signaling the best risk/reward trade of the session.
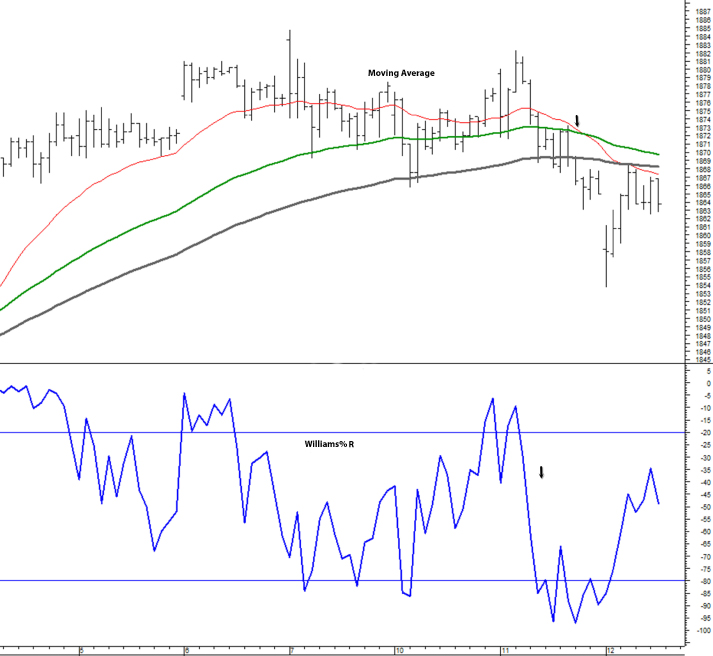
Figure 5.7 Moving Average Template Trade 7
Of course, it's always easier to read charts after the fact than in real time. Arguably, you could have gone long early in the session when the fast-line moving average began to separate from the other moving averages. With my style of trading, I would have had a scratch or a small profit on the trade.
In the second instance (about one third into the session), when the Williams %R moves into bullish territory, there's little follow-through in the price action. Given the restrained move in the moving averages, I would classify this as a 60/40 trade. Usually, my trades quickly go in the intended direction. If I were caught in a trade like this, I would get out quickly after noting the lack of price response.
In the third instance, when the Williams %R moves above the top line, the moving averages barely tilt up. Given the lack of moving average confirmation, I would stay on the sidelines. What happens next is interesting. The fast-line moving average, which has been relatively flat since midway through the session, tilts slightly down and then accelerates sharply down. The Williams %R falls dramatically and moves into bearish territory. When the faster-line moving average crosses the slower moving average, you have an 80/20 short-trade setup.
Coming into this session, the moving averages are in a bearish alignment and tilting slightly downward. But the winds of change are beginning to blow. Notice the sequence of change in Figure 5.8: The Williams %R begins to move up, the market itself jumps higher, the fast-line moving average tilts sharply up, and the two slower moving averages flatten out.
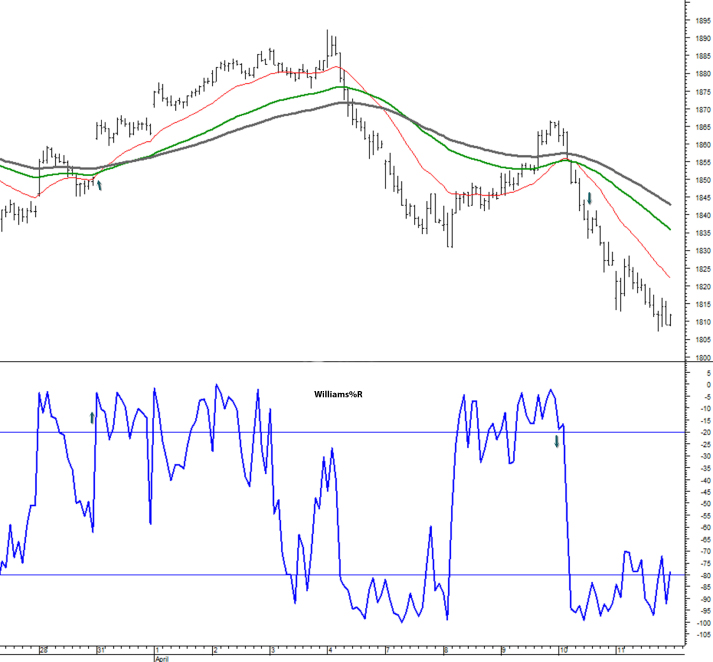
Figure 5.8 Moving Average Template Trade 8
After the market sells off for a few periods, it again starts moving higher. The Williams %R moves into bullish territory. The fast-line moving average crosses both slower lines, and the slower lines begin to tilt slightly upward. This is an opportune time to go long.
Around the middle of the session, the market begins a fairly steep decline. Again, the Williams %R and the fast-line moving average are the first indicators to reflect the price drop. The Williams %R remains in bearish territory. When the fast line crosses both the slower-line moving averages, you can go short.
Two thirds of the way into the session, the market begins to swing up again. The Williams %R moves into bullish territory. The fast line tilts sharply upward, and then the two slower lines tilt ever-so-slightly higher. However, after the fast line touches the slower line, it quickly retreats. Moreover, the Williams %R has now started moving down on its way to bearish territory. All the moving averages are now in a bearish alignment and moving sharply down. This is a great short-side trade.
In Figure 5.9, the moving averages are in a bullish alignment at the outset; however, prices are moving down and the Williams %R is also moving down and on its way to bearish territory. The market then bottoms and begins to move up. The Williams %R quickly turns bullish and the fast-line moving average flattens and begins to rise. The slower moving averages continue to tilt upward. This is a good trade to take, but you need to get in and out quickly.

Figure 5.9 Moving Average Template Trade 9
Notice that through the first half of the session, the market makes two swing highs, and notice that at the second swing high, the Williams %R showed substantially less upside momentum. This is a clear and pronounced bearish divergence. This should alert you to a possible short trade.
Immediately after the bearish divergence, the market does begin to drop and the fast-line moving average begins a swing down. A little later, the downturn accelerates and the short trade emerges. The fast-line moving average crosses the two slower lines, and the slower lines turn down. The Williams %R turns bearish. This is a great trade to take.
The session in Figure 5.10 begins with the moving averages in a bullish alignment, with the 21-day on top and the 55-day and 89-day underneath. But notice that the slope of the moving averages (particularly the 55-day and 89-day) is relatively flat. And with the Williams %R moving quickly from bullish to neutral territory, there's no trade to be made early in the session.

Figure 5.10 Moving Average Template Trade 10
Shortly thereafter, the Williams %R moves into bearish territory, and the 21-day moving average begins to turn down. Eventually, the 21-day crosses the 55-day and 89-day. This is a bearish situation that you might be tempted to trade. However, there are two mitigating factors that make this more of a 60/40 trade than an 80/20 trade:
- The 55-day and 89-day moving averages are relatively flat, and even the 21-day is moving at a modest angle.
- The moving averages are bunched together, which indicates that the market's directional bias is fairly weak. There simply isn't a lot of energy behind this bearish move.
After the bearishness dissipates, the Williams %R moves into bullish territory about one quarter of the way into the session. Initially, the moving averages remain bunched together, until suddenly the market gaps up. The moving averages then separate and slope sharply higher. This is an 80/20 trade, but you quickly move in and out.
Toward the end of the session, the moving averages begin to slope down and the Williams %R moves into bearish territory. Prices move quickly lower. With the market moving this fast, you have to pull the trigger quickly. In this case, if you waited for the fast line (21-day) to cross both the 55-day and 89-day lines, you would have been too late. If you got in as the 21-day crossed the 55-day, you could have made a few ticks.
As the session opens in Figure 5.11, the moving averages are in a bearish alignment, while the Williams %R and the actual prices are rising. The market then makes a swing high and starts dropping quickly.

Figure 5.11 Moving Average Template Trade 11
Normally, I look for the Williams %R to move into bullish/bearish territory before putting on a trade. In this case, I would be a little quicker. The downward momentum is very strong here, as evidenced by the separation of the moving averages and the sharp downward angle in prices. As the prices fall below the 21-day moving average, I would go short.
I don't see another 80/20 setup through the remainder of this session. With the moving averages in a bearish alignment, you should focus on short trades. However, the fast-moving 21-day moving average flattens out through the last two thirds of the session, indicating a decline in volatility and, hence, trading opportunities.
Early in the session in Figure 5.12, the market gaps up. The moving averages are in a strong bullish alignment and the Williams %R is in bullish territory. This is a good trade to take even though the ensuing market move is a little tepid. If you manage the trade well, you can make a few ticks.

Figure 5.12 Moving Average Template Trade 12
Just short of halfway through the session, the market breaks down. The 21-day moving average drops at a very steep angle. The Williams %R is bearish. I would go short after the 21-day moving average crosses the 55-day moving average. Given the steep downward angle on the 21-day moving average, there's no need to wait for it to cross the 89-day before putting on a trade.
Late in the session, the moving averages and the Williams %R transition from a bearish alignment to a bullish alignment. When the 21-day moving average crosses the two slower moving averages, it's safe to go long.
At the start of the session in Figure 5.13, the moving averages are in a bullish alignment, however, the 21-day moving average is starting to turn down. After a small move up at the outset, the Williams %R begins moving down and eventually crosses into bearish territory. There is no trade to make yet, but it's clear that the market is showing a bearish bias.

Figure 5.13 Moving Average Template Trade 13
Just two fifths into the session, the 21-day moving average crosses the 55-day moving average. After a quick spike up, the Williams %R starts dropping in a nearly straight line. Notice, too, the 55-day and 89-day moving averages have begun to turn down. This is a good time to go short.
About halfway through the session, the market begins to rally. The Williams %R moves into bullish territory. When the 21-day moving average crosses the other moving averages on the way up, that's a good signal to go long. However, the market begins to flatten at that point. Given the way I quickly move in and out of trades, I probably would have scratched on this trade.
Fortunately, the market provides another opportunity to go long about two thirds into the session. The moving averages have remained in a bullish alignment. When the Williams %R moves into bullish territory again, you have a signal to go long.