
Chapter 6
Trading with the Moving Ribbons Template
In this chapter, we'll go through a series of examples of trading with the moving ribbons template, each starting with a chart and followed by an explanation of the trade.
Early in the session in Figure 6.1, the moving average convergence-divergence (MACD) and the stochastic momentum are trending higher. However, the moving ribbons are relatively flat and converging, with the upper and lower lines moving closer together. There's no trade at this point.
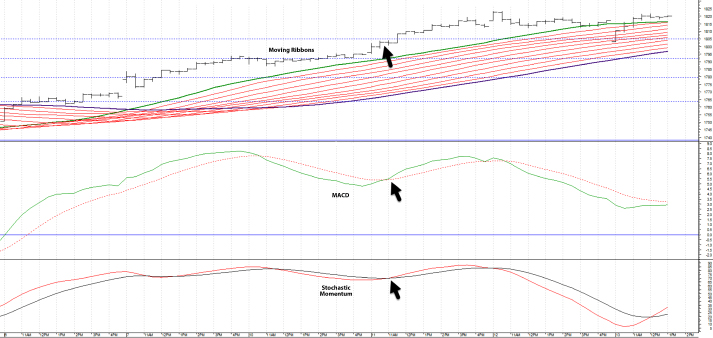
Figure 6.1 Moving Ribbons Template Trade 1
About one third of the way into the session, the ribbons as a whole begin to turn up although the slow line moves slightly lower. The stochastic momentum has flattened at this point. Again, there is no trade to make.
Later, the moving ribbons expand and move higher, with all the lines participating in the move. The MACD tops out and then moves lower, and the stochastic momentum continues flat to slightly down. With the indicators in conflict, you need to sit tight.
A little past halfway into the session, the fast lines on both the MACD and stochastic momentum move higher and cross the slow lines. At the same time, the moving ribbons remain in a sold uptrend. This is the clearest trading opportunity of the session. All indicators are bullish. You should move quickly to establish a position and capitalize on the upward momentum.
As is my style, I would move my stop up as the market rises and would get out of the trade with the momentum still in my favor. If you choose to wait for one of the indicators to turn down you would get out just prior to the session high. Either way, this is a very good trade.
About one third of the way into the session in Figure 6.2, the MACD and the stochastic momentum break sharply. The moving ribbons remains flat and then eventually confirm the down move when the fast line declines slightly. At this point, you can take the trade. Given the weak response with the moving ribbons, I would classify this as a 70/30 trade.
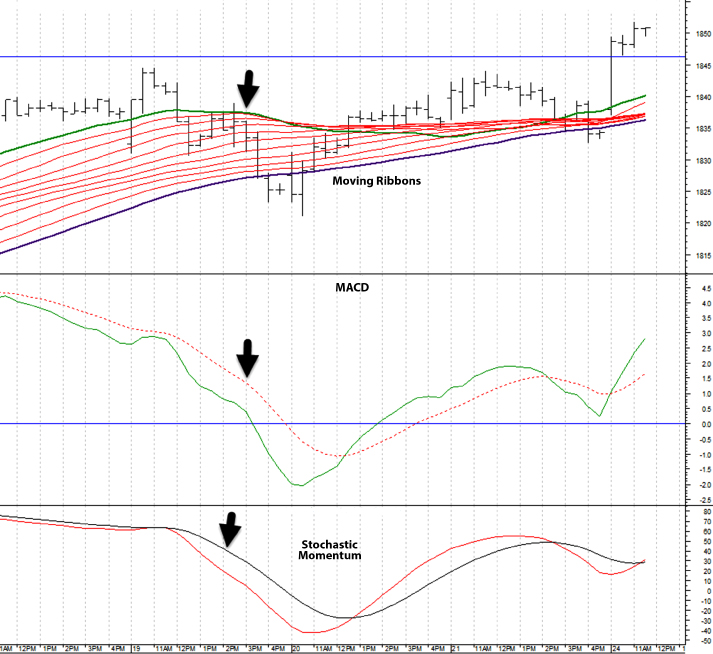
Figure 6.2 Moving Ribbons Template Trade 2
Late in the day, the moving ribbons are flashing a bullish signal. Then, the MACD reverses course and moves sharply up. However, the stochastic momentum provides a rather weak and late confirmation. I probably would stay out of this trade.
Through the first third of the session in Figure 6.3, the market moves sideways to slightly down. The MACD and stochastic momentum break, reflecting the bearish sentiment. However, the moving ribbons fail to confirm the bearish break. The bottom line on the ribbons trends up, while the top line is relatively flat. There simply isn't enough conviction in the market, as reflected in the three indicators, to make a trade.

Figure 6.3 Moving Ribbons Template Trade 3
A little past midsession, the MACD and the stochastic momentum bottom out and start moving higher. The price bars make three consecutive higher highs and higher lows. However, the moving ribbons remain flat. Again, there's not enough conviction for a trade.
After the price bars flatten for a period, the market again attempts to go higher. What's important here is that the MACD and stochastic momentum do not reach the highs they made earlier in the session. Thus, we have a mild bearish divergence between price and these two indicators. After the divergence, all three indicators begin to move down at very close to the same time. Here's your opportunity to make a trade. Get in quickly on the signal. Then get out quickly while the momentum is still in your favor.
Early in the session in Figure 6.4, the stochastic momentum and MACD are moving lower, but the moving ribbons are converging and moving slightly higher. Later, the stochastic momentum bottoms and begins to move slowly higher. The MACD follows slowly, until about one third into the session when it moves sharply higher. At this stage, the bottom line of the moving ribbons is moving higher, but the top line remains flat. About halfway into the session, when the moving ribbons begin to expand and the top line starts trending up, you have an excellent 80/20 set up.

Figure 6.4 Moving Ribbons Template Trade 4
Later in the session, the fast lines of the MACD and stochastic momentum break lower. When the top line of the moving ribbons begins a sharp descent, there's an opportunity for a quick short trade.
At the beginning of the session in Figure 6.5, the moving ribbons are moving up and the MACD and stochastic momentum are moving down. The stochastic momentum and MACD bottom and turn up, but by this time the top line on the moving ribbons has tilted down. No trade to make here.
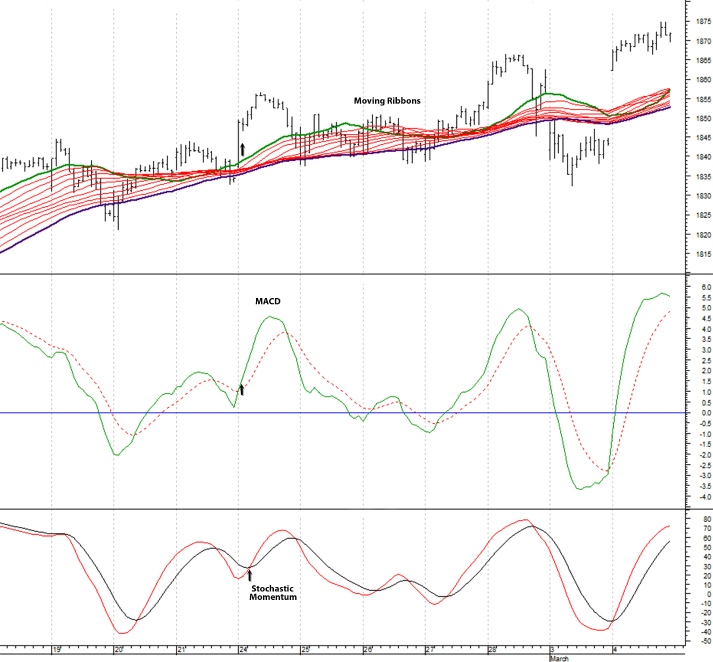
Figure 6.5 Moving Ribbons Template Trade 5
Prices rally, fall back, and then rally again. On the last rally, the top line of the moving average ribbons turns up and the fast lines of the stochastic momentum and MACD cross the slow line. The moving ribbons are still in an uptrend, and they are now widening. This is a good trade to take.
Later in the session, there's another chance to go long when the stochastic momentum and the MACD fast lines cross the slow lines and the top line of the moving ribbons begins to move higher.
There are two similarly structured trades in Figure 6.6. The second works out better than the first.

Figure 6.6 Moving Ribbons Template Trade 6
For a good part of this session, the moving ribbons are rising, and the MACD and stochastic momentum are falling. Just short of the halfway point of the session, the fast lines of the MACD and stochastic momentum cross the slow lines. Then, the moving ribbons reverse course and begin to tilt down. This is a good trade to take.
The market falls quickly, enabling you to take a profit on the trade. The market then rallies, which creates another good short side set up. About two thirds into the session, the fast lines of the MACD and stochastic momentum cross the slow lines, and the moving ribbons begin to expand and tilt downward. This is another good trade to take.
The market is relatively flat through the early part of the session in Figure 6.7 but slowly begins to move up. The stochastic momentum reflects the market's bullish bias first and is soon followed by the MACD. When the moving ribbons begin to tilt up, you have an 80/20 trade set up.
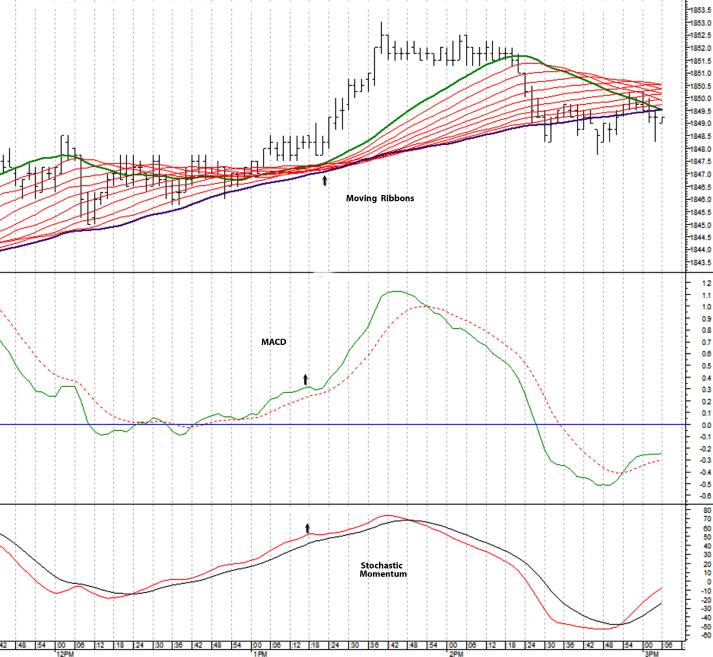
Figure 6.7 Moving Ribbons Template Trade 7
At the beginning of the session in Figure 6.8, the moving ribbons are trending higher, while the MACD and stochastic momentum are trending lower. About one quarter of the way into the session, the moving ribbons begin to turn down, with the fast line quickly moving through the other lines and finally crossing the bottom line. The MACD and stochastic momentum are still showing strong downside momentum. This is a good short trade to take.

Figure 6.8 Moving Ribbons Template Trade 8
Through the remainder of the session, the moving ribbons continue in a bearish pattern. The faster lines move slightly higher in concert with the stochastic momentum and MACD; however, the overall formation trends down. Toward the final third of the session, the market tops and the stochastic momentum and MACD turn down. When the fast line of the moving ribbons turns lower, you can short the market.
Toward the middle section of the session in Figure 6.9, the market makes two swing highs. The second swing high is made on lower momentum in the MACD and, to a lesser extent, the stochastic momentum. You should be looking to get short at this point.

Figure 6.9 Moving Ribbons Template Trade 9
Following the divergence, the MACD and stochastic momentum track lower, with the fast lines in both indicators crossing the slower lines. When the fast line of the moving ribbons begins to turn and cross the slower lines, and the overall formation begins to converge, you can go short.
Early in the session in Figure 6.10, there's a brief rise in the market followed by a sharper fall. The MACD, the stochastic momentum, and moving ribbons turn bearish at about the same time. This is a good, quick trade to take.
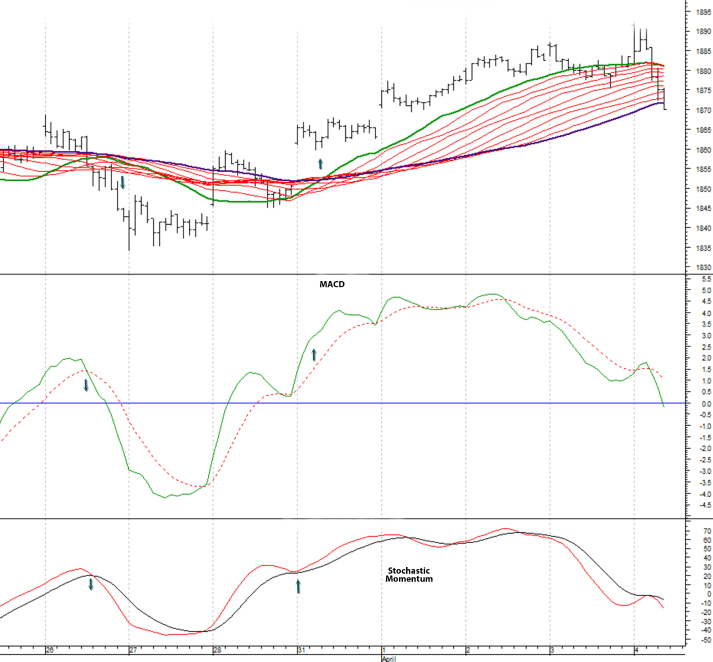
Figure 6.10 Moving Ribbons Template Trade 10
The market bottoms and then starts rising again. The stochastic momentum and the MACD reflect the bullish move. When the moving ribbons turn positive and the fast line of the moving ribbons crosses the slow line, there is a good opportunity for a long-side trade.
At the start of the session in Figure 6.11, the moving ribbons are flat and bunched together. There's no trade to make at this point.

Figure 6.11 Moving Ribbons Template Trade 11
The MACD and the stochastic momentum begin to move higher about one fifth of the way into the session. However, the moving ribbons remain flat. This is not an 80/20 trade at this point. Thereupon, the market then gaps higher and the ribbons begin to tilt upward. This is a good bullish setup.
About one third of the way into the session, the MACD and the stochastic momentum turn down. Shortly thereafter, the fast line on the moving ribbons begins to tilt slightly downward. Then the slight tilt transitions into a much sharper downward slope. This is a good bearish setup.
About two thirds of the way into the session the MACD and the stochastic momentum are moving up at a fairly sharp slope. When the fast line on the moving ribbons turns up, confirming the other two indicators, there is another bullish setup.
Finally, about four fifths of the way into the session, the market makes a swing low on weak momentum, as demonstrated by the MACD. While this is not a classic divergence pattern because the swing low did not exceed the previous swing low, the fact that the downside momentum was so weak indicates that sellers are losing conviction. I would look for a bullish situation to emerge.
Sure enough, the market gaps higher. The MACD and stochastic momentum turn up and the moving ribbons tilt slightly higher. When the fast-line moving average turns higher, it's a good situation to go long.