If you have an issue with SharePoint, or even with Windows Server, or your network for that matter, the tools that we’ve looked and discussed up until this point will give you greater depth of vision into the situation. For example, the ULS Viewer that we looked at in Chapter 9, allows you to slice and dice the logs from SharePoint, and lets you find the issues or entries related to the issue that you can use as queries in your favorite search engine. The sysinternals tools discussed in the previous two chapters, Process Explorer and Process Monitor, are the best tools to peer into a Windows Server and help you identify troublesome things that might be otherwise unexplained. And finally, the various tools discussed in Chapter 10 will give you a deeper look at IIS logging and transactions, as well as your network.
In this final chapter, as we wrap up of the chapters on troubleshooting and the book, we will look at the built in SharePoint Health Analyzer tool, the Performance Analysis of Logs (PAL) tool , the SharePoint Admin Feature tool, and the SharePoint Manager Tool. The PAL tool, while not nearly as robust as ProcMon or Process Explorer, is another tool that could be used to look at more than just SharePoint, as you’ll see when it is discussed. Let’s talk about the SharePoint Health Analyzer tool.
SharePoint Health Analyzer Tool
The SharePoint Health Analyzer Tool is built into SharePoint and it relies on about 24 timer jobs that try to analyze various parts of the SharePoint farm and its health. In a default installation of SharePoint, there are 76 health analyzer rules, which are broken down into the following categories :
Security: 5 rules
Performance: 14 rules
Configuration: 39 rules
Availability: 17 rules
System: 1 rule
All of the rules are enabled, by default. So if you have a SharePoint 2010 that is patched at February 2011 or higher and you run:
Get-SPHealthAnalysisRule | Sort Category | Format-Table Name, Category, Enabled You’ll get a list of all 76 jobs. All of the jobs should be enabled and have a value of true. If you see one or more that have a value of disabled, this is cause for investigation as to why the job is disabled.
The System category rule is not visible via the GUI of Central Administration. Most of the health analyzer rules rely on timer jobs that run on preset schedules, which normally should not need to be adjusted. And, it’s possible for third-party application developers to create Healthy Analyzer rules. If you would like to take a count, you could run
(Get-SPHealthAnalysisRule).count One of the most common configuration health analyzer rules that you’ll come into contact with is the Missing Server Side Dependencies . The most common causes for this are:
Content databases being migrated to a target farm that does not have the same solutions deployed as that of the source farm
Solutions retracted from the farm before they’ve been deactivated in all of the lists, libraries, and sites
The best way to address this is to redeploy the solution, deactivate the features from within the lists and libraries, and then retract the solution. Things can get out of hand when tools like SharePoint Admin and clean up tool are used to attempt to resolve this rules findings. We’ll talk about its use a little later in this chapter.
All of the jobs could be set to attempt to repair automatically, but this is not a good idea. It’s a case of just because you can does not mean that you should. Table 11-1 lists the jobs that are set to attempt to repair automatically, by default by name and category.
Table 11-1. Rules Where Automatic Repair Is Enabled by Default
Rule Name | Category |
|---|---|
Databases used by SharePoint have fragmented indices | Performance |
Databases used by SharePoint have outdated index statistics | Performance |
Search - One or more crawl databases may have fragmented indices | Performance |
Firewall client settings on the cache host are incorrect. | Configuration |
Web.config files are not identical on all machines in the farm | Configuration |
One or more services have started or stopped unexpectedly | Availability |
One of the cache hosts in the cluster is down | Availability |
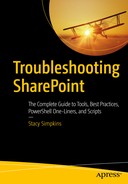
Another case of the just because you can does not mean you should, is with listening to the SharePoint Health Analyzer remedies. One case in point is the remedy for the security category rule named “Accounts used by application pools or service identities are in the local machine Administrators group.”, advises the admin to browse to Central Administration, Security, Configure Service accounts and start modifying the accounts used by the services listed. Figure 11-1 displays the SharePoint Health Analyzer recommending that the admin change the farm account . Bad Idea.
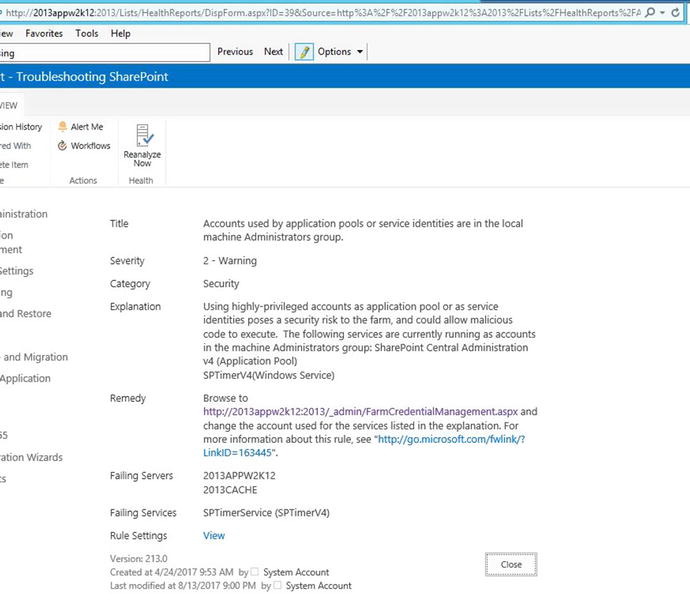
Figure 11-1. Don’t believe everything you read in SharePoint
A better approach in this situation would be to remove the farm account from the local administrators on the two servers, 2013APPW2K12 and 2013CACHE, since the account only needs to be a member of local admins during the installation of SharePoint, and the configuration of Distributed Cache and the User Profile Synchronization service.
The key takeaway from this section is to know your farm and to know what is best for SharePoint, because it clearly does not always know what is best and will sometimes behave like a drunken sailor, making haphazard decisions (e.g., Argh, just change the farm account!). Let’s look at another tool that is very handy when it comes to analyzing SharePoint and its performance, the Performance Analysis Logs tool.
Performance Analysis of Logs (PAL) Tool for SharePoint
The Performance Analysis of Logs (PAL) tool for SharePoint is a great way to analyze your farm and then get back helpful advice on the various metrics that are tracked by the tool. A Racker named Brad Slagle first turned me onto this tool. The tool is downloadable from the CodePlex archive by searching for “PAL” and it is available at its GitHub location at https://github.com/clinthuffman/PAL . Version 2.7.7 of the tool was used in this book. The tool creates a template to be used in the Windows System Performance Monitor (perfmon.msc).
You install the PAL tool on your workstation, and not on the SharePoint server itself, as you can see in Figure 11-2 we are installing the tool so that everyone using the computer can use the PAL.
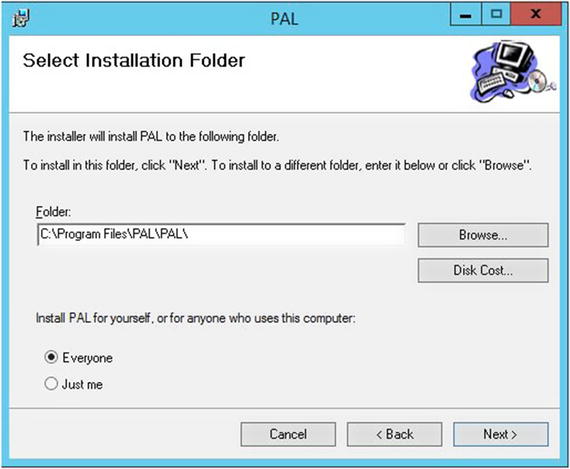
Figure 11-2. Selecting the installation folder
After you’ve installed PAL, you can open it by clicking the PAL Wizard executable (PALWizard.exe). You’ll be presented with Figure 11-3 after you open the program.

Figure 11-3. PAL main page
The next step in gathering the statistics about your farm is to generate the XML file that you’ll use over on your SharePoint farm. Click the Threshold tab, and then click “Export to Perfmon template file …”, as shown in Figure 11-4.
Figure 11-4. Exporting the Perfmon template
Remember where you save the XML file, and then navigate to that location and grab a copy of the XML file. In this example, we named the exported XML file, SharePoint.xml as you can see in Figure 11-5.

Figure 11-5. XML file saved in Pal Collector directory
After you have the XML file, copy it to your SharePoint server. Open the Performance Monitor by typing perfmon.msc on the run bar and clicking OK. Once the Performance Monitor comes open, expand Data Collector Sets, and right-click User Defined. Click New, Data Collector set, as shown in Figure 11-6.

Figure 11-6. New data collector set
Give the data collector set a fancy name, like “SharePoint Data” and make sure to select Create from a template (Recommended), and then click Next, as shown in Figure 11-7.

Figure 11-7. Create new Data Collector Set from template
When you’re facing the “Which template would you like to use?” question, click the Browse button, as displayed in Figure 11-8.

Figure 11-8. Browse to the template you created with PAL
Select the template that you created with the PAL tool after you browse to wherever you copied the XML file on your SharePoint server, as shown in Figure 11-9.

Figure 11-9. PAL XML selected
Click Next, and make a mental note of where the data is going to be saved. You can opt for a different location, at this point if you need to log to a separate drive, for storage reasons, for example. Figure 11-10 shows the option to browse to an alternative storage location for the logs.

Figure 11-10. Where would you like to save the data ?
On the Create the Data Collector Set screen, click the “Open properties for this data collector set”, and then click Finish, as shown in Figure 11-11.

Figure 11-11. Click finish
If you chose the “Open properties for this data collector set” option, the SharePoint Data Collector Set properties window will open. You can now schedule the time that you’d like the collector to run and collect data about your farm, as shown in Figure 11-12.
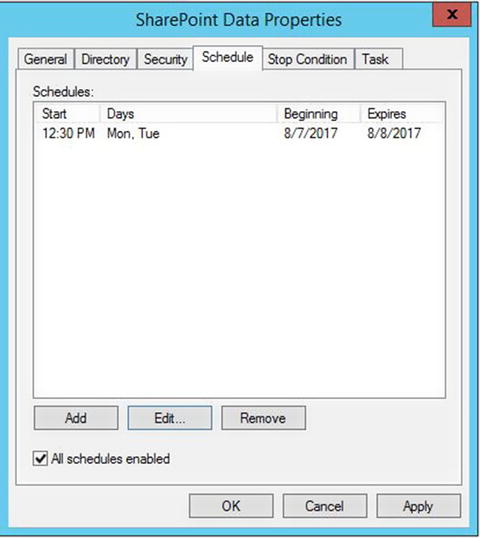
Figure 11-12. Scheduling the collection period
You can always come back to the properties, by double clicking the collector set. The Stop Condition tab is used to tell the collector when to stop. If you want to, you could set the collector to restart every 24 hours, as shown in Figure 11-13.
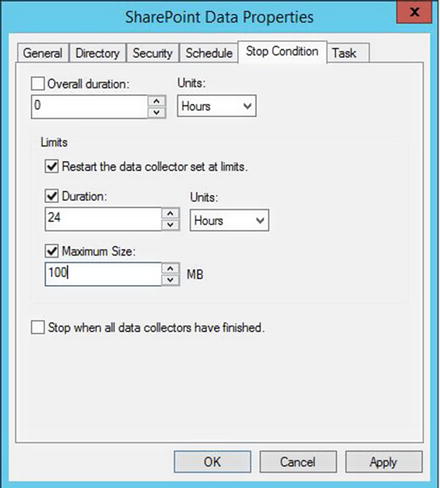
Figure 11-13. Restart every 24 hours
After the collector starts and when it is running, you’ll see the status of running, as shown in Figure 11-14.

Figure 11-14. Running
After the data has been collected on your SharePoint server, you’ll want to copy those files to the machine where PAL is installed. This machine is separate from your SharePoint farm because PAL is resource intensive when it runs to analyze the data. Up until this point, all we’ve done is gather the data, and now we’re going to use PAL to analyze the data.
Now that you’ve copied the .blg file from your SharePoint server to the machine that you’ve installed PAL, open PAL by running the PALWizard.exe and then open the Counter Log tab. Once the Counter Log tab is open, click the ellipsis button and select one of your capture files, as shown in Figure 11-15.
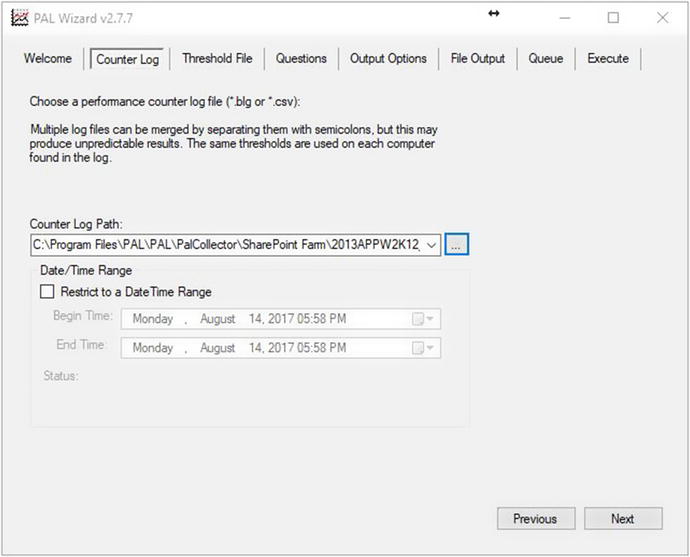
Figure 11-15. Counter Log file selection
Next, click next and then on the Threshold file, click the Auto Detect button, and then click Next, as shown in Figure 11-16.

Figure 11-16. Auto detection has occurred
After you’ve used Auto detection, click Next. When you get to the Questions tab, answer any of the questions that may be different from your system. For example, if your VM has 16GB of RAM, then click Physical Memory and change the default value of 4GB to 16GB. Figure 11-17 shows the default value .

Figure 11-17. Default may not be what you need
Click Next. Then on the Output Options, you can go ahead and leave PAL on the default of every 30 seconds worth of data. Select the “Process all of the counters in the counter log(s)” check box and click Next. This brings you to the File Output. You can leave everything as it is here. What it is telling you is that it will create the PAL Reports directory under you My Documents director of the user that is logged in. Click Next and you are on the Queue tab, go ahead and click Next after you review the Queue tab. The Queue tab is just showing that you can modify the output of the bat file that the ps1 will use to analyze your logs.
Click Next. This brings you to the Execute tab, as shown in Figure 11-18.

Figure 11-18. Click Finish to execute
After you click Finish, your computer will immediately execute the ps1 and the log analysis will begin. You’ll be presented with an image similar to Figure 11-19.

Figure 11-19. Analysis beginning
As the analysis continues, the screen will change as shown in Figure 11-20.
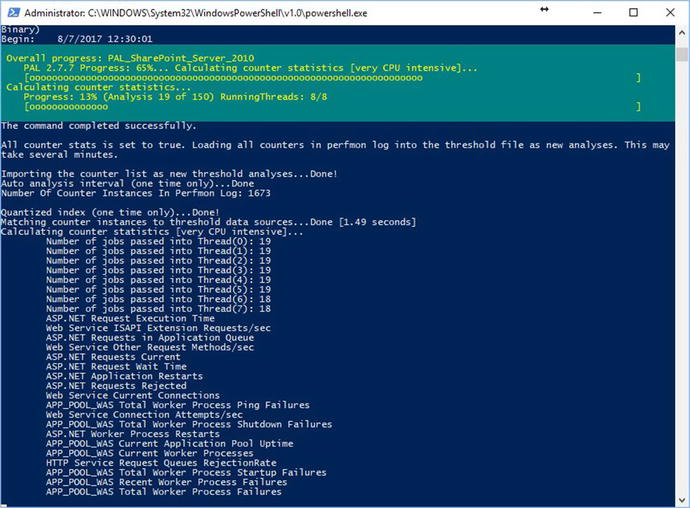
Figure 11-20. Analysis continuing
After the analysis of the log completed, the report will open in your default browser, as shown in Figure 11-21.

Figure 11-21. report
Sections that have data that exceeded a threshold are listed in chronological order and then within each section. So, as you scroll down the top section of the report there are links to each section. For example, in the capture for a SharePoint server there is a section with a bunch of SharePoint links, as shown in Figure 11-22.
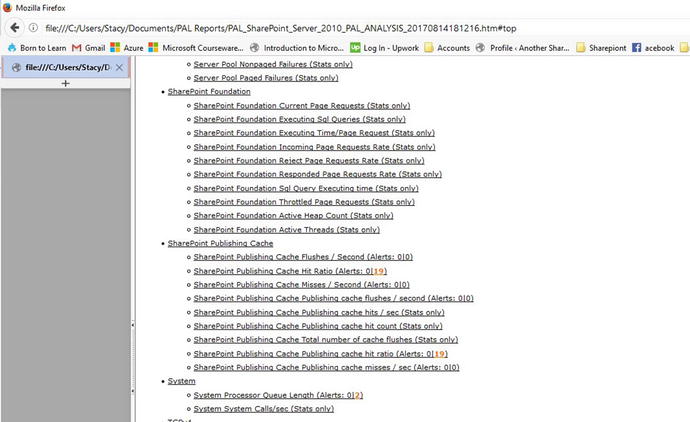
Figure 11-22. to SharePoint metrics
We’re sorry if these last few figures were “eye charts,” or in other words, hard to read. They do display that each metric has a link that will take you to a section on the report that lists any alerts that may be present. Figure 11-23 displays what you’ll see if you click SharePoint Publishing Cache.

Figure 11-23. SharePoint Publishing Cache
Figure 11-23 says, “SharePoint is reliant on cache for high performance . A high amount of cache flushes per second could indicate an approaching problem with lack of memory, a worker process, or poor cache hits.” Any sections that are listed with a white background are sections where no alerts were present, or are the default values for a metric. Sections that are listed with Green OK are good to go. Any alerts with yellow are things to look at, and anything with Red need to be addressed and the root cause investigated. And, this is where the PAL tool shines.
For example, in the data collected, we experienced an alert at 16:20 on 8/7/2017, and in clicking on that alert, the report jumped us to that summary section in the Alerts by Chronological order section. Here we found a display, shown in Figure 11-24.
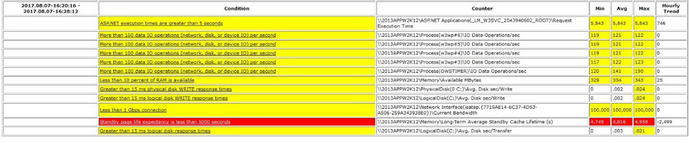
Figure 11-24. Alerts at 4:20
The only red alert listed was “Standby page life expectancy is less than 5000 seconds” and when we click it, the PAL tells us all about it. In this case, the PAL says the following:
Memory Long-Term Average Standby Cache Lifetime (s)
Description: A low Long-Term Standby cache lifetime might indicate a low physical memory condition when correlated with other memory related performance counters such as MemoryAvailable MBytes, MemoryPage Writes/sec, and disk related performance counters such as LogicalDisk(*)Avg. Disk sec/Transfer.
The MemoryLong-Term Average Standby Cache Lifetime (s) performance counter measures the average lifetime in seconds of pages in the standby list cache over a long period of time. A low life expectancy could indicate that the pages on the standby list are frequently used i.e. the system has to replenish the standby list with pages from the modified list (pages that must be written to disk first) and the modified list is replenished by the working sets of processes.
The Standby page list is a list of physical pages that are no longer in use (they are available to be reused), but contain data that already exists on disk. If the data is needed again, then it can be served from the Standby list in physical memory instead of going to disk to get it. Therefore, it is part of the system available memory and it acts as disk cache—the larger the disk cache, the less demand on the disk.
This is trying to tell us that we don’t have enough memory, or maybe some slow disks. Then, when we look back at Figure 11-24, we notice a condition named “greater than 15ms physical disk Write response times.” When we click this link, it takes us to the PhysicalDisk Write Latency Analysis , as shown in Figure 11-25.
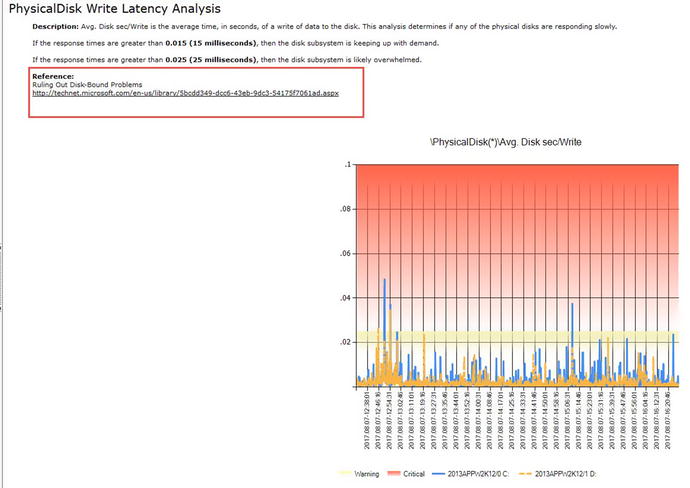
Figure 11-25. Where it shines
Note
All the underlined text in the report are hyperlinks.
In Figure 11-25, we see an example of where PAL shines, in my opinion. That link to TechNet takes you to https://technet.microsoft.com/en-us/library/5bcdd349-dcc6-43eb-9dc3-54175f7061ad.aspx , which is to a page entitled “Ruling out Disk-Bound Problems.” And even though this particular link appears to be somewhat related to Exchange, the rules of disk access and programs with distinct I/O utilization patterns applies to SharePoint, as well, from time to time.
SharePoint Feature Administration and Cleanup Tool
This tool allows you to find orphaned features in SharePoint Lists and Libraries and take action to clean them up. Use this tool with extreme caution. Remember, the best approach to remove features is still to redeploy the solution, deactivate the feature in the site, and then retract the solution from the farm. To download the tool, navigate to its new location on GitHub at https://github.com/achimismaili/featureadmin/tree/master/Releases . Once, there you can find the current release for your version of SharePoint. At the time of this book writing, there were versions for SharePoint 2013, 2010, and 2007. To download this bad-boy, just click one of the versions, and then download the .exe and place it on your SharePoint server.
Make sure to execute the file using the farm account , or an account that has been given access to all of your various web applications and site collections. As you can see in Figure 11-26, the account that I used to install SharePoint does not have full access into everything and it is getting an access denied.

Figure 11-26. Access denied
If you Shift + right-click the .exe, you’ll be able to run it using the farm account credentials and that will give it the access it needs to do its deeds. This tool should really be used as a last resort, when you don’t have the ability to redeploy the solution, deactivate the features, and then retract. In Figure 11-27, we have opened the tool with the farm account , all of the sites are enumerated, there are no access denied messages, and all of the features are looking good!

Figure 11-27. No faulty features
You could use this tool to remove standard OOB features, but I don’t recommend that practice. If you don’t want something deployed, limit the access to who can deploy features. Don’t try to limit SharePoint’s native features, as that will almost surely bite you in the hind region at a later date.
Note
If you take a look at Figure 11-27, notice that it displays the Farm Feature tab and that none of the features show as faulty. There really isn’t a reason to remove a non-faulty feature.
When you’re looking to remove an orphaned feature, you will have usually already found out it’s feature ID from reading a psconfig error log, or possibly from a “Sorry, something went wrong” message. The SharePoint Feature Admin and Cleanup tool allows you to remove a faulty or non-faulty features . Again, I advise against removing non-faulty features. I’ve already mentioned that at this point, we don’t have access to the .wsp that installed the feature.
To remove a feature from a web, site collection, web application , or from the farm, click the “Remove/deactivate features in selected sites”, select the feature you wish to remove, and then select the level on which you to no longer wish have references to. If it has come to the point where you’re using this tool, you should start at the lowest level when removing the feature and then work your way back up to the farm. So, you would remove the feature from the web, then check to see if it is in the site collection, and remove it, and so on and so forth, until you reach the farm level. Figure 11-28 demonstrates how after a feature is selected, the various buttons to remove the feature from whichever scope is illuminated.
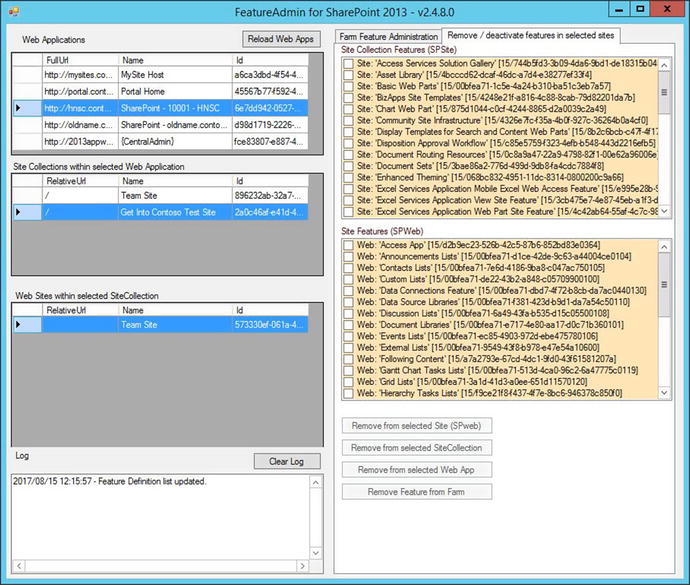
Figure 11-28. Be careful, sharp, sharp knife
After you’ve removed a feature from a particular scope (e.g., web, site, web app, or farm) then you should click the Reload Web App button, which is seen in all of the previous figures.
The SharePoint Feature Admin and clean up tool, can be used for more than clean up. You can use the tool to deploy features across the entire farm. This is much cooler than having to use PowerShell, but I still prefer to use PowerShell, since I feel more in control that way. To use the tool to deploy a feature, just select the feature you’re looking to deploy, from the Farm Feature Administration tab, and then take the available action, as shown in Figure 11-29.

Figure 11-29. More than just removal, you can administrate too!
You can see how many features are installed in your farm using the feature. If a feature has both the Activate and Deactivate buttons illuminated, then that feature is activated somewhere in the farm. You can click the Review Activations of Selected Feature to troubleshoot where a feature is activated, and the location form will open, as shown in Figure 11-30.

Figure 11-30. Links list feature activated
The SharePoint Manager Tool
Another Sharp knife that you can put in your troubleshooting arsenal is the SharePoint Manager tool. It currently is not on GitHub and is available on CodePlex at https://spm.codeplex.com . After you download the app, just extract the entire folder out of the zip file and store it somewhere on your SharePoint server. Then double click the executable named SharePoint Manager 2013.exe, if you’re using the 2013 version, and you’ll see the image shown in Figure 11-31.

Figure 11-31. Preflight checks
After the program scans your farm, it will open and the image shown in Figure 11-31 will disappear. This program is awesomely powerful! And like all sharp knives and powerful tools, it should be used with an ounce of caution. You can very easily change properties within your farm using this tool. It offers a deep view into the object model with drill down capability. The default Object Model View is set to medium for loading. I would venture to guess this is for app performance reasons related to how fast it loads. You can modify the Object model from medium to full from the View menu.
Any properties that appear in bold font can be modified. When you select a node in the left hand pane, the type of object that you have selected is displayed in the bottom information bar. For example, in Figure 11-32, I’ve selected the MySite Host Web application and the information bar says, SPWebApplication.

Figure 11-32. Web application
From the web application properties, there are all sorts of settings that I could manage all at the same time. In Figure 11-32, you can see that I had already adjusted the List View Threshold from the default of 5000 items, up to 6000 items. We can also see that nothing has been changed in Figure 11-32 because the ability to save changes is not illuminated. After a change has been made, the ability to save the change, save all changes, or remove all changes become highlighted, as shown in Figure 11-33.

Figure 11-33. Save changes
After the changes are saved, the screen updates and the information bar displays Changes is Saved, which means the changes are saved. Figure 11-34 shows that the List View Threshold has been changed back to 5000.

Figure 11-34. MaxItemsPerThrottledOperation is List View Threshold
The SharePoint Manager tool is easy to navigate if you follow your understanding for how SharePoint is logically organized . For example, you know that web applications store site collections and that the object model refers to site collections as sites. You also know that the object model refers to subsites as webs; so, it would make sense that to find a subsite, or web as it’s referred to in the object model, that you would need to drill down into the web applications, then the site collections, and finally into the web object. As you can see in Figure 11-35, it would appear that the top site for the Get Into Contoso site collection is an SPWeb object named Get Into Contoso Test Site.
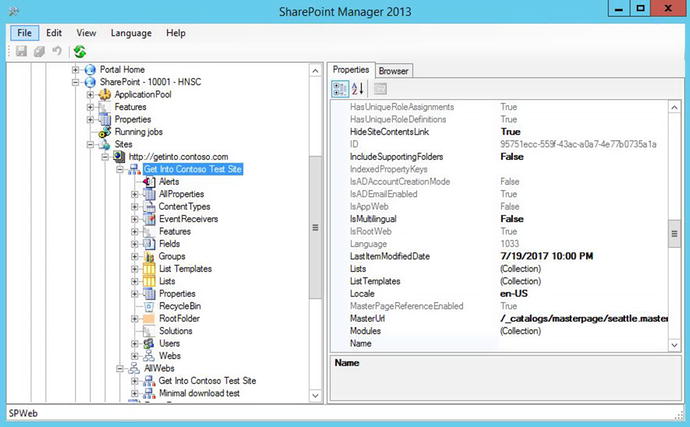
Figure 11-35. SPWeb
Be careful when using this tool to modify because even though a lot of the properties that you shouldn’t modify are grayed out, there are still properties that may not take so kindly to being modified.
Wrap Up
Like a bug’s life when hitting the windshield of a moving car, the discussion of troubleshooting has ended. I hope you’ve gained some useable info from these last three chapters that you can use to troubleshoot issues within your farm. Not every problem can be solved. Sometimes the server and/or the farm is damaged to a point of no return, other than a full rebuild. And, sometimes the data within the content databases tables has been modified in such a way that the very act of mounting the database to a new farm can corrupt said new farm. The remedy in that case is usually a site collection by site collection backup and restore.
There fortunately, and unfortunately, isn’t a one size fits all for every SharePoint issue. I say fortunately because this keeps people like you and I employed and I say “unfortunately” because it sure would make our lives easier if there was such a thing. My friends Mike Ross and Mike Clarke , fellow Rackspace SharePoint engineers would say, “It’s built in Job Security” and they’re right! And, sometimes it’s quicker and a much more solid remedy to rebuild, patch to the correct level, and attach databases or restore site backups, than it is to try and hack an issue out of a farm. If you find where someone else had the exact same error that you’re experiencing, with the only difference being the GUID, it’s a safe bet to follow the steps. And, anytime you can re-create the issue in a non-prod environment, before attempting the fix in production, you should take that route.
It’s a good idea to refresh your test farm with the databases that are experiencing the issues in production and keep the test farm configuration, not data, the same as production. I say “not data” because there really isn’t any reason to keep all the data twice; after all, SQL is not free. Having an environment that has similar workflows, or the database freshly refreshed from production, will give you a fairly solid expectation as to whether or not your fix for whatever issue will be successful.
I hope reading this book has given you a deeper insight into the labyrinth that is Microsoft SharePoint. May the SharePoint gods shine down on you and best of luck to you in all you do!