Save and Share Data Tables
JMP saves data tables in the formats listed in Table 10.1.
Here are the basic steps for saving a data table:
• On Windows, select File > Save As to save in multiple formats.
• On Macintosh, select File > Save As to save as a JMP file (.jmp). Select File > Export to save in Text (.dat), Microsoft Excel (.xls), SAS Transport (.xpt), and SAS Data Sets (.sas7bdat) formats.
Note: To save a data table as a journal or layout, select Edit > Journal or Edit > Layout and then File > Save As.
In addition to these file types, JMP can save files for types that have a corresponding ODBC driver. See “Save Data Tables to a Database”, for details. Note that for Macintosh, the Excel ODBC driver is required for exporting to Excel.
|
File Type(s)
|
Extension
|
OS Availability
|
|
JMP Data Table
|
.jmp
|
All
|
|
Excel Workbook
Note: For Macintosh, due to a limitation of the Open Database Connectivity (ODBC) driver, each cell must contain no more than 255 characters. Additional characters do not show up in the data table. To prevent this issue, divide the 255 characters into two or more cells.
|
.xls
.xlsx
|
All
Windows (without ODBC)
Macintosh (with ODBC)
|
|
Text Export File
|
.txt
|
All
|
|
SAS Data Set
|
.sas7bdat
|
All
|
|
SAS Transport File
|
.xpt
|
All
|
|
dBASE Files
|
.dbf, .ndx, .mdx
|
Windows
|
The maximum length of the data table’s name depends on your computer’s operating system. See your operation system documentation for details.
Note: JMP tries to save any modified files when a crash is detected.
Save as a CSV File
JMP can convert data from a JMP data table to a comma-separated values (CSV) file. To save a data table as a CSV file:
1. With the specific data table open in JMP, select File > Save As.
2. Select CSV (Comma delimited) (*.csv) from the Save as type drop-list.
3. Enter the File name.
4. Select the location for the CSV file.
5. Click Save.
Save as a Text File
JMP can convert data from a JMP data table to standard text format with rows and columns. To save a data table as a text file, follow the steps in Table 10.2 based on your operating system and how you want to save the file.
|
Windows
|
1. Select File > Save As.
2. Select Text Export File from the Save as type list.
3. Click the Options button and specify end-of-line and end-of-field characters, and choose whether to export column headings as text.
4. Click OK.
5. Click Save.
An alert appears regarding loss of formulas, formatting information, and other metadata.
6. Click Yes.
|
|
Macintosh
|
1. Select File > Export.
2. Select Text and click Next.
3. Enter a name for the file in the Save As box and change the extension to .txt.
4. Specify end-of-line and end-of-field characters, and choose whether to export column headings as text.
5. Click Export.
|
Text formatting options are:
• Export Column Names to Text File To save column headings in the first line of text, and to save labels or header information with the data, select Export Table Headers.
• End of Field Select the radio button next to the character that marks the end of a field (or cell). Select Other and enter a character if the appropriate character is not listed.
• End of Line Select the radio button next to the character that marks the end of a line (or row). Select Other and enter a character if the appropriate character is not listed.
Note: If double quotation marks are found when importing text data, the delimiter rules change, and JMP looks for an end double quotation marks. Other text delimiters, including spaces embedded within the quotation marks, are ignored and treated as part of the text string.
Save as a SAS Transport File
You can save a JMP data table in SAS transport file format. JMP replaces spaces in filenames and column names with underscores, converts column headings to uppercase SAS variables, and makes other changes to follow the transport file specifications.
When you save the data table as a transport file, you can opt to append it to an existing transport file. When you reopen the transport file in JMP, the two data tables open in separate windows.
Note: The maximum length for the filename is 32 characters. JMP warns that characters beyond that limit are omitted.
Windows
1. Select File > Save As.
2. Select SAS Transport File from the Save as type list.
3. (Optional) Append the data table to an existing SAS transport file. Select the file to which you want to append the data table, and then click the Save arrow. Select Append To, and then click Yes to replace the selected data table.
An alert appears regarding loss of formulas, formatting information, and other metadata.
4. Click Yes.
Alerts appear regarding other SAS format modifications.
5. Click OK on each alert.
Macintosh
1. Select File > Export.
2. Select SAS Transport.
3. (Optional) To append the data table to an existing SAS transport file, select the Append check box.
4. Click Next.
5. Do one of the following:
‒ If you chose to append the data table, select the file to which you want to append the data table and click Append.
‒ Enter a name for the file in the Save As box, and then click Export.
Alerts appear regarding SAS format modifications.
6. Click OK on each alert.
Save as a SAS Data Set
You can save data tables as SAS version 6 and higher data sets. JMP writes columns as SAS variables, writes rows as SAS observations, and makes other changes to follow the SAS data set specifications.
When you export data to a SAS data set, JMP date columns become SAS date values with the appropriate SAS format.
Windows
1. Select File > Save As.
2. Enter a name for your file in the File Name box. The maximum length for the filename is 32 characters. JMP warns that characters beyond that limit are omitted.
3. Select SAS Data Set from the Save as type list.
4. (Optional) To save SAS variable names or SAS formats, select the Preserve SAS column names or Preserve SAS formats check boxes.
5. (Optional) To store JMP metadata (such as, column and table properties) as extended attributes for SAS 9.4, select Store table and column properties in SAS 9.4 extended attributes.
6. Click Save.
An alert appears regarding loss of formulas, formatting information, and other metadata.
7. Click Yes.
8. If other alerts appear, click OK on each alert.
Macintosh
1. Select File > Export.
2. Select SAS and click Next.
3. Enter the filename and select export options.
Honor Excluded Rows exports rows with the Excluded row state. The other options are described in the preceding section.
Save as a Microsoft Excel File
You can save a JMP data table in Microsoft Excel format.
Note: The maximum length of the Excel filename is determined by your computer’s operating system.
Windows
1. Select File > Save As.
2. Select Excel Workbook (*.xlsx, *.xls).
3. Enter a name for your file in the File Name box.
4. Click Save.
Macintosh
Note: To save *.xlsx files, an Excel ODBC driver must be installed on your computer. The document is saved in the format that is specified in the ODBC driver properties. 64-bit JMP requires a 64-bit ODBC driver.
1. Select File > Export.
2. Select Excel.
3. Click Next.
4. Enter a name for the file in the Save As box.
5. Click Export.
Save Data Tables to a Database
You can save a data table to any database on your system that has a compliant ODBC (Open DataBase Connectivity) driver:
1. Select File > Database > Save Table. Figure 10.1 shows the window that is initially displayed.
Figure 10.1 The Database Save Table Window
2. In the Connections box, highlight the name of the database to which you want to save the file. The Connections box contains a list of databases to which your system is connected.
If you are not connected to the needed database, create it by using another application, or see “To add a new database connection:”.
3. From the JMP data table to be saved menu, select the open JMP data table that you want to save to the database.
4. In the Save to database table box, enter the name that you want the table to have when you save it in the database.
5. Click Save Table.
To add a new database connection:
1. Click Connect.
2. Select the data source that you want and click OK. Or, to create a new source, click the New button (Windows) or Add button (Macintosh).
Depending on which data source you select (and which database drivers you have installed on your computer), you might be presented with a variety of windows. Use them to create the database source.
3. Select the database to which you want to save the file.
Replace a Database with a Data Table
To replace a database with a data table:
1. Select File > Database > Save Table.
Figure 10.1 shows the window that is initially displayed.
2. In the Connections box, select the name of the database to which you want to replace the file. The Connections box contains a list of databases to which your system is connected.
If you are not connected to the needed database, create it by using another application, or see “To add a new database connection:”.
3. In the Schemas - Tables box, select the database table that you want to replace.
Note: Remember the name for the database table. You will use this same name for the replacement database table.
4. Click Drop Table.
The database table is deleted from the database.
5. From the JMP data table to be saved drop list, select the JMP data table you want to save to the database.
6. In the Save to database table box, type the name for the deleted database table.
7. Click Save Table.
The data table is saved to the database.
8. Click Disconnect.
9. Close the Save Database Table window.
E-mail a Data Table
On Windows, you can e-mail a JMP data table by selecting File > Send. Your default e-mail application opens with the data table file attached to a new e-mail.
Save and Share Reports
To save a report, select File > Save As.
• On Windows, you can save the report as any of the file types listed in Table 10.3.
• On Macintosh, the report is saved as a JMP report (.jrp). If you want to save the report as a text, image, HTML, or RTF file, select File > Export. Supported image files include .eps, .png, .svg, and .tiff.
|
File Type
|
Extension
|
Description
|
|
Microsoft Word
|
.doc
|
Word processing format; mixture of pictures, text, and tables.
|
|
Enhanced Metafile
|
.emf
|
Can contain both vector and bitmap components.
|
|
Encapsulated PostScript File
|
.eps
|
Line drawing (or vector image) that can show a bitmap preview of the image.
|
|
CompuServe Graphics Interchange Format
|
.gif
|
Compressed bitmap pictures.
|
|
Hypertext Markup Language
|
.htm, .html
|
Browser format; marked up text and references to separate picture files. Save pictures within the HTML file by selecting one of these formats: PNG, JPEG, SVG, or GIF.
|
|
Interactive HTML
|
.htm, .html
|
Saves the data, reports, and graphs in an HTML 5 web page, so non JMP users can explore the data. See “Save the Report as Interactive HTML” for more information.
|
|
Joint Photographics Expert Group
|
.jpg
|
Compressed bitmap pictures; standard for photographs. See “Setting the DPI”.
|
|
JMP Journal
|
.jrn
|
Analysis report duplicated in a separate window titled Journal. You can edit it or append other reports to it.
Note that on Macintosh, select Edit > Journal, and then File > Save. On Windows, choose File > Save, and then choose the journal format.
|
|
JMP Report
|
.jrp
|
Analysis report originally created in JMP. It can be reopened for continued analysis.
|
|
Portable Document Format
|
.pdf
|
Format for sharing documents regardless of the operating system or application in which they were created.
|
|
Portable Network Graphics
|
.png
|
Compressed bitmap pictures; successor to GIF. See “Setting the DPI”.
|
|
Rich Text Format
|
.rtf
|
Word processing format; mixture of pictures, text, and tables. Save pictures within the RTF file by selecting one of these formats: PNG, JPEG, or EMF.
|
|
Scalable Vector Graphic
|
.svg
|
Pictures stored as text; best used for two-dimensional graphics.
|
|
Tagged Image File Format
|
.tiff
|
Raster file format. See “Setting the DPI”.
|
|
Text Format
|
.txt
|
Plain text format; no pictures.
|
E-mail a Report
On Windows, you can e-mail a JMP report by selecting File > Send. Your default e-mail application opens with the report file attached to a new e-mail. Note that the report must be saved before you can e-mail it.
Save the Report as Interactive HTML
Interactive HTML enables you to share JMP reports that contain dynamic graphs so that even non JMP users can explore the data. The JMP report is saved as a web page that includes interactive HTML 5 features. Users then explore the data as they would in JMP.
Interactive HTML provides a subset of features from JMP:
• Explore interactive graph features, such as selecting histogram bars and viewing data values.
• View data by brushing.
• Show or hide report sections.
Figure 10.2 Brushing Data in Interactive HTML
Many changes that you make to the graphs, such as ordered variables, horizontal histograms, background colors, and colored data points, are saved in the web page. Graphs and tables that are closed when you save the content remain closed on the web page until the user opens them.
Interactive HTML Contains Data
When you save reports as interactive HTML in JMP, your data are embedded in the HTML. The content is unencrypted, because web browsers cannot read encrypted data. To avoid sharing sensitive data, save your results as a non-interactive web page. (Select File > Save As > HTML File on Windows, or File > Export > HTML on Macintosh.)
To create interactive HTML:
1. In JMP, create the report.
2. On Windows, select File > Save As and select Interactive HTML with Data from the Save as type list. On Macintosh, select File > Export > Interactive HTML with Data.
3. Name and save the file (or export on Macintosh).
The output appears in your default browser.
Which Reports are Supported
When you save a report as interactive HTML, the Save Report As window warns when one or more features in the report are not supported.
• If the contents are fully supported, output is created with no warnings.
• Partially or unsupported features are still saved in an HTML 5 web page. When you place your cursor over an unsupported feature, a tooltip states that the feature is not yet interactive.
For information about exploring interactive HTML output, visit http://www.jmp.com/support/help/InteractiveHTML/ShareJMPReports.shtml.
Save as Flash
Certain types of reports can be exported into Flash and saved as a .swf file. You can embed .swf files into Microsoft PowerPoint presentations.
The following platforms support Flash output:
• Distribution
• Profiler
• Bubble Plot
For details, see http://www.jmp.com/support/swfhelp/en/.
Setting the DPI
On Windows, if you are saving the report as a PNG, TIFF, or JPG file, you can set the DPI to either Default or 300. The Default option uses the default setting of your operating system. Select Always use this setting if you want to retain your choice within this session and across multiple JMP sessions.
Save Your Analysis as a Script
After completing an analysis and receiving a report, you might want to save the process that you used to arrive at the report as a JSL script. You can save the script inside the data table, inside the report, or in a separate script window. To do this, click the red triangle menu in the report title and select Script. Then select the Save Script option that you prefer. See “Script Menus”.
Non-English versions of JMP can save scripts in either English or your local language. See “General” in the “JMP Preferences” chapter.
Save Using the Layout Command
You can edit or manipulate the report before you save, enabling you to combine several reports into one or rearrange the report elements. You do this by selecting Edit > Layout. Using this command is different from using the Edit > Journal command; the Layout command provides additional options that let you ungroup parts of a report and restructure it to best fit your needs.
To create a layout:
1. Select Edit > Layout. (Or hold down the CTRL key and press L.)
The report window is duplicated in a separate window titled Layout.
In the Layout window, the Layout menu appears between the Edit menu and the Tables menu. Items in the Layout menu are available only when you select an item with the arrow tool.
2. Click inside the layout window. The entire report becomes highlighted. To show the Layout menu, place your cursor over the bar at the top.
3. Select Layout > Ungroup, or right-click (hold the CTRL key and click on Macintosh) inside the report and select Ungroup.
This performs the first stage of ungrouping report elements, which ungroups (or disconnects) the topmost title bar from its reports and subreports. Each time you ungroup a report outline level title from its reports, the disclosure button for that level disappears and you can no longer close it. However, you can do many of the surface operations available, use the context menu in plots, customize axes, rerun the analysis in a new window, edit scripts, and so on.
4. Select Layout > Ungroup again to ungroup the next level of the report outline. Note that only selected items are ungrouped.
5. Continue to select specific report elements (or all elements) and ungroup them until each title and each piece of a report or plot is an object.
Note: You can ungroup a report from its title bar and ungroup all of its major pieces, but you cannot ungroup a column in a report table from its column heading.
6. Click an object to select it and move it anywhere in the layout window. The layout window has as many pages as you want, outlined with gray boundary lines.
7. Select File > Save As. JMP saves the file as a journal file (.jrn).
Table 10.4 describes other layout options.
|
Action
|
Instructions
|
|
Edit a title bar
|
Double-click the title bar or report table column heading.
|
|
Quickly ungroup a layout to its smallest objects
|
Repeatedly press CTRL and U.
|
|
Rerun the report in a new window
|
Click the red triangle menu on the title bar and select Rerun in new window from the menu.
|
|
Edit a script
|
Click the red triangle menu on the title bar and select Edit Script from the menu.
|
|
Access Layout menu items (on the main menu bar)
|
Select the arrow cursor.
|
|
Insert a page break
|
This feature applies only to windows that you can print (journals and reports).
|
|
Select and deselect items
|
Right-click a disclosure button (
|
The example in Figure 10.3 shows results combined and organized from a bivariate analysis, distribution analysis, and one-way analysis (means and t-test). The result shows a summary of oxygen uptake as a function of run time in an exercise experiment. This was done by forming a layout window for one analysis, dragging the other desired analysis elements into the layout window, arranging the desired pieces, and deleting unwanted elements.
Figure 10.3 Multiple Analysis Results in a Layout Window
Save Parts of a Report in a Graphic Format
You can save part of an analysis report window as a graphic. On Windows, you can save the selection in .png, .jpg, .gif, .eps, .emf, .pdf, .tiff, and .svg formats. On the Macintosh, you can save the selection in .png format.
To save a selection:
1. Click the selection tool ( ).
).
2. Highlight the area that you want to save.
3. On Windows, select Edit > Save Selection As. On Macintosh, hold down the CTRL key and select File > Save Selection As.
The Save Selection As window appears.
Figure 10.4 Save Selection As Window
4. Enter the File name for the graphic.
5. Select the graphics file format type to which you want to save the selection. See “Save and Share Reports”.
6. Select the Image DPI Setting as either Default (72) or 300.
Tip: You can configure the default DPI setting selection in Windows Specific preferences.
7. To keep your selected DPI Setting for the current session, select Always use this setting.
8. Select Select this filter the next time this window is invoked to save your file type selection for the current session.
Note: If you cannot see the Select this filter option, select a folder location for saving the graphic file.
9. Click Save.
Print Reports
To print the report in the active window, select File > Print. This command displays the standard window for printing. The appearance of the window depends on your operating system and printer driver.
To insert a page break for printing purposes:
1. Right-click the disclosure button  in the report window.
2. Select Edit > Page Break.
Copy and Paste Reports
When you need to use JMP reports or data tables in another program, you can copy and paste or drag and drop parts of a report or table into another program, such as Microsoft Word or PowerPoint. Then save the document in that application.
1. Click the selection tool .
2. Click and drag (or hold down the SHIFT key and click) to select items in a report window or data table. Clicking near the edge of the report window selects the entire report.
3. Click the selected items and drag them from JMP to the other program. Or, copy the selected items in JMP and paste them into the other program. When you paste an element into another application, the format used depends on the application into which you paste. If the application has a Paste Special command and you use it, you can select a format to use, such as text (.rtf), unformatted text (.txt), bitmap (.bmp), or Enhanced Metafile (.emf).
Note the following actions:
• To copy all text (no graphs) from the active report window as unformatted text, select Edit > Copy As Text. On the Macintosh, press the SHIFT key and select Edit > Copy As Text.
• To copy a graph, which includes labels and axes, right-click the graph and select Edit > Copy Graph.
• To copy anything other than a graph, right-click and select Edit > Copy Picture. For example, to copy a report, right-click on the bar containing the report title and select the option.
JMP Journals
Journals consist of JMP graphs and reports, graphics, text, and links to items such as Web pages and files. Using journals has several advantages:
• Journals let you save relevant graphs and reports and then arrange the content as you want.
• Journals let you store information for presentations. You can then edit and interact with the content as you would in JMP (such as scrolling an axis or changing marker sizes). This interactivity is not available in a slide presentation. See “Example of Making a Journal for a Presentation” for details.
• Journals are an intermediate format to export to Microsoft Word, HTML, and other formats.
• Journals also let you store data tables and reports from a session, close and reopen JMP, and then open the journaled files instantly.
You can create a journal that groups items under headings (or outline levels). To close the groups, click the gray disclosure icon next to the heading.
Figure 10.5 shows some of the items that you can add to a journal.
Figure 10.5 Example of a Journal
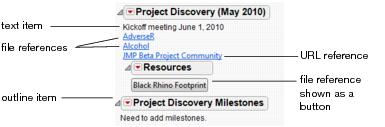
Note: Links to directories of files, windows, and all open files look like other links, so they are not included in the preceding figure.
Create a New Journal
1. Close all open journals, and do one of the following:
‒ To create an empty journal, select File > New > Journal. Or, from the JMP Starter window, select New Journal.
‒ To create a journal from an entire report or data table, select Edit > Journal.
‒ To create a journal from a specific report or text in a report, click and drag the Selection () tool to select adjacent items in a report or data table. To select discontinuous items, press SHIFT and click the items with the Selection () tool. Then select Edit > Journal.
‒ To create a journal from specific text in a data table, select the text, and then select Edit > Journal.
‒ To create a journal from most graphs, right-click on the graphic, and then select Edit > Journal. (Not available for surface plots and 3-D scatterplots.)
‒ Write a JSL script to create a new journal. See the Scripting Guide for more information.
Tip: If you prefer keyboard shortcuts, hold down CTRL (Windows) or COMMAND (Macintosh) and press J to create the new journal.
2. Select File > Save and save the journal in .jrn format.
Prevent Modifications
When a journal is opened, and then journal another report or data table, the second report or data table is added to the end of the first journal.
To prevent modifications to a journal, right-click the blank area at the bottom of the journal and select Lock. Additional reports are not added to the journal (as described in the following section). JMP instead finds an open unlocked journal or creates a new journal when you select the Edit > Journal command again.
To unlock the journal, right-click the blank area at the bottom of the journal and deselect Lock.
Alternatively, place separate reports in separate layout windows by using the Layout command, as described in “Save Using the Layout Command”.
Append Reports to a Journal
To append other reports to a report that you already journaled, select Edit > Journal again. If an area of an analysis window is selected, Edit > Journal saves only the selected area instead of the entire window.
When manipulating the report, remember that:
• The journal window has the same functions as the report window: you can click icons, click and drag, and right-click to access menus.
• When a report is journaled, the journaled copy is no longer connected to the data table.
Add and Edit Outline Levels
You can group text and links in an outline level and then click the gray disclosure icon to expand and collapse the group.
Note: Links to files have absolute paths. If you move the journal to another location on your computer, the links continue to work. When adding links to files in the JMP sample data folder, use the pathname $SAMPLE_DATA/xx. xx is the absolute path from the sample data directory. (Right-click the link, select Edit > Set Script, and then edit the path.)
• To add an outline level, right-click in the journal, and then select Append Item > Add Outline Item. You can also add nested outline levels to outline levels that you have created. (When you click the red triangle menu of a graph that you have journaled, the Add Outline Item option is unavailable.) Click the outline level’s red triangle menu and select Add Outline Item.
• To edit the outline level heading, double-click the heading, enter the new name, and press Enter.
• To add text or links within an outline level, click the outline level’s red triangle menu and select an option described in Table 10.5. Note that these options are not available when you click a scripted item’s red triangle menu.
• To add text or links outside an outline level, right-click on the journal and then select one of the options described in Table 10.5.
• To edit a link, right-click the link, select Edit > Set Script, edit the path, and then click OK.
• To edit the name of the link displayed in the journal, right-click the link, select Set Button Name, enter the new name, and then click OK.
Tip: In Windows, show the preceding options by holding down the ALT key and right-clicking the outline level’s gray disclosure icon.
|
Add Outline Item
|
Groups text and links into collapsible and expandable lists.
|
|
Add Text Item
|
Enter up to six paragraphs with the option to add a bullet or hide the text. To unhide, right-click the hidden text and deselect Hide.
Note: To add text outside an outline level, you can also double-click at the end of the journal and enter text in the box that appears. Click outside the box to exit the editing mode.
|
|
Add Window Reference
|
Creates a link to a window already opened in JMP.
|
|
Add File Reference
|
Creates a link to a file on your computer.
|
|
Add Directory of Files
|
Creates links to all files (including non-JMP files) in the selected directory.
|
|
Add All Open Files
|
Creates outline levels and links to open files in JMP (except for the log). For example, a link to the open Big Class.jmp data table and chart is displayed below a collapsible heading named Big Class. Files such as journals, scripts, and tutorials are grouped below a collapsible heading called Other Files.
|
|
Add URL Reference
|
Creates a link to files that are delivered through an Internet protocol such as HTTP, FTP, or FILE://
|
|
Add Script Button
|
Creates a link to a JSL script.
|
Control the Display of Outline Levels
You can instantly control which outline levels are displayed (for example, closing all sublevels below the selected level). Click the red triangle menu for that level, select OutlineBox, and then select one of the Open or Close commands. For details about the Open and Close commands, see “Access Report Display Options” in the “JMP Platforms” chapter.
Tip: On Windows, show the OutlineBox options by holding down the ALT key and right-clicking the outline level’s gray disclosure icon.
Add a Graph or Graphic
Do one of the following:
• Copy a graph from within JMP or a graphic from another application and then select Edit > Paste. JMP places the graphic at the end of the journal.
• Drag and drop the graph or graphic from another window to the journal. (See “Add Graphics” in the “JMP Platforms” chapter.) A blue line indicates where you can drop the graphic.
Customize Journal Items
• To click and drag journal items to different positions, select the selection tool (), select the item, and then drag the item to the new position. A line indicates where you can drag the item.
• To adjust text wrapping, right-click the text and select Set Wrap. Enter the number of desired pixels per line and click OK. To apply the wrap to all text items, select Set Wrap, select Extend this to other text boxes, and then click OK.
• To modify a plot axis, double-click or drag the axis. See “Customize Axes and Axis Labels” in the “JMP Platforms” chapter.
• To add text or shapes anywhere in the report, use the drawing tools (Annotate, Line, Polygon, and Simple Shape). For details about the drawing tools, see “Add Graphics Elements to a Report” in the “JMP Platforms” chapter.
• To resize plots and graphs, do one of the following:
‒ Click and drag the edge.
‒ Right-click the plot or graph, and then select Size/Scale > Frame Size. See “Resize Plots and Graphs” in the “JMP Platforms” chapter.
Save the Journal in Another Format
You can save a journal in another format (such as HTML or PDF). When you save the journal as HTML, buttons and links are active when the file is viewed in a Web browser.
Note: The header and footer defined in your printer setup appears in the PDF file. However, you can set the left, center, and right header and footer in a JSL script. For more information, search for the Set Print Footers message in the JMP Scripting Index. (Select Help > Scripting Index in JMP.)
Windows
1. Select File > Save As.
2. Select the format. See “Save and Share Reports”.
3. Click OK.
Macintosh
1. Select File > Export.
2. Select the format. See “Save and Share Reports”.
3. Click Next.
4. Enter a name for the file in the Save As box.
5. Click Export.
Print a Journal
Select File > Print.
Delete Items from a Journal
1. Click the selection tool ().
2. Select the item that you want to delete and press DELETE.
Example of Making a Journal for a Presentation
Most people use a presentation application like PowerPoint to give presentations. With JMP journals, you can avoid using a presentation application: all your bullet points can be combined with live links and buttons to help automate the analyses that you want to show. Interactivity is also maintained in reports.
Follow this example to create a presentation using a journal.
1. Select File > New > Journal.
2. Right-click in the journal. Start your outline by selecting Add Outline Item.
3. Enter the title of the presentation “My Bivariate Demo.”
Figure 10.6 Add an Outline Item
A presentation should have outline nodes, which are nested, opened, and closed in sequence, as you give the presentation.
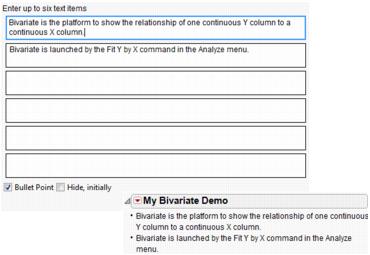
4. Add bullet points into the outline by clicking the red triangle in the My Bivariate Demo title bar and selecting Add Text Item.
5. Type the text shown in the following figure.
6. Select the Bullet Point check box and click OK.
Figure 10.7 Add Text Item
Now add a window reference as a link. These links lets you open a file with one click during the presentation.
7. Open the Big Class.jmp sample data table.
8. Click the red triangle in the My Bivariate Demo title bar and select Add Window Reference.
9. Select Big Class and click OK.
Figure 10.8 Add Window Reference
10. Click the window reference to verify the link.
11. Display the window reference as a button by right-clicking the link and deselecting Underline Style.
Figure 10.9 Change the Link to a Button
Save JMP Sessions
Each time you use JMP is called a session. A saved session is a JSL script that re-opens documents and re-runs analyses to restore JMP’s state when the session script was saved. A saved session can help get you back to a previous state without having to manually re-open files and re-run analyses.
If you are an advanced user, it is important to understand what session information is preserved in a saved session. Any documents (such as data tables, scripts, and journals) that have been saved are re-opened. JMP windows that support script saving are re-run (equivalent to clicking the red triangle in a report and selecting Script > Redo Analysis). Side effects of running scripts, such as global variable values or custom windows, are not saved. The state of highly interactive analyses is also not saved.
Save Sessions Upon Exiting
The most common use of saved sessions is to save the state when JMP exits so it can be restored when JMP restarts. By default, JMP asks whether you would like to save the state of your session each time you exit the program (Figure 10.10). This enables you to quit JMP, and then return to it later without having to open the files with which you were previously working.
Figure 10.10 Saving Session Upon Exiting
To always save the session upon exiting, select Do not ask me again about saving the session and click Yes or No. This option also prevents JMP from saving the session upon exiting,
You can change this option later in Preferences:
1. Choose File > Preferences.
2. Select the General icon.
3. Next to the Save the session when exiting option, choose when you want JMP to save the session. Always, never, and prompt whether you want to save are the options.
Save Sessions Manually
You can also save a session to a location of your choosing and continue working, so you can restore the saved state whenever you like. Manually saving sessions is useful when you want more control of session saving and restoring. This option is especially helpful when you want to maintain multiple independent session states, each with a different set of files and analyses.
To create a script of a JMP session:
1. Select File > Save Session Script.
2. Enter the name of your script in the window and click Save.
Another way of manually saving a session is by creating a journal of each session. A journal can be a notebook-style or project-style file. With it, you can collect references to files in a project, develop presentation launch pads, document projects, and store many scripts in one place. See “JMP Journals” for details.
To create a journal of a JMP session:
1. Open the files that you would like to include in the journal.
2. Select File > New > Journal. Or, to append your open files to an existing journal, open that journal.
3. Right-click in the empty journal and select Add All Open Files.
JMP Projects (Windows Only)
A JMP Project is useful when you want to save multiple JMP file types (data tables, reports, scripts, or other JMP supported formats) into a single file. The single JMP project file contains everything needed to re-open all the included files. This is its major difference from saved session scripts. The scripts save the state of the software and the projects save the state along with the files.
Projects can also include non-JMP documents (such as Microsoft Word or Adobe PDF files). This option lets you group and quickly open files.
Note: Though you can script and open projects on Macintosh, this section only covers working with projects on Windows.
Create a JMP Project
To create a new project, click on the black book icon in the Projects pane. Or, select File > New > Project. The new project appears in the Projects pane of the JMP Home Window. If the Projects pane is closed, the Project window appears instead.
Figure 10.11 JMP Home Window with Projects Pane
To name the project, right-click the project name, select Rename, enter the name, and then press ENTER.
Save a JMP Project
After you create and name a project, save it using one of the following methods:
• Right-click the project name in the Projects window and select Save “project name”.
• Select the project name and click the Save Selected Project button on the Projects window toolbar.
• In another open JMP window (such as the JMP Home Window), select File > Save Projects.
When you save a project, JMP creates a compressed file with the .jmpprj extension and saves a copy of each item in the project. You actually modify the archived items rather than the originals. Other JMP users on Windows and Mac can then open the project on their computers, and the links remain intact.
JMP maintains the links by creating a folder structure that mirrors the location of the original files. Say that you save a project in the following folder:
C:MyProjects
The project has a link to the MyDataTables folder.
When you open this project, JMP creates the following file structure in the project’s subdirectory:
C:MyProjectsProject Name DependenciesCMyDataTables
At times, you might want to continue to modify the original files rather than the archived copies. Here are some examples:
• When you add a file to multiple projects, you are actually modifying three different copies of that file. If sales figures in one of the files need to be updated, you must update three different copies of that file.
• When you add files to a project from a network drive, you and other JMP users can edit those files without having to open the JMP project file.
In these instances, turn off archiving by right-clicking the project in the Projects window and deselecting Archive all files and folders when project is saved.
When you save a project, JMP notifies you when files in the project archive are not found. See “Fix Broken Links” for details about fixing the links.
Close a JMP Project
To close a project, right-click the project name and select Close.
Open a JMP Project
On Windows, open a project by selecting File > Open and selecting JMP Projects from the list next to File name. The file also shows up in the JMP Home Window Recent Files list if you previously opened it with the File > Open command or the Open toolbar button.
On Macintosh, open a project by selecting File > Open and selecting the file. Though there is no project window on Macintosh, the files that are set to open or run automatically appear.
Add Items to a JMP Project
You can add either saved or open files to a JMP project. If a file has not already been saved, you are prompted to save it before it can be added to the project. You can drag and drop files from the Home Window into a project.
Project Menu
To add items using the Project menu, right-click on the project name in the Projects window and select the desired command.
New Group
Adds a collapsible and expandable container that organizes related items.
Add Window
Opens a window that lets you select which open JMP window to add to the project. If the contents of the window has not been saved, you are prompted to do so before the window is added to the project.
Add Document
Adds a copy of a file (if the archiving option is turned on) or a link to the file (when the archiving option is turned off). After selecting this option, the standard File Open window appears.
Add Folder
Adds a Windows folder to the project. You browse to select the folder from your computer.
Add Database Query
Opens the JMP database query Window, where you can create or open a query to a database. This query is then added to the project. For detailed information about creating queries, see “Import Data from a Database” in the “Import Your Data” chapter.
Add URL
Opens the Internet Open window, where you specify a URL to add to the project. Select an option from the Open As list to specify how JMP opens the file.
Add SAS Stored Process
Lets you add a SAS Stored Process. If you are not connected to a SAS Metadata Server, you are either connected to the server using your saved profile, or the SAS Server Connection window is opened for you. Once you are connected, you can select the SAS Stored Process to add to the project. See “Run Stored Processes” in the “Import Your Data” chapter.
Add All Windows
Adds links to all open windows.
Drag and Drop Files
With the Projects window open, you can drag and drop files into a project from the following programs:
• Windows Explorer
• Microsoft Outlook (such as e-mails, attachments, notes, and calendar entries)
• JMP windows (Hold down the CTRL key, click the title bar, and drag the window to the project.)
Drop the files onto the project name inside the window, not into the empty space.
Customize the Project
JMP has several commands that let you organize and customize your project.
Open Files
When you open a project, JMP can automatically open most files or run scripts in that project.
To open all files or run scripts or database queries automatically, right-click the project name and select When project is reopened > Restore all items in the project.
To open or run specific items automatically, do the following:
1. Right-click each file that you want to open or run and select Restore this item when the project is opened. The name of the options depends on the file type. For documents, the option is named Restore this document when the project is opened. For windows, the option is named Restore this window when the project is opened.
2. Right-click the project name and select When project is reopened > Restore only marked items. (This is the default project setting.)
Though you cannot create a project on Macintosh, you can open files in a project if you set the files to open automatically.
Note: Be careful setting all items to open automatically. When you add a folder full of files, opening all of those files might cause a delay.
When you double-click a file in a project, most files open in their default programs. For example, data tables, journals, and scripts open in JMP. Graphics open in your default graphics program. Files that can be imported into JMP (such as Excel files or SAS data sets) are opened based on your text import preferences.
You can also choose how to open a file by right-clicking it and selecting an option. The options differ based on the file type. For example, files that are imported as data have text import options, or you can open them outside of JMP.
Groups
Adding a group to a project lets you organize files into collapsible and expandable containers. To add a new group, right-click on the project and select New Group. You can add files by right-clicking on the new group, or you can drag and drop existing files into the group.
Notes
JMP enables you to add descriptive notes about a project. Select the Edit Notes command from the Project menu to add or edit a project’s notes. The notes are shown in the project properties. Right-click the project name and select Properties to view the notes.
Fix Broken Links
When you save a project, JMP warns you if the link to a file is broken.
To fix a broken link:
1. Click No on the broken link warning window.
2. In the Projects window, right-click the affected file, and select Fix Broken Link.
3. Browse to find the file.
4. Click OK.
Save a Log Window
Selecting View > Log displays a window that monitors JMP activities, such as JSL statements as they execute and script errors. You might also encounter instances where running a formula, matrix, or another operation writes information of interest to the log window.
To save a log:
1. Open the Log window.
2. Select File > Save As.
Note: (Windows only) To open the log automatically when text is added to it, select File > Preferences > Windows Specific. In the Open the JMP Log window list, select whenever text is added.
..................Content has been hidden....................
You can't read the all page of ebook, please click here login for view all page.