Terms you’ll need to understand
![]() Hyper-Threading
Hyper-Threading
![]() Hardware Execution Context (HEC)
Hardware Execution Context (HEC)
![]() Transparent Memory Page Sharing
Transparent Memory Page Sharing
![]() Balloon-driver
Balloon-driver
![]() Alarms
Alarms
Concepts and techniques you’ll need to master
![]() How the balloon-driver works
How the balloon-driver works
![]() How transparent memory page sharing works
How transparent memory page sharing works
![]() How to use host-based and VM-based alarms
How to use host-based and VM-based alarms
![]() Virtual memory and virtual CPU optimization
Virtual memory and virtual CPU optimization
This chapter focuses primarily on how to monitor your VMware Infrastructure. You learn about optimizing and monitoring resources used by virtual machines (VMs) and hosts, including virtual CPUs and virtual memory. The chapter concludes with a discussion of alarms.
The two most important resources for virtual machines are virtual CPU and virtual memory. Knowing and understanding the different concepts and techniques used to manipulate these two resources are absolutely critical and are fundamental in your understanding of how the VMware Infrastructure works. This section focuses on the different mechanisms used by ESX for virtual CPU and virtual memory optimization.
You can configure a virtual machine with one, two, or four virtual CPUs (vCPUs). For a vCPU to get physical CPU time, the vCPU needs to be scheduled on a Hardware Execution Context (HEC). An HEC is a thread that is scheduled on a physical processor. The number of HECs available for scheduling depends on the number of physical cores available in the system. vCPUs must be scheduled at the same time or not at all, so, for example, a two-vCPU virtual machine must be scheduled on two HECs at the same time or not all. The same applies to a four-vCPU virtual machine; it either gets scheduled on four HECs at the same time or not at all.
NOTE
To configure a VM with two or four vCPUs, you need the underlying host to have two or four physical processors or cores.
EXAM ALERT
If any physical CPU in an ESX host fails, the entire host will crash, and there will be no redundancy capabilities.
To determine the number of HECs available, you have to look at the physical processor configuration of your system. Today, processors with multiple sockets are available; a socket is also a complete processor that is either packaged with other sockets in the same core or available alone in the core. If you have a single core, dual socket system without hyper-threading, for example, you then have two HECs. If you have a single core, quad socket, you then have four HECs and so on. The following sections describe hyper-threading and vCPU load balancing.
Hyper-threading is an Intel Corporation technology that allows you to schedule multiple threads on the same processor at the same time. Hyper-threading does not increase CPU capacity, however. Hyper-threading is enabled in the BIOS of the system, and when enabled, it increases the number of available HECs on which vCPUs can be scheduled. Even with the capability to schedule multiple threads on the same physical CPU at the same time, if contention occurs, one thread would have to wait while the other finishes execution. For this reason, when VMs have high vCPU utilization, the VMkernel ignores the second thread if it exists. That is, hyper-threading does not increase a VM’s vCPU capabilities if the VM is CPU intensive.
The VMkernel is responsible for dynamically scheduling vCPUs and the Service Console (SC). VMkernel schedules and reschedules vCPUs on different HECs every 20 milliseconds, with the exception of the Service Console, which is always scheduled on the first HEC or physical CPU 0 and is never changed.
The VMkernel’s sole purpose in this constant migration of the vCPUs from one HEC to another is to maintain the most adequate load. The VMkernel determines where it schedules the different vCPUs and on which HECs.
The VMkernel uses the following techniques to control and allocate virtual memory when memory is scarce:
• Transparent memory page sharing
• Balloon-driver or vmmemctl
• VMkernel swap
EXAM ALERT
The VCP exam may use the term balloon-driver at times and at other times may use the official name of the technology, which is vmmemctl, so be prepared.
The following sections dig into each one of these concepts. You find out how they work and how they yield and release memory to satisfy an ESX host in times of memory need.
Transparent memory page sharing detects when VMs are accessing the same memory pages, and instead of allocating different copies of the same memory space for each VM, it maps all the VMs that are accessing the same memory space to a single copy. The technique of transparent memory page sharing holds true as long as the VMs are just reading the same memory space—so in other words, as long as they are in Read-Only mode.
As soon as a VM needs to write to memory, the VMkernel creates a copy of this memory space specifically for this VM, which can then write to it. Transparent memory page sharing is enabled by default unless specifically disabled.
Consider an example of how this mechanism works. Say you have 10 VMs that are all running Windows Server 2003. Because they all run the same operating system, they are all accessing the same file and thus require the same memory pages. So these 10 VMs can access the same memory pages in Read-Only mode. As soon as any one of these VMs needs to write to memory, a private copy is then created for it.
A balloon-driver (also referred to as vmmemctl) is a guest operating system device driver that is installed as part of the VMware Tools installation. Its function is simple: When an ESX system comes under physical memory strain, the VMkernel randomly selects a VM, inflates the device driver inside the guest operating system, and consumes all the available memory that is not being used by the operating system. It then releases this acquired memory to the ESX system to ease its memory requirements. When the need for this memory ceases to exist, the device driver is deflated or stopped, and the memory is returned to the guest operating system.
This mechanism comes into play only when an ESX system is hungry for memory resources. It is also worth noting that VMs are completely unaware of this concept. To a VM, a device driver simply started inside the guest operating system and consumes all this memory.
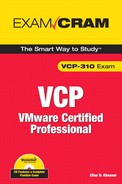
You can configure the balloon driver to consume up to 75% of the memory of the virtual machine. This is an advanced VMkernel setting named Mem.CtlMaxPercent and can be set between 0% and 75%. It is set to 65% by default. As you can see in Figure 10.1, to modify this setting, you need to go to the Configuration tab on your ESX host, select Advanced Settings on the left pane, and click on Mem.
Every virtual machine needs a swap file that is created when the VM is powered on and is deleted when the VM powers off. The swap file size is the difference between the VM’s memory limit and its reservation. Unless otherwise specified, the swap file is located with the VM’s boot disk.
When the VMkernel requires memory, the VM’s memory pages are copied into the swap file to allow the VM to continue to function and then relinquish this memory to the VMkernel. This measure is a last resort in case the balloon-driver cannot allocate enough memory to satisfy the VMkernel’s needs. As with any other system, when heavy paging occurs, the VM’s performance suffers.
Because ballooning can consume only up to 75% of a VM’s memory and because ballooning is set to 65% by default, the 10% difference would have to be allocated by the VMkernel swap. For example, in the event that an ESX host becomes starved for memory resources and a VM’s balloon-driver is inflated for 65% of its memory but the VMkernel has requested 75%, the remaining 10% is allocated by swap. You should note that swapping is less desirable than ballooning and causes a VM’s performance to suffer, whereas ballooning has less of a performance strain on the VM.
Monitoring the resource usage of a virtual machine or a host is a critical first step in a troubleshooting process or if you are planning an expansion and need to know where your performance metrics stand as far as resources. The Virtual Infrastructure (VI) client offers you the Performance tab for both virtual machines and hosts; this tab allows you to view real-time or historical graphs for the following resources:
• CPU
• Memory
• Disk
• Network
TIP
To compare multiple VMs side by side, you can tear off the performance charts of those VMs and arrange them side by side to make comparing them easier.
In the sections to follow, we cover those resources in greater detail and examine how you can gather the necessary performance metrics needed. Performance metrics are great to have for troubleshooting purposes, of course, but they are also very useful in justifying additional hardware purchases or hardware upgrades.
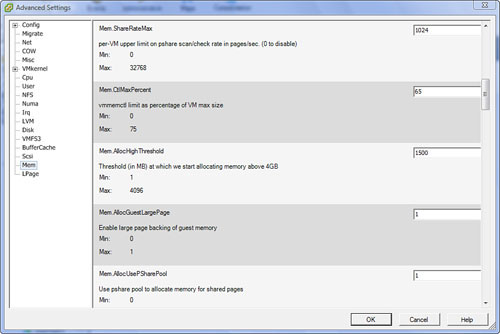
The most important indicator that a VM is not getting enough time on the physical CPU is the CPU ready metric, which indicates that a vCPU is requesting a time slice on the physical CPU but cannot get scheduled fast enough. The vCPU is thereby queued, which results in poor performance. Figure 10.2 shows a vCPU’s ready graph that is available only in real-time. You cannot view this metric in the historical database.
The following conditions can affect the CPU ready time:
• Overall CPU Utilization: This can affect CPU ready time because when the overall CPU utilization is high, other VMs are also competing for this resource, which drives up this counter.
• Number of Resource Consumers: When an ESX host is running several VMs, it is more than likely that the VMkernel will start to queue the VMs’ access times to the physical CPU as a result of the numerous simultaneous requests.
• Load Correlation: This means that if a task being executed on the physical CPU initiates multiple other tasks or threads when it is completed, ready time is affected.
• Number of vCPUs in a VM: When multiple vCPUs are present in the VMs, they are scheduled at the same time on the physical CPUs or not at all. A four-vCPU VM requires four physical CPUs to be available for the schedule to be successful. In high ready times, this is challenging because all the CPUs must be free of contention to be scheduled.
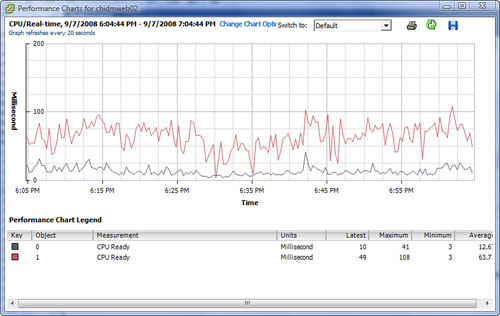
You can monitor memory usage in the same manner as you would CPU usage. However, when a virtual machine is running out of memory, check the performance graph and monitor the amount of ballooning, which may be consuming memory. In this event, you can VMotion the VM to another host that is not experiencing memory constraints, or you can increase its shares, which would give it priority over other VMs. Figure 10.3 shows a VM’s memory graph with ballooning.
Disk contention is a performance metric that many people often dismiss as a nonissue. Disk contention, however, can significantly degrade virtual machine performance. You can monitor disk saturation using the performance graph inside the VI client or using third-party tools. In the event that disk saturation is detected, you should move the VM’s files to another storage device that is not having disk contention, change the path that leads to the storage device if that path is saturated, and then ensure that you are using a RAID level that is adequate for the application you have deployed.
Network bandwidth-intensive applications often require you to migrate the VMs to other physical NICs that are less utilized to maximize performance. You may also consider traffic shaping as another technique by which you can control network bandwidth. The use of the performance graphs or other third-party tools can help you detect high utilization of network bandwidth.
Alarms are thresholds that you configure on either a host or a virtual machine. The alarm sends you a notification when a certain threshold has been reached. Alarms allow you to quickly respond to a potential problem and address it before it causes major problems.
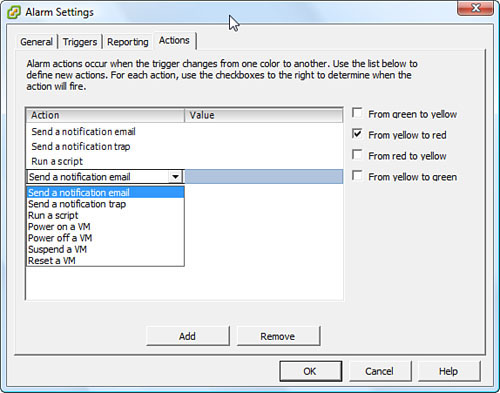
When an alarm threshold is reached, the VI client displays a message. Because you typically are not monitoring or logged in all the time, you can configure options to notify you of this alarm. Figure 10.4 shows the Actions tab in Alarm Settings and the different methods by which you can configure the alarm to notify you. You can also configure it to perform a certain task when an alarm threshold is reached, such as run a script, send an email, or even use the Short Message Service (SMS).
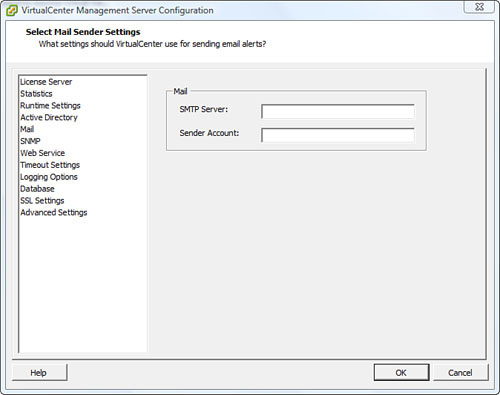
After you have configured your alarms with the proper actions to perform, you should make sure that VirtualCenter (VC) knows how to deliver these messages to you. If you chose to be notified by email when a certain threshold is reached, for example, you need to configure VC with the proper SMTP settings to route this email to you successfully. The same goes for SNMP traps. From within VC, click on Administration > VirtualCenter Management Server Configuration. As you can see in Figure 10.5, you can then click on the Mail to configure email delivery or SNMP to configure its settings
CAUTION
If the CMTP server is reporting the alarm, you may never be notified because the server that is charged with delivering the notification is suffering from a warning. Situations like these are what necessitates that you have alternate means of notification delivery, such as a monitoring server, for example.
1. True or false: Transparent memory page sharing is enabled by default and cannot be turned off.
![]() A. True
A. True
![]() B. False
B. False
2. True or false: A virtual machine’s swap file is deleted once the VM is powered off.
![]() A. True
A. True
![]() B. False
B. False
3. Which technology allows for the scheduling of multiple threads on the same CPU?
![]() A. CPU affinity
A. CPU affinity
![]() B. CPU threading
B. CPU threading
![]() C. Memmaker
C. Memmaker
![]() D. None of the above
D. None of the above
4. What is the key indicator that a virtual machine’s vCPU is losing competition time for physical CPU scheduling?
![]() A. CPU ready time
A. CPU ready time
![]() B. CPU time
B. CPU time
![]() C. Context switches
C. Context switches
![]() D. % CPU Scheduler
D. % CPU Scheduler
5. Which virtual memory technology is used to consume the memory of a virtual machine and release it to the VMkernel for allocation to other VMs? (Select all that apply.)
![]() A. Balloon-driver
A. Balloon-driver
![]() B. VMkernel swap
B. VMkernel swap
![]() C. Transparent memory page sharing
C. Transparent memory page sharing
![]() D. Vmmemctl
D. Vmmemctl
6. On which physical processor does the Service Console always run?
![]() A. CPU0
A. CPU0
![]() B. CPU1
B. CPU1
![]() C. CPU2
C. CPU2
![]() D. Distributes the load on multiple CPUs for redundancy
D. Distributes the load on multiple CPUs for redundancy
7. What is the interval at which the VMkernel dynamically and constantly changes the vCPU’s HECs?
![]() A. 20 seconds
A. 20 seconds
![]() B. 20 milliseconds
B. 20 milliseconds
![]() C. 25 seconds
C. 25 seconds
![]() D. 25 milliseconds
D. 25 milliseconds
8. True or false: The Service Console is constantly scheduled on different HECs.
![]() A. True
A. True
![]() B. False
B. False
9. True or false: The balloon-driver, if inflated, is configured by default at 75% of the VM’s memory.
![]() A. True
A. True
![]() B. False
B. False
10. How many physical CPUs are needed to support a virtual machine that is configured with four vCPUs? (Select all that apply.)
![]() A. Single socket, quad core
A. Single socket, quad core
![]() B. Quad socket processor
B. Quad socket processor
![]() C. Dual socket, single core
C. Dual socket, single core
![]() D. Single socket, dual core
D. Single socket, dual core
Answers to Exam Prep Questions
1. Answer B, False, is correct. Transparent memory page sharing is turned on by default, but you can turn it off if you choose to do so.
2. Answer A, True, is correct. A virtual machine’s swap file is deleted when the VM is powered off and is re-created when the VM is powered on.
3. Answer D is correct. The technology that allows for the scheduling of multiple threads on the same CPU is known as hyper-threading; therefore, answers A, B, and C are incorrect.
4. Answer A is correct. The key indicator that a virtual machine is losing compete time for a physical CPU time slice is the CPU ready time; therefore, answers B, C, and D are incorrect.
5. Answers A and D are correct. Vmmemctl, which is also known as the balloon-driver, is the virtual memory technology that is used to grab memory from one VM and release to the VMkernel, which will then allocate it to another VM; therefore, answers B and C are incorrect.
6. Answer A is correct. The Service Console is always scheduled on physical CPU0 and never changes; therefore, answers B, C, and D are incorrect.
7. Answer B is correct. The VMkernel dynamically and constantly changes the vCPU’s HECs every 20 milliseconds; therefore, answers A, C, and D are incorrect.
8. Answer B, False, is correct. The Service Console does not participate in the VMkernel’s constant scheduling and rescheduling of HECs and remains on the same CPU at all times.
9. Answer B, False, is correct. The balloon-driver is configured by default at 65% of the VM’s memory.
10. Answers A and B are correct. A virtual machine with four vCPUs requires four physical CPUs to be scheduled on; therefore, answers C and D are incorrect.