Mohammad Khorasani1, Mohamed Abdou2 and Javier Hernández Fernández1
(1)
Doha, Qatar
(2)
Cambridge, United Kingdom
Streamlit has made it thoroughly simple to create interfaces, display text, visualize data, render widgets, and manage a web application from inception to deployment with its convenient and highly intuitive application programming interface showcased in the Appendix. With the techniques covered in this chapter, one will learn how to create input forms, implement conditional flow, manage errors, mutate dataframes, and render basic charts. And upon completion of Streamlit basics, a developer should be able to produce, manage, and control a variety of trivial web applications and to deploy them locally. Such applications include but are not limited to data explorer, machine learning, multimedia, data wrangling, and other general-purpose applications. Once the developer has mastered the basics of Streamlit, they may then begin to develop more advanced and nontrivial applications that will be addressed in subsequent chapters.
2.1 Creating a Basic Application
Putting Streamlit’s mighty API to use, we can render a variety of applications. From the simplest use cases catering to microservices to complex applications with distributed systems, Streamlit enables us to accommodate to our users’ diverse set of requirements. To begin with however, we will peruse the more trivial types of applications in this section before proceeding to more complex ones in subsequent sections.
2.1.1 Generating User Input Forms
Creating forms in Streamlit can be as simple as bundling several text, number, and other input widgets together on a page coupled with a button that triggers an action such as recording the entries on a database or saving it to the session state. The caveat with this approach is that each time the user interacts with any of the widgets, Streamlit will automatically rerun the entire script from top to bottom. While this approach provides the developer with a logical and seamless flow to their program, it may sometimes be useful to bundle input widgets together and have Streamlit rerun the script only when prompted by the user. This can be done using the st.form command.
import streamlit as st
with st.form('feedback_form'):
st.header('Feedback form')
# Creating columns to organize the form
col1, col2 = st.columns(2)
with col1:
name = st.text_input('Please enter your name')
rating = st.slider('Please rate this app',0,10,5)
with col2:
dob = st.date_input('Please enter your date of birth')
recommend = st.radio('Would you recommend this app to others?',('Yes','No'))
submit_button = st.form_submit_button('Submit')
if submit_button:
st.write('**Name:**', name, '**Date of birth:**', dob, '**Rating:**', rating,'**Would recommend?:**', recommend)
A Streamlit form can be called within a with statement and using the st.form command. In Listing 2-1, we initially create columns with the st.columns command to organize the widgets within our form into two columns of equal width. In the first column, we place a text input and slider widget using the st.text_input and rating commands, respectively, and in the second column, we place a date input and radio button widget using the st.date_input and st.radio commands.
Subsequently, within the same with statement, we add a form submit button using the st.form_submit_button command. When this button is clicked, it will submit the entries of all the widgets collectively at once regardless of how many items are included in the form. It is important to note that st.form_submit_button is not the same as st.button, and without a form submit button, Streamlit will throw an error.
As shown in Figure 2-1, all of the widgets will be bundled together in one form with the st.form command. Once the form submit button is clicked, all of the entries will be processed collectively at once and the output processed as shown in Figure 2-2.
Instantiated Streamlit input form (output of Listing 2-1)
2.1.2 Introducing Conditional Flow
It may be necessary to introduce conditional flow to your Streamlit applications whereby certain actions will be dependent on prior actions or on the state of widgets. This is especially useful for prompting the user to correctly fill in forms and/or use the application correctly. Without implementing conditional flow, your application will be prone to throwing errors should the user make incorrect use of it.
Example 1
import streamlit as st
def display_name(name):
st.info(f'**Name:** {name}')
name = st.text_input('Please enter your name')
if not name:
st.error('No name entered')
if name:
display_name(name)
Listing 2-2
conditional_flow_1.py
In Listing 2-2, to ensure the user has entered an input into the name field, we are using an if statement to check whether this field is not empty. If it is empty, the user will be prompted with an error message (Figure 2-3), and if it is not empty, a function will be invoked to display the entry (Figure 2-4).
Example 2
import streamlit as st
def display_name(name):
st.info(f'**Name:** {name}')
name = st.text_input('Please enter your name')
if not name:
st.error('No name entered')
st.stop()
display_name(name)
Listing 2-3
conditional_flow_2.py
In Listing 2-3, similarly we are using an if statement to check whether the name field is not empty. The only difference here is that we are utilizing the st.stop command to stop the execution of the script if the name field is empty. And if it is not empty, we are proceeding with the rest of the script that displays the entered name. The benefit of this method is that it eliminates the need for an additional if statement and simplifies your script; otherwise, in terms of utility, both examples are identical.
Figure 2-3
Implementing conditional flow (output of Listing 2-2)
Conditional flow programming can be applied to both trivial and nontrivial applications. Indeed, this technique can be scaled and implemented with nested if statements, while loops, and other methods if required.
Figure 2-4
Implementing conditional flow continued (output of Listing 2-2)
2.1.3 Managing and Debugging Errors
If you are running Streamlit in development mode and have configured showErrorDetails = True as shown in Table 3-1 in Section 3.1, then Streamlit will natively display runtime exceptions on the web page similar to how any other IDE would display such messages on the console. This is far from ideal as the user will not be able to make much sense of it and will be left confused. More importantly, leaving exceptions mismanaged can trigger a chain of fatal errors in subsequent parts of your code that can have a cascading effect on other systems. In addition, Streamlit will display the errorsome segment of your code that is causing the exception to the user, which may infringe on intellectual property rights, should your source code be subject to such restrictions.
import streamlit as st
col1, col2 = st.columns(2)
with col1:
number_1 = st.number_input('Please enter the first number',value=0,step=1)
with col2:
number_2 = st.number_input('Please enter the second number',value=0,step=1)
Running Listing 2-4, we can create a trivial application where one number is divided by another. If the user divides by any number other than zero, the application will work just fine and display an output similar to Figure 2-5. However, should the user decide to divide by zero, logically Python will throw a zero division error that will be displayed by Streamlit as shown in Figure 2-6.
Figure 2-5
Running Streamlit without a try and except block without an error (output of Listing 2-4)
Figure 2-6
Running Streamlit without a try and except block with an error (output of Listing 2-4)
Example 1
You can indeed limit the range of input values for the st.number_input widget, but let us assume for a moment that you could not. Then the remedy for this would be to make use of try and except blocks in your code as shown in Listing 2-5 wherever there is a likelihood of running into an unforeseen issue. In this instance, we attempt to run the troublesome part of the script with the try statement. Should it fail due to a ZeroDivisionError, we will handle it with an except ZeroDivisionError statement that will display a curated error message to the user as shown in Figure 2-7. And should it fail for any other reason, we can use a general except statement to pass this part of the code without any execution.
import streamlit as st
col1, col2 = st.columns(2)
with col1:
number_1 = st.number_input('Please enter the first number',value=0,step=1)
with col2:
number_2 = st.number_input('Please enter the second number',value=0,step=1)
Running Streamlit with a try and except block with an error (output of Listing 2-5)
Example 2
Another way of managing exceptions is to use a general except statement, and within it displaying a curated message of the actual error occurring as shown in Figure 2-8. This can be particularly useful for debugging the script for the developer themselves while not compromising on the user experience.
import streamlit as st
col1, col2 = st.columns(2)
with col1:
number_1 = st.number_input('Please enter the first number',value=0,step=1)
with col2:
number_2 = st.number_input('Please enter the second number',value=0,step=1)
Running Streamlit with a try and except block with an error (output of Listing 2-6)
2.2 Mutating Dataframes
Given Streamlit’s emphasis on developing machine learning and data science applications, as a developer you will often need to mutate dataframes in response to a user input or need. In this section, we will introduce a non-exhaustive list of some of the most commonly used methods of mutating Pandas dataframes.
2.2.1 Filter
Dataframes can be filtered by using the method shown in Listing 2-7. We can simply specify a condition for a column numerical and/or string, that is, df[df[‘Column 1’] > -1], and filter the rows based on that as shown in Figure 2-9.
Filtering Pandas dataframes (output of Listing 2-7)
2.2.2 Select
Dataframe columns can be selected by using the method shown in Listing 2-8. We can specify which columns to keep by their names, that is, df[[‘Column 1’, ‘Column 2’]], and remove other columns as shown in Figure 2-10. Alternatively, the exact same function can be achieved by using the drop command, that is, df.drop(columns=[‘Column 3’]).
import streamlit as st
import pandas as pd
import numpy as np
np.random.seed(0)
df = pd.DataFrame(
np.random.randn(4, 3),
columns=('Column 1','Column 2','Column 3')
)
st.subheader('Original dataframe')
st.write(df)
df = df[['Column 1', 'Column 2']]
st.subheader('Mutated dataframe')
st.write(df)
Listing 2-8
mutate_dataframe_select.py
Figure 2-10
Selecting Pandas dataframe columns (output of Listing 2-8)
2.2.3 Arrange
Dataframe columns can be arranged and sorted in ascending and/or descending order based on the numerical or nominal value of a specified column by using the method shown in Listing 2-9. We can specify which column to sort and in which order, that is, df.sort_values(by=‘Column 1’,ascending=True), as shown in Figure 2-11. Once the column has been sorted, the index will be modified to reflect the new order. If necessary, you may reset the index by using the df.reset_index(drop=True) command to restart the index from zero.
Sorting Pandas dataframe columns (output of Listing 2-9)
2.2.4 Mutate
Dataframe columns can be mutated by assigning new columns based on the value of another column by using the method shown in Listing 2-10. We can specify a simple lambdafunction to apply to the values of an existing column, that is, Column_4 = lambda x: df[‘Column 1]*2, to compute the output shown in Figure 2-12.
Mutating Pandas dataframes (output of Listing 2-10)
2.2.5 Group By
Sometimes, it may be necessary to group or aggregate the values in a column or several columns in a dataframe. This can be done in Pandas using the method shown in Listing 2-11. We can specify which column or columns to group by with the df.groupby([‘Column 1’, ‘Column 2’]) command. This will reindex the dataframe and group the relevant rows together as shown in Figure 2-13.
Multiple dataframes can be merged together with Pandas utilizing a common column as a reference using the method shown in Listing 2-12. We can specify which column to merge on and whether the merge should be a union or intersection of both dataframes with the df1.merge(df2,how=’inner’,on=’Name’) command. This will create a combined dataframe as shown in Figure 2-14.
Grouping Pandas dataframes (output of Listing 2-11)
2.3 Rendering Static and Interactive Charts
Data visualization is quite literally where Streamlit shines the most. The ease at which a variety of static and interactive charts can be invoked and rendered is quite remarkable. Streamlit natively supports a host of charts including but not limited to bar, line, and area charts as well as graphs, maps, and other types of interactive and noninteractive visuals. In addition, there is a multitude of third-party plots that can also be used with Streamlit. In this section, we will develop several instances of static and interactive charts using data from a Pandas dataframe.
2.3.1 Static Bar Chart
A static bar chart can be generated by inputting a Pandas dataframe into a Matplotlib figure by using the method shown in Listing 2-13. We can specify the chart type by setting kind=‘bar’. Other Matplotlib parameters can be found at https://matplotlib.org/stable/api/_as_gen/matplotlib.pyplot.plot.html. The generated chart is shown in Figure 2-15.
Merging Pandas dataframes (output of Listing 2-12)
2.3.2 Static Line Chart
Similarly, a static line chart can be generated by inputting a Pandas dataframe into a Matplotlib figure by using the method shown in Listing 2-14. We can specify the chart type and the option of having subplots by setting kind=‘line’, subplots=True.
Generating a static bar chart (output of Listing 2-13)
Figure 2-16
Generating a static line chart (output of Listing 2-14)
2.3.3 Interactive Line Chart
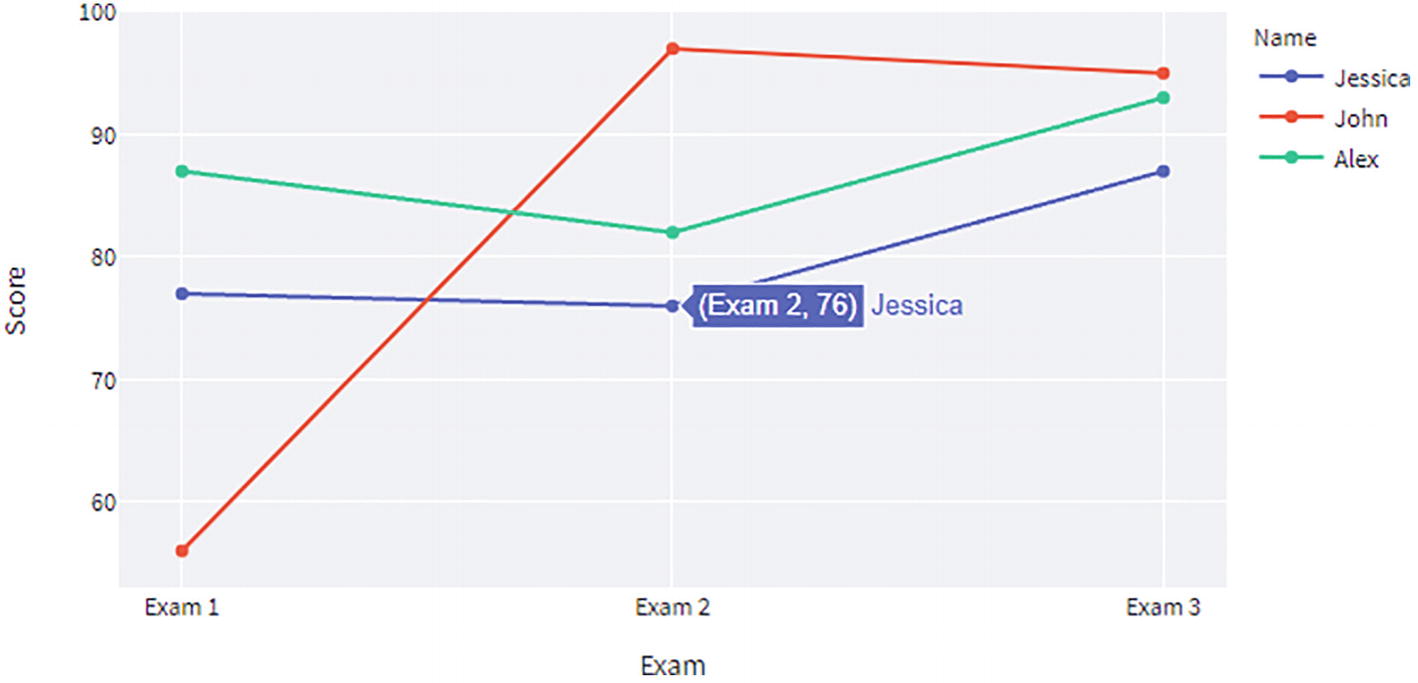
An interactive line chart can be generated by inputting a Pandas dataframe into a Plotly figure by using the method shown in Listing 2-15. We can simply declare the chart type and its associated properties by using the JSON notation used with all Plotly charts and figures. Other Plotly parameters can be found at https://plotly.com/python/line-charts/; we will cover Plotly line charts in greater depth in Section 4.2. The generated chart is shown in Figure 2-17.
Generating an interactive line chart (output of Listing 2-15)
2.3.4 Interactive Map
Likewise, an interactive geospatial map can be generated by inputting a Pandas dataframe containing the longitude and latitude of a set of points into a Plotly figure by using the method shown in Listing 2-16. In addition, we can declare the exact geospatial location to zoom into by setting geo_scope=‘usa’. Other Plotly parameters can be found at https://plotly.com/python/scatter-plots-on-maps/; we will cover Plotly geospatial charts in greater depth in Section 4.2. The generated map is shown in Figure 2-18.
Generating an interactive map (output of Listing 2-16)
2.4 Developing the User Interface
Typically, developing a user interface for a web application requires a separate skill set that pertains to graphical design and usability studies. A frontend developer will begin by conceptualizing their idea with a wireframe diagram that disposes the elements of a page. This will then iteratively be converted to an actual user interface through testing and refinements. Streamlit has largely eliminated that undertaking with its intuitive, responsive, and standardized interface, whereby the developer can render a web page without having to worry about the intricate details of design.
In other words, Streamlit interfaces are plug and play, allowing the developer to focus on the logic of their program while leaving the visual implementation to Streamlit. Should the user require something more bespoke and customized, they are indeed welcome to integrate their own HTML and/or JavaScript components. Customizability and external components will be addressed in subsequent chapters.
In this section, we will be developing an application similar to the dataframe demoapplication shown in the previous chapter as an example of how to create a basic user interface.
import streamlit as st
import pandas as pd
import plotly.express as px
program = st.sidebar.selectbox('Select program',['Dataframe Demo','Other Demo'])
As always, we initially import the stack of dependencies that we will be using for this application, namely, Streamlit itself, Pandas for dataframe handling, and Plotly Express to plot a simple time-series chart of the value of several blue chip stocks over time. We then download a dataset from Plotly’s list of available open source datasets and initiate our user interface by invoking a title using the st.title command. We then add a st.sidebar.selectbox command to define a list of programs/pages for this application. This is followed by a checkbox on the sidebar to display our code using the st.sidebar.checkbox command. Widgets can be added to the sidebar by appending the st.sidebar prefix if applicable. We then use a st.multiselect command to select the list of stocks we want to visualize. The selection will be used to filter the dataframe containing the stock values and will then be displayed using the st.write command.
Subsequently, we will use the filtered dataframe to create a time-series line chart with Plotly using the reference at https://plotly.com/python/time-series/. Once the figure has been generated, it can be displayed using st.write, otherwise known as the pocket knife command due to its versatility in rendering virtually anything. And last but not least, we will use a st.code command to present our snippet of code if the checkbox is preselected by the user. And there you have it (Figures 2-19 and 2-20), a basic dataframe application in a little over 40 lines of code.
Figure 2-19
Dataframe demo application (output of Listing 2-17)
Figure 2-20
Dataframe demo application continued (output of Listing 2-17)
2.5 Summary
This chapter has been a rigorous one indeed. At this point, you should have gotten up to speed with the gist and essence of Streamlit and should have also developed a fairly clear idea of its capabilities. You have been introduced to the diverse set of commands in the Streamlit API that pertain from everything related to displaying text, tables, and charts to rendering interactive widgets, and multimedia objects, to commands that allow you to organize the page and optimize Streamlit for efficient use with big data.
In the latter part of this chapter, we covered the basics of creating a trivial web application. This included creating forms, implementing conditional flow, managing exceptions, mutating data, as well as rendering a variety of visualizations, and bundling all of these elements together in the form of one user interface. In short, after having perused this chapter, you should feel confident enough to proceed with developing a straightforward web application of your own in Streamlit.