Successful traders take advantage of all market conditions; know when to go long and when to short a stock.
It is well known in the stockbroking fraternity that of all stock exchange-related careers, the portfolio manager has the quickest burn-out period. Every day the manager faces the daunting task of providing personal attention to a multitude of clients, maintaining portfolio strengths and growth under stressful economic and political conditions, attending to general correspondence, reading volumes of market research, and actively seeking new business.
In addition, he or she has to make their own judgments on shares that are not researched by analysts. In essence, he or she is expected to know how to analyze companies and market trends within which these companies trade, has to take fundamental and technical factors into consideration, and then put his or her money where his or her mouth is and trade the shares.
There is a saying in stockbroking that there is no skill in buying or selling shares during strong bull or bear markets, but that it takes courage to go against mass hysteria and buy when others are selling.
Although this statement is relatively simple—to outperform the market the investor has to anticipate future price movements—portfolio managers have difficulty in convincing investors to hand over their cash when share prices seem to be falling down a bottomless pit.
While it may seem obvious that shareholders have a fear of buying shares during adverse conditions, the real problem stems from a lack of understanding of the theories of portfolio management.
There is thus a twofold objective in highlighting the foundations of portfolio management.
• First, to demonstrate that the core of investment knowledge is rapidly expanding.
• Second, this core is proportional to the standard of investment advice given to investors.
In other words, all investment decisions involve making a trade-off between the level of risk acceptable to the client and expected returns, since higher risks usually accompany greater returns. The manager must decide how much additional return is necessary to compensate the client for assuming greater risk.
From the earliest days of development, theories and work study on portfolio management have shown that there is one common element that is inextricably linked to success.
If a manager is able to easily understand and control the risk variable, the greater the chances are of his achieving and maintaining strong growth.
Although various ideas on risk management have been propagated, it is generally accepted that there are two different types, the first uncontrollable, the second controllable through technique.
Constructing an Efficient Portfolio
I was once asked what qualities I believed were important to succeed in such a stressful environment. Ultimately, the manager who is able to remain calm and keep clients happy, while all hell is breaking loose around him, should achieve rapid success.
I was attempting to emphasize that clients tend to panic when the market underwent a temporary correction or they demand that shares be sold merely on unfounded negative rumor.
Therefore, to construct an efficient portfolio, it is necessary to have both technical structural rules to reduce risk exposure and also rules that relate to trading—that is, personal rules to remove emotion. An example of such a rule would be to sell shares if they fall by a predetermined percentage.
I have stated that portfolios are affected by systematic and unsystematic risk and that the latter can be minimized through diversification. In the following text, the former risk is evaluated and it is shown how the investor can reduce its effect on portfolios through efficient construction.
These methods are outlined as follows:
The Efficient Frontier Model
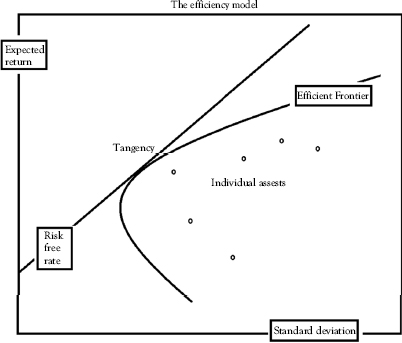
The previous diagram was developed by Harry Markowitz in 1952, which ultimately became the thrust of modern portfolio theory.
Let’s break this down to make it understandable.
The diagram represents a combination of assets, whether stocks or derivatives or a combination of these, that forms a portfolio. If this portfolio of assets is devised to obtain the maximum expected level of return for a specified level of risk, then it can be said that it is efficient. The risk is represented by the standard deviation line in the diagram.
If you cannot hold risk-free assets, the upward-sloped top boundary of this region is a portion of a parabola and is called the “efficient frontier.” All portfolios to the right of the tangency point are generated by borrowing at the risk-free rate and investing the proceeds into the tangency portfolio.
Economic theory describes the efficient frontier as a “theory to do with forward-looking risk and forward-looking returns.” Analysis shows that it is important not to associate the theory with the implementation. Managers often use historic data to project future risk and returns, while these two factors are mutually exclusive.
It states that, for an asset or portfolio of assets to be considered efficient, no other similar portfolio can offer a higher expected return with the same risk or same return with lower risk. This is one of the main reasons that it is ultimately more efficient for a shareholder to create and maintain his own portfolio, as this will be unique and not just one of a stockbroker’s mass of clients.
This model is based on five assumptions:
• Traders and investors must assess each investment and their alternatives on expected returns for a predetermined period.
• Investors want to maximize growth.
• Investors estimate risk on the basis of comparable returns and associated risk.
• The next assumption shows that investors base decisions solely on expected risks and returns.
• Finally, that they are averse to any form of risk.
Asset Allocation
An important task of stock exchange analysts is to regularly reassess areas of the market that offer profitable investment opportunities. They are advising investors on how much money (in percentage terms) to place in equities, gold, other minerals, property, or to keep in cash until the market becomes more favorable.
This is called asset allocation and is used by investment managers to determine the current efficiency of their clients’ portfolios. Some managers believe that stocks and other securities are not the only assets which should be allocated. They say the investors’ motor vehicles, house, antiques, furniture, and so on should also be assessed. These show what the investors’ intentions, objectives, and constraints are.
These three volumes suggest that an asset allocation can be made up as follows:
• Never more than two stocks per sector, until you have at least three sectors covered.
• Keep mostly to shares that are $10 and above. This is a sound starting point for beginners and enables the investor to acquire larger amounts of shares at the beginning of his long-term plans.
• Keep at least 5 percent of a portfolio in cash, for opportunities that come up, that is, not speculative.
• Keep 5 percent of the portfolio in speculative stocks. Even if a new speculative opportunity comes, keep to that 5 percent limit.
• Diversify across various sectors, that is, between financial, mining, and consumer stocks.
• Each share must be analyzed before purchased, unless it forms part of the speculative portion of the portfolio.
• Keep a limit on the number of shares in the portfolio. Remember that the more shares that comprise the portfolio, the more time consuming analysis becomes and maintaining financial efficiency could become a full-time job.
• Limit downside by having a stop-loss philosophy. Remove emotion from trading by selling any share—no matter the reason—if it falls by a level that makes you uncomfortable. Therefore, if a 15-percent drop in the share price makes you uncomfortable, take your loss by selling the share, even if you strongly believe that the share will recover.
• Take profits regularly. Similar to the stop-loss philosophy, sell a share that rises by a certain amount. This places cash in your portfolio and enables you to buy another potential winner. However, regularly review the portfolio and return the percentage level of share that has climbed back to zero. This enables you to plan a long-term growth strategy per share and also for the portfolio as a whole.
Asset Allocation for the Conservative, Moderate, or Aggressive Investor
The following are portfolio asset allocation suggestions and includes foreign investment.
Note that these are suggested allocations and every individual should structure their portfolios in a manner that enables them to feel comfortable. The following portfolio allocations use a timeframe of 3, 10, and 30 years. These portfolios are based on the categories outlined in the following.
Different Portfolio Security-Types
• Aggressive shares: Capital appreciation funds, venture capital shares, emerging market shares, specific global funds, and shares.
• Conservative shares: Growth and income unit trusts, blue chip shares (first-world countries) and conservative growth funds.
• Fixed income: Long-term convertible debentures and long bonds.
• Hybrids: Balanced funds, asset allocation funds, high yield gilts, equity income funds, global bonds, and emerging country debt funds.
• Cash: Money market funds, liquid savings accounts (cash in the bank), and short-term convertible debentures.
The following portfolios represent the norm for conservative, moderate, and aggressive investors. In later volumes we set out portfolios for professional traders:
Types of securities (figures in %) |
The Short-Term Portfolio (3 years) |
||
Types of Investors |
|||
Conservative |
Moderate |
Aggressive |
|
Conservative shares |
25 |
20 |
10 |
Fixed income securities |
40 |
40 |
40 |
Aggressive shares |
0 |
10 |
30 |
Cash |
30 |
20 |
5 |
Hybrids |
5 |
10 |
15 |
TOTAL |
100 |
100 |
100 |
The Long-Term Portfolio (10 years) |
|||
Types of Investors |
|||
Conservative |
Moderate |
Aggressive |
|
Conservative |
25 |
20 |
5 |
Fixed income securities |
30 |
30 |
20 |
Aggressive stocks |
20 |
20 |
50 |
Cash |
15 |
15 |
5 |
Hybrids |
10 |
15 |
20 |
TOTAL |
100 |
100 |
100 |
Types of securities (figures in %) |
The Life-Time Portfolio (30 years) |
||
Types of Investors |
|||
Conservative |
Moderate |
Aggressive |
|
Conservative |
25 |
20 |
5 |
Fixed income securities |
25 |
20 |
10 |
Aggressive stocks |
30 |
50 |
70 |
Cash |
10 |
0 |
5 |
Hybrids |
10 |
10 |
10 |
TOTAL |
100 |
100 |
100 |
• The longer the portfolio time horizon, the less cash-type securities are in portfolios of any kind.
• Even the most conservative investor holds very little cash, but he or she does hold a large portion of funds in fixed income securities.
• The shorter the time span, the higher the risk of investing. Therefore, even the aggressive investor, who is seeking to maximize profits as quickly as possible, holds conservative shares and fixed income securities.
• The investor must keep a long-term goal firmly in mind while having the flexibility to evolve as new research provides better solutions to the risk management problem or new market opportunities present themselves.
• Discipline remains the key to success for long-term investors, that is, falling into a panic trap of selling during bear markets or buying during strong bull markets.
• A successful investment strategy involves patience, discipline, and periodic reviews that must be viewed as an opportunity for fine tuning and occasional modest course corrections, not radical revision and second guessing.
The Capital Asset Pricing Model (CAPM)
This model establishes the inherent risk of an individual share on the whole portfolio. It is calculated through a complex formula, which incorporates the expected rate of return of the share, interest rate, and the expected average rate of return on all shares in the economy.
This model is used to determine the expected return of a share. The manager calculates the net present value of a number of shares, which provides him with a number of investment options. However, there is a difference of opinion among managers as to the accuracy of the CAPM, which has led to further research for more acceptable alternatives. Managers say that the problem in using the CAPM is that, while there is a definite relationship between rates of return and systematic risk for complete portfolios, none exists for individual shares.
The Arbitrage Pricing Theory (APT)
This theory was first outlined by SA Ross in his book “Economic forces and the stock market,” (published 1986) and is based on three assumptions.
• First, capital markets are perfectly competitive.
• Second, investors prefer more to less wealth.
• Third, the process of generating asset returns can be represented in a model.
He believed that investors were able to avoid unsystematic risk. The main importance in using the APT model is that it does not rely on a true market portfolio and is, thus, a more realistic aid to managers in assessing efficient portfolios.
In essence, these theories show that the investor has to determine his risk tolerance and measure this against his expected returns.
A better benchmark can be created for just about any market or portion of a market.
For example, suppose we divided all the publicly listed stocks in the NYSE into 10 different sizes by market capitalization on one axis, and 10 different segments based on debt and equity ratio on the other axis. We now have 100 different possible submarkets. We could call each sub-market an investment style and each style could have its own index or benchmark.
If we studied the performance of each style, we would find they are sharply different from each other. Each style would have distinctly separate identities. For instance:
• Rates of return could vary substantially between the submarkets.
• These submarkets could exhibit different risk or standard deviations.
• Each could also have a different correlation from the other.
• Each style could go through a market cycle with dramatically different results for each time period.
Conclusions
• There is not just one domestic market, but many.
• Many portfolio managers confine themselves to a distinct market segment. For instance, they may be large-cap value, midcap growth, or small-cap market. This is the area of the market they claim to know best and believe has the greatest potential. In any event, over time most of the performance they obtain may simply be attributable to where in the market they invest.
• Investors can therefore design precise benchmarks.
• The investment style of portfolio managers around the world has become more important than management prowess.
• Even when a director beats his competitors, investors cannot be sure growth was a direct consequence of the director’s ability, right market conditions, or just dumb luck.
Even within a carefully defined style, investors are still faced with a wide variation of results in both the short and long terms. Part of this is attributable to style differences within the markets, but a large amount of variation can also be attributed to sector or “window dressing” by portfolio managers.
Many stock markets’ majority of shares are owned by large institutions, which means the weight of funds at their disposal can (and often does) move share prices. Window dressing is a term used when portfolio managers buy shares to boost the performance of their portfolios.
Example
The following example assumes that new portfolio manager Robert has set up a portfolio, which shows no capital growth.
• Robert has 10,000 shares in ABC Ltd.
• He bought these at $100 each.
• The value of his portfolio is therefore $1 million.
• If he uses the institution’s weight of funds to buy 10,000 more ABC Ltd. shares, which are difficult to obtain (called tightly traded shares), the net worth of his portfolio could rise.
Assuming that Robert was able to buy 10,000 more ABC Ltd. shares at an average price of $130 a share, the value of his portfolio rises to 20,000 shares at $130 a share. Remember that the original shares are now also worth $130 a share. In essence, he has made a net profit from buying more expensive shares.
Cost of Robert acquiring ABC Ltd. shares:
Shares |
Price |
Value |
10,000 shares |
at $100 |
$1,000,000 |
10,000 shares |
at $130 |
$1,300,000 |
Total cost |
|
$2,300,000 |
Shares in ABC Ltd |
Quantity |
Share Price |
Value |
Original shares held |
10,000 |
$100 |
$1,000,000 |
Shares bought |
10,000 |
$130 |
$1,300,000 |
Total shares held |
20,000 |
$130 |
$2,600,000 |
Profit made by increasing the portfolio:
Profit |
= |
Total value of shares |
– |
Cost of shares |
|
= |
$2.6 million |
– |
$2.3 million |
|
= |
$300,000 |
|
|
|
= |
13% increase in value of the portfolio |
||
When investors build investment strategies, a benchmark, style, or passive approach may be very viable. After all, what’s wrong with top-quartile results of unit trusts? All other things being equal, when given a choice between actively managed funds, investors should opt for the one with the lowest cost, widest diversification, and lowest turnover.
In fact, investors have actually returned to the thesis that asset allocation is much more important than focusing on a particular share, timing, or directors’ performance. In fact, there are mathematical methods of assessing a director’s ability.
Chapter 14 establishes your ultimate portfolio.