10
Tuning and Maintaining Windows Server 2022
This chapter is designed to teach you considerations for server hardware and best practices regarding performance monitoring methodologies. Understanding the importance of a server’s role in a computer network and possessing knowledge of a server’s hardware components has two benefits: it helps with server hardware selection and troubleshooting server hardware-related issues.
Furthermore, this chapter will teach you server performance monitoring methodologies and procedures. Performance monitoring will help you identify the cause of server performance issues early. In that way, you will be able to react promptly to avoid further degradation of server performance. As for the server, the baseline represents a snapshot of the server’s performance under a typical workload, enabling the compilation of a detailed report about the server’s overall performance.
This chapter then concludes with an exercise on performance logs and alerts. In a nutshell, the following topics will be covered in this chapter:
- Understanding server hardware components
- Understanding performance monitoring
- Understanding logs and alerts
- Chapter exercise—working with the Performance Logs & Alerts service
Technical requirements
To complete the lab for this chapter, you will need the following equipment:
- A PC with Windows 11 Pro, at least 16 gigabytes (GB) of random-access memory (RAM), 1 terabyte (TB) of hard disk drive (HDD), and access to the internet
- A virtual machine (VM) with Windows Server 2022 Standard, at least 4 GB of RAM, 100 GB of HDD, and access to the internet
Understanding server hardware components
From a technical point of view, a server is nothing more than a computer. As you open up the computer’s case, you will notice various components that make up the computer’s internal hardware. In computer jargon, these parts are called hardware components—in our case, the server’s hardware components.
Now, the question arises: why should we pay that much attention to these hardware components? Does this sound like the right question? First, let me remind you of something you may already know! A server’s primary task is not data processing; the server’s role (see Chapter 6, Adding Roles to Windows Server 2022) includes providing network services and handling user requests to access services. That is why you should know the server hardware and pay attention when selecting the server’s hardware.
With that in mind, let’s examine server hardware components, their roles, and their impacts on a server’s performance to strengthen further the assertion that considerations should be made when dealing with server hardware.
Processor
Among the many internal components of the processor’s architecture (shown in Figure 10.1), there is no doubt that speed is one of the determining factors in choosing a suitable processor. The processor’s speed is measured in hertz (Hz). Today’s processor speeds are measured in gigahertz (GHz). However, as noted at the beginning of this section, speed is just one crucial component among others when choosing a processor. Therefore, we would be mistaken if we relied only on the speed factor. Thus, the following factors should also be considered:
- Cache refers to the processor’s memory. The larger the cache capacity, the more data can be retrieved from the memory to be processed. As such, cache memory is essential to the performance of the central processing unit (CPU). Modern processors have three types of cache: L1, L2, and L3, where L stands for level. While L1 and L2 are inside the processor’s architecture, L3 is outside. Therefore, their numbers determine the speed of each cache memory.
- Core refers to the processor’s processing unit. In the past, processors had just one core. Today, processors have two, four, eight, or more cores. Thus, to better understand the cores in a processor, consider mounting two processors in a single package where each processor would be presented through its core. Does that make sense? Of course, in this case, we would have a dual-core processor. So, the more cores a processor has, the more multiprocessing is done.
- Word size has to do with the processor’s internal architecture that defines the data bus size, the instruction size, and the address size. Today, there are 32-bit and 64-bit processors. These numbers determine the processor’s word size and the amount of data the processor receives from the memory to be processed and sent back to the memory.
- Registers refer to the processor’s high-speed memory. They usually have a small capacity but are very high-speed and store small amounts of data needed during processing, such as the address of the next instruction to be executed. Since speed was mentioned, registers are considered the fastest component, not just inside the processor alone but in the computer system.
- Virtualization technology refers to the processor’s ability concerning the virtualization concept, if the processor supports virtualization, where many operating systems simultaneously share processor resources efficiently.
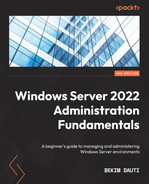
- You can see an example of quad-core processors in the following screenshot:
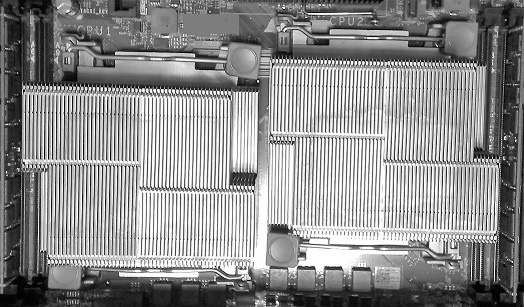
Figure 10.1 – Intel’s Xeon quad-core processors
No doubt, a processor plays a significant role in a server; however, it will not be able to function without memory. So, let’s learn more about memory.
Memory
The primary storage is a hardware component that temporarily stores data, allowing the processor to access data quickly and acting as a communication bridge between applications and peripheral devices. Both RAM and read-only memory (ROM) are the computer’s primary storage. While the former is volatile, the latter is considered to be non-volatile.
We can get more on the characteristics of these two types of primary storage from the following table:
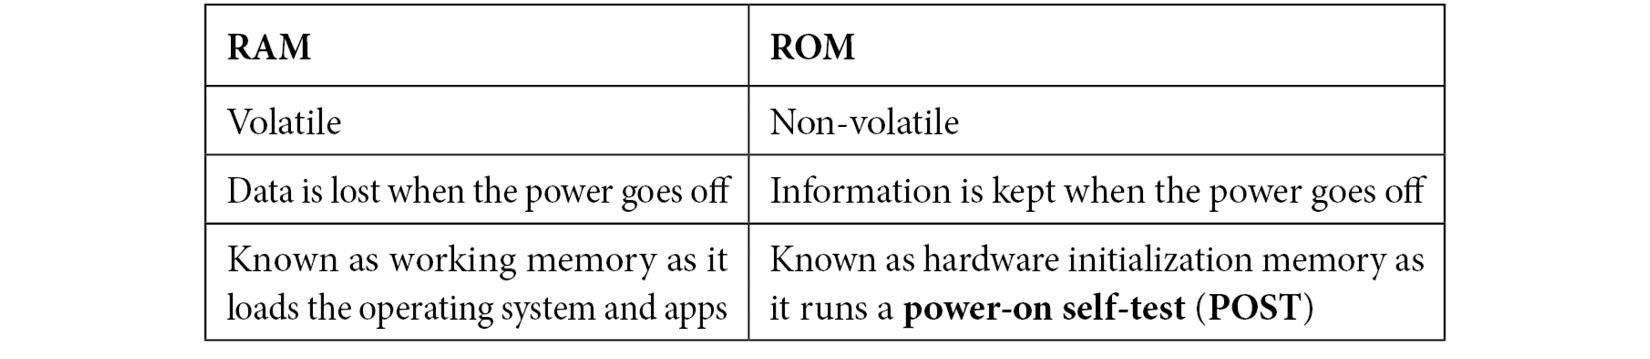
Table 10.1 – RAM versus ROM
Every computer is equipped with RAM. However, when it comes to servers, while the physical size of the server's RAM module may seem to be almost the same as that for PCs (see Figure 10.2), the chips in a memory module are not of the same number. Instead, the server’s RAM modules have one chip more. That is because usually, servers use a type of RAM called error-correcting code (ECC) memory. ECC RAM enables the detection and correction of memory errors. Other advanced types of RAM for servers include single-device data correction (SDDC) and double-device data correction (DDDC), which enable multiple memory errors to be detected and corrected simultaneously. However, with all of these advantages of RAM modules for servers, one disadvantage is their price. RAM for servers is generally expensive due to the characteristics mentioned in this section.
In the following screenshot, you can see an example of ECC RAM modules placed in memory banks:
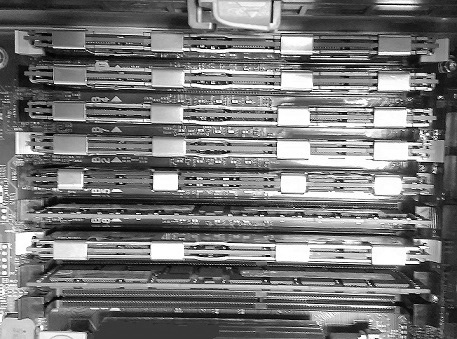
Figure 10.2 – ECC RAM modules placed in memory banks
While RAM is considered primary storage and is volatile, the disk is regarded as a secondary memory and is non-volatile. Therefore, let’s learn more about the disk next.
Disk
As you may already know, servers must be up and running most of the time. Additionally, data stored on a server’s disks (see Figure 10.3) and services should be available to users. Therefore, for servers to be operational, they must have hardware that enables such a requirement. That said, servers are equipped with so-called direct-attached storage (DAS). As outlined in Chapter 9, Storing Data in Windows Server 2022, DAS is a group of disks connected to the server. Moreover, hot-swappable technology replaces the damaged disk with a new disk while the server is running. These and other features make the server a machine that provides high availability (HA) of data and services.
In the following screenshot, you can see an example of SAS HDDs:
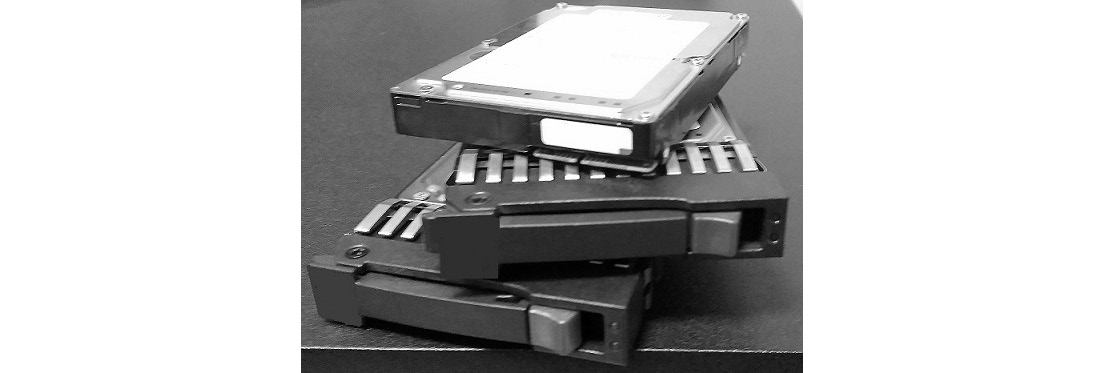
Moving forward, let’s get to know the network interface.
Network interface
As the name implies, a network interface is the connection point between the computer and the network. From that, a network interface is not meant to be just a physical representation but can also be logical because, as such, it is in VMs represented by software. Servers usually have more than one network interface (see Figure 10.4). You must consider adding network interface cards (NICs) to the server if they do not. Being equipped with multiple NICs presents tremendous benefits. Some of these server benefits are outlined here:
- NIC teaming enables you to increase bandwidth from/to the server.
- Network Load Balancing (NLB) allows you to distribute the network load across servers.
- Network separation enables you to separate intranet traffic from internet traffic.
You can see an example of server network interfaces here:

Figure 10.4 – Server network interfaces
Usually, a network interface represents a physical port, while network architecture represents a computer network design. Let’s get acquainted with 32-bit and 64-bit architectures next.
32-bit and 64-bit architectures
At first glance, it may seem like there is only a difference in numbers, but in reality, there is more than that in the background. Thus, in computers, the difference between 32-bit and 64-bit depends on processing power. As a first finding, it can be said that computers with 32-bit processors are mainly considered legacy computers, while computers with 64-bit processors are considered modern because they are fast and secure. Further, since computers are digital and use a binary number system, a 32-bit processor will access 232 data from RAM, while a 64-bit processor will access 264 data from RAM. And that for sure is a significant difference in processing power!
On a computer with a 64-bit processor, 32-bit and 64-bit applications can be installed, but not on computers with a 32-bit processor. As for security, driver signing is mandatory on computers with 64-bit processors (remember that driver signing is covered in Chapter 4, Post-Installation Tasks in Windows Server 2022), ensuring that its installation will not cause any reliability or security issues. From all that was said and other essential considerations, the recommendation is to consider 64-bit hardware for the server without compromising 64-bit software such as the operating system, applications, device drivers, and other utilities. All this enables an increase in the overall performance of the server.
In general, the secondary memory in computers is fixed (that is, non-removable); however, there are also removable storage technologies. So, let’s take a closer look at removable drives.
Removable drives
First, the removable drive is considered both external and portable storage technology that can be plugged into and unplugged from the computer while running. Furthering the concept of hot-swappable technology (explained earlier in the Disk section of this chapter) enables removable drives to be plugged into servers using Universal Serial Bus (USB) and Institute of Electrical and Electronics Engineers (IEEE) 1394 ports. Thus, CDs, DVDs, HDDs, floppy drives (an obsolete technology), USB flash drives, and backup drives are some of the removable storage technologies used with servers.
The server might sometimes require a graphics card to process video data. Let’s learn more about that in the next section.
Graphics cards
Generally speaking, servers are backend computing machines and, hence, do not necessarily have advanced graphics cards. That is because we are dealing with the client/server architecture, where the server is usually considered the backend. Regardless, everything depends on the purpose that the server serves. So, if a server is involved in graphics and video processing, it might require an advanced graphics card, as shown in Figure 10.5. From that, a graphics card—often called a video card or graphic adapter—is an internal hardware component that makes images appear on the screen. Thus, advanced graphics cards are widely used for games, 3D animation, AutoCAD, Archicad, and others types of computer work. It is worth mentioning that modern graphic cards contain processors called graphics processing units (GPUs) and memory called video memory. That is also evident in the graphic card presented in the following screenshot:
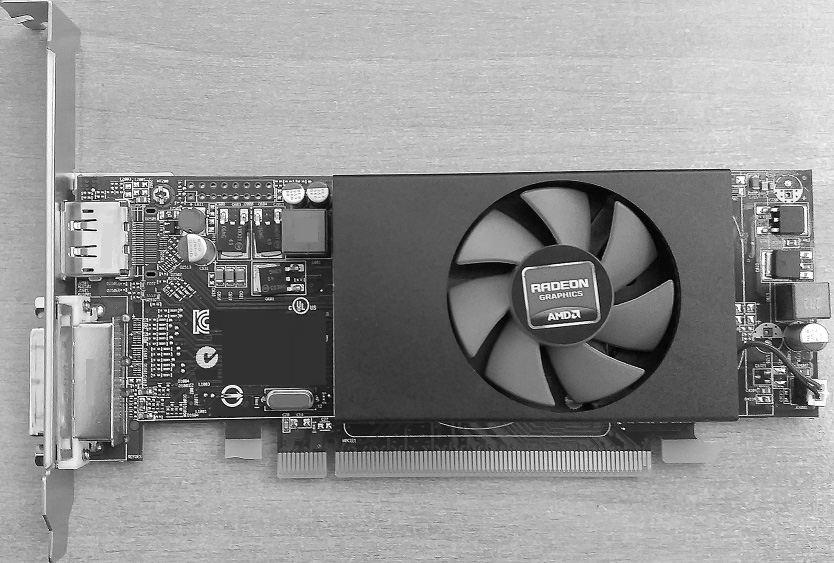
Figure 10.5 – AMD’s Radeon video graphics adapter
Sometimes, servers may heat up while processing heavy loads, thus coolers are required to keep the system optimally cooled. Let’s learn more about that in the following section.
Cooling
Without excluding other server components, processors and HDDs are the hardware components that generate the most thermal heat. Therefore, in addition to processor coolers, servers are also equipped with multiple additional coolers known as case coolers, often called case fans, as shown in the next screenshot. As the name suggests, a case cooler is an electric fan that draws the thermal heat out of the computer case by blowing it. As mentioned earlier, servers have internal components that generate extreme thermal heat. Therefore, in addition to electric fans in the power supply, case coolers—often in racks—are installed as additional coolers to maintain the optimum temperature of servers mounted in the rack. Additionally, air conditioners maintain the optimum temperature in the server room and data centers:
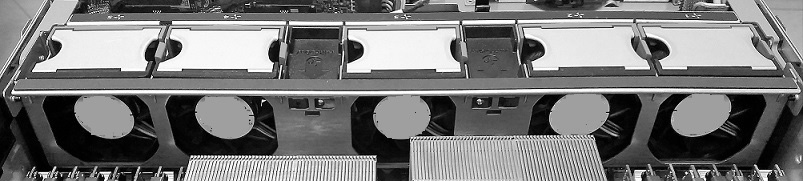
Figure 10.6 – A cooling system in a server’s case
Moving forward, let’s understand how a server uses a power supply.
Power supply
As with any server hardware component we have mentioned so far, the power supply is considered a crucial component that takes alternating current (AC) from the wall outlet, converts it to direct current (DC), and supplies the motherboard, adapters, and peripheral devices. In addition to providing power to the server, another role of the power supply is to reduce the voltage by using an input power transformer, usually by lowering it to the voltage required by the load. The load here is expressed by internal components such as multiple processors and disks, network interfaces, large motherboards, graphic cards, redundant array of independent disk (RAID) cards, optical drives, backup tapes, and so on. These are considered regular power consumers. Then, another power supply role is to provide cooling and facilitate airflow through the case. Because power supplies are considered a single point of failure (SPOF), servers are equipped with redundant power supplies. Therefore, depending on a server’s form factor, most servers are equipped with two or more power supply units (PSUs), as shown in the following screenshot. Even more important is that these power supplies have hot plugs that enable replacing the one that failed while the server is working:
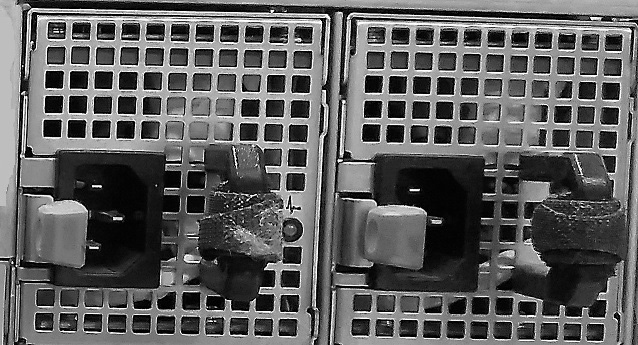
Figure 10.7 – A server's PSUs
Finally, let’s learn about physical ports and their relevance to a server.
Physical ports
Due to the server’s different components, having multiple and diverse physical ports is natural. Thus, each physical port has a specific role. But the question is, what is a physical port? A physical port is a communication point that allows us to connect cables to the computer. Therefore, as noted so far, it is a characteristic of servers to have multiple physical ports. Some of the ports (see the following screenshot) located at the rear of servers include AC power connectors, Ethernet ports, Peripheral Component Interconnect Express (PCIe) ports, USB ports, high-density-15 (HD-15) video connectors, management ports, and (although rarely seen nowadays) legacy ports such as serial ports, parallel ports, and Personal System/2 (PS/2) ports:
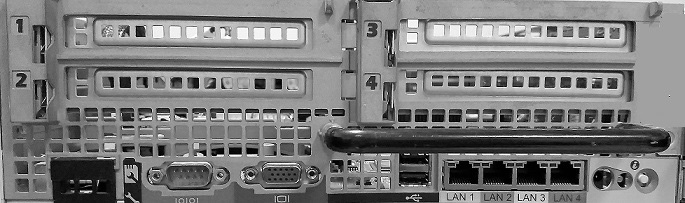
Figure 10.8 – Various ports to connect a variety of devices
This section has enabled you to get acquainted with various server hardware components and understand the difference between 32-bit and 64-bit architectures. In addition, the following section will help you to learn about monitoring the server’s performance.
Understanding performance monitoring
If we consider the saying “prevention is better than cure” and apply this to server maintenance, we will understand how vital performance monitoring is. Monitoring the server’s performance helps identify server problems at an early stage of occurrence. Then, the appropriate measures can be taken to prevent issues from becoming costly in both time and business.
A clear plan with the right tools is required for effective performance monitoring. That also means setting up a metric by which performance monitoring will be measured. Such a metric needs baseline information that will help evaluate the actual performance of servers, determine when hardware and software upgrades are needed, and assess whether an upgraded system is working better than the previous one.
Important note
Microsoft’s TechNet website, https://technet.microsoft.com/en-us/, provides valuable information about Microsoft products, including monitoring.
Let’s understand the performance monitoring methodology in a bit more detail.
Performance monitoring methodology
So far, we have learned that performance monitoring keeps the server healthy. However, if there is no clear plan for its implementation, the results obtained from performance monitoring will be based on multiple assumptions. From a business perspective, the wrong data results in bad business decisions. Simply put, performance monitoring must be based on facts and not assumptions. An approach known as a performance monitoring methodology is used to prevent that from happening.
In that regard, the performance monitoring methodology helps in conducting research. A questionnaire is modeled to understand the process and achieve a goal. For that reason, you need to make sure that your questionnaire contains questions including the following:
- What is the purpose of the server?
- What are the services that the server is providing?
- Which components do you want to monitor?
- What is the metric of component performance?
- Which tool will you use for system analysis and data collection?
Important Note
You can read more about monitoring and tuning servers at https://msdn.microsoft.com/en-us/library/bb742410.aspx.
Now, let’s take a look at performance monitoring procedures.
Performance monitoring procedures
From what has been said so far, it can be understood that the performance monitoring methodology helps develop procedures. In that instance, it has to do with server performance monitoring procedures that are well-structured activities. Thus, to monitor the server’s performance, you may want to consider the following guidelines:
- Document the server’s hardware, software, and configuration.
- Establish the server’s baseline.
- Upgrade the server’s hardware and software.
- Perform the server’s baseline and compare that with previous baselines .
- Identify server bottlenecks.
- Take concrete steps to fine-tune the server’s performance.
Before implementing these procedures, we need to implement a baseline first. So, let’s learn how to do that.
Server baselines
In general, a server’s performance must be monitored. Therefore, you should ask a few questions about server performance monitoring as a system administrator, which may include the following questions:
- How do you know when servers are working under their load?
- Do you have a sample to compare their performance against?
Questions such as these may encourage you to approach such activity with more dedication. However, before explaining how to establish a baseline and considering when to create a baseline, it is good to know: what is a baseline? In short, a server baseline represents a snapshot of a server’s performance under a normal workload. It enables you to compile a detailed report on the performance of various server components under normal workload conditions. Without neglecting other server components, the main reason for a baseline is to collect the following performance information:
- Processor utilization
- Memory utilization
- Disk read-and-write operations
- Network connection utilization
That implies that performance monitoring is not solely confined to collecting information from the hardware, as mentioned earlier. Moreover, the fact that many computer networks serve different purposes strengthens the opinion that the parameters we monitor need to be different too.
Important note
As mentioned in the information box of the Processing GPOs section of Chapter 7, Group Policy in Windows Server 2022, be aware that Microsoft publishes new baselines. Hence, in April 2022, Microsoft released the security configuration baseline settings for Windows 11, Windows 10 version 21H2, and Windows Server 2022. The new security baseline can be downloaded from https://www.microsoft.com/en-us/download/details.aspx?id=55319.
Performance Monitor
As the name indicates, Performance Monitor is a Windows Microsoft Management Console (MMC) program that monitors the server’s performance. It enables visualizing the performance information in real time or from a log file. In addition, the examined performance information is displayed in a line graph, histogram bar, or report format.
To run Performance Monitor in Windows Server 2022, complete the following steps:
- Press the Windows key + R.
- Enter perfmon.exe and press Enter.
- Shortly, a Performance Monitor window will appear, as shown in the following screenshot:
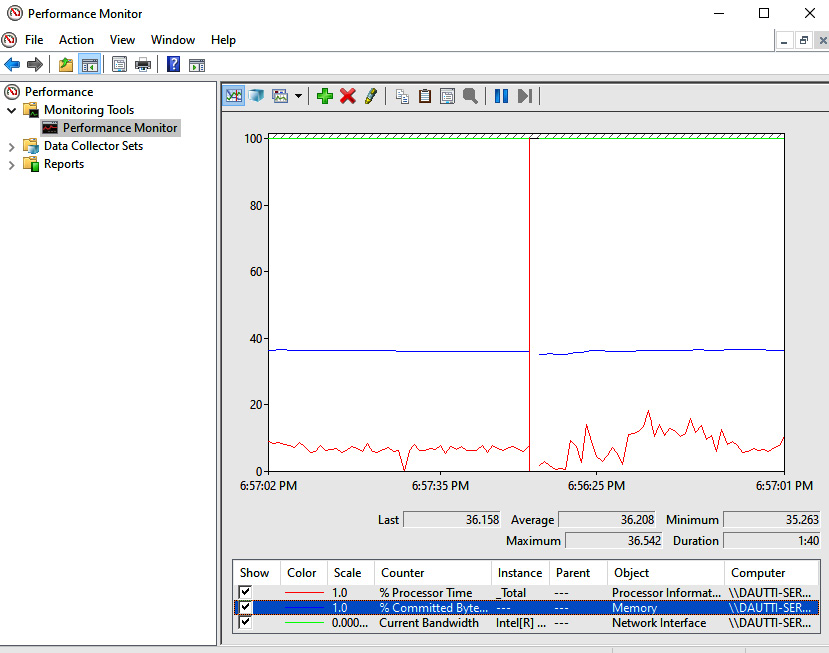
Figure 10.9 – Performance Monitor in Windows Server 2022
Tip
You can open Resource Monitor from within Performance Monitor.
Next, let’s learn about Resource Monitor, an alternative to Performance Monitor.
Resource Monitor
If you have owned a computer with a Windows operating system for a while now, it may have happened that just recently, you started to feel that it is working slower than when you first bought it. Regardless, you do not need to worry because you can use Resource Monitor to determine the cause of your computer’s slow performance. The same thing happens with servers too. So, whenever it is proven that server performance has decreased considerably, Resource Monitor is at your disposal to view real-time usage of both hardware and software resources.
To run Resource Monitor in Windows Server 2022, complete the following steps:
- Press the Windows key + R.
- Enter resmon.exe and press Enter.
- Shortly, a Resource Monitor window will appear, as shown in the following screenshot:
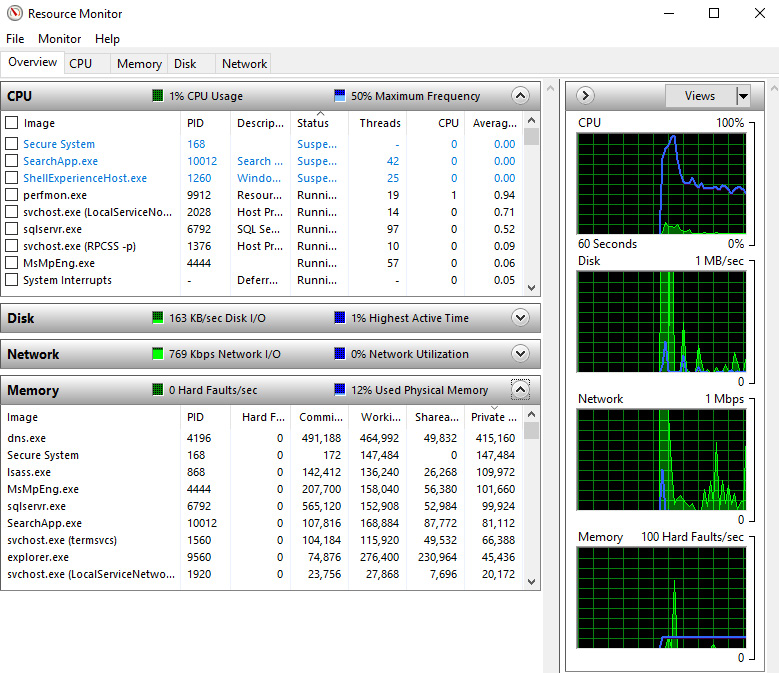
Figure 10.10 – Resource Monitor in Windows Server 2022
Besides Performance Monitor and Resource Monitor, Task Manager is an essential monitoring tool. So, let’s quickly learn about it.
Task Manager
In addition to Performance Monitor and Resource Monitor, Task Manager enables monitoring of processes, performance, and services currently running on a server. It allows users to start/stop applications and background processes. Moreover, it offers a visual representation in a summary and graph views regarding the server’s performance.
To run Task Manager in Windows Server 2022, complete the following steps:
- Right-click the taskbar and, from the context menu, select Task Manager.
- Shortly, a Task Manager window will appear, as shown in the following screenshot:
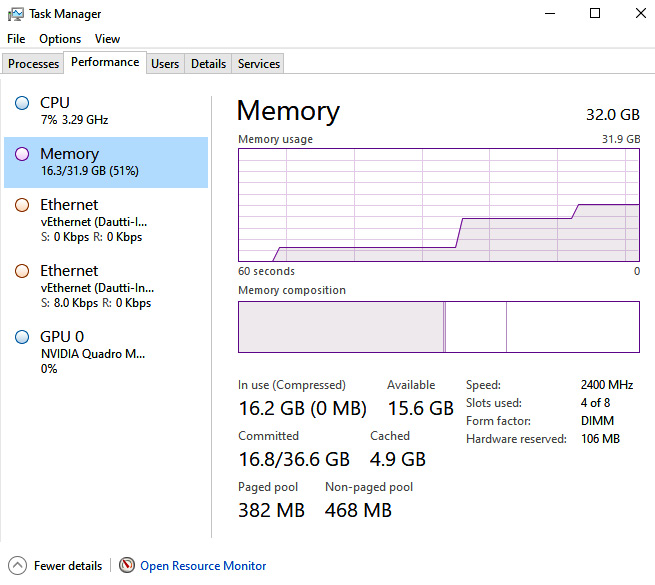
Figure 10.11 – Task Manager in Windows Server 2022
Important note
You can open Resource Monitor from within Task Manager as well.
Now, let’s understand performance counters and how to use them.
Performance counters
In Performance Monitor, you can use counters and instances of selected objects to collect data for the server hardware you are keeping your eye on. Counters provide performance information on how well an operating system, application, service, or driver is working. Objects have counters to measure different aspects of performance, where each object has at least one instance representing an individual copy of a particular type of object. That way, you can determine server bottlenecks and react promptly to avoid further degradation of server performance. Then, you can fine-tune the server’s performance by undertaking the appropriate measures. The following section will walk you through setting up a Data Collector Set.
Setting up Data Collector Sets
To set up a Data Collector Set in Windows Server 2022, complete the following steps:
- With the Performance Monitor window open, expand Monitoring Tools and select Performance Monitor.
- Right-click Performance Monitor and select New | Data Collector Set.
- Enter the name for your Data Collector Set and click Next.
- Specify where you want to save it by clicking Browse and Next.
- Set the User in Run option and select either Start this data collector set now or Save and close.
- Click Finish.
- Right-click Graph and select Add Counters....
- Select counters from the Available counters section and click the Add button to add them to the list in the Added counters section.
- Repeat step 8 to add more counters, as shown in the next screenshot.
- Click OK to close the window:
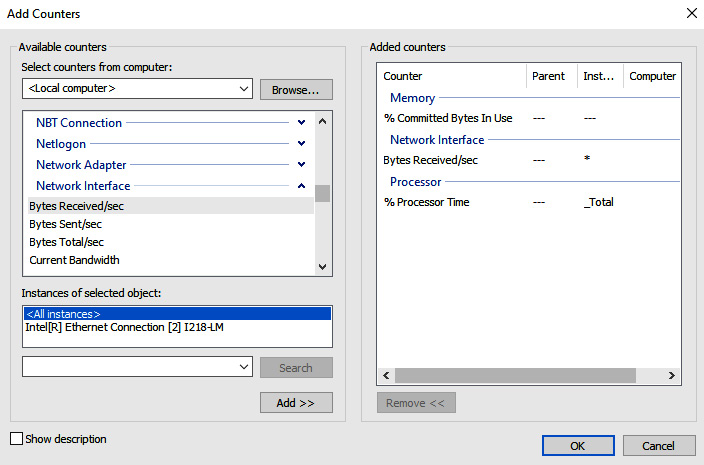
Figure 10.12 – Performance Monitor counters in Windows Server 2022
Important note
You can find information about performance monitoring thresholds and other helpful information for various technologies at https://www.manageengine.com/network-monitoring/network-performance-monitoring.html.
This section has taught you how to monitor server performance. In the next section, we will learn about logs and alerts.
Understanding logs and alerts
It is worth mentioning that performance monitoring activities are ongoing. As such, this requires dedication and patience from system administrators. However, it’s necessary to recognize the importance of the performance monitoring methodology to maintain a server’s ongoing operations, and the correct tools must be used to keep the server up and running. For that reason, tools such as logs and alerts play an essential role in that process. While logs are helpful for detailed analysis and record archiving, alerts enable system administrators to be informed on time about occurrences, thus taking the right actions to maintain the server’s up-and-running status.
With Performance Monitor, a system administrator can collect performance information, log that information automatically, and set up alerts. The logged performance information can then be used for analysis or exported to a spreadsheet or a more advanced analytical program for subsequent analysis and reporting. To configure performance logs and alerts in Windows Server 2022, use the approach outlined in the following section.
In this short section, we have learned about performance logs and alerts. In the next section, you will carry out this chapter’s performance logs and alerts exercise.
Chapter exercise – working with the Performance Logs & Alerts service
In this exercise, you will learn how to start the Performance Logs & Alerts service, access the Performance Monitor logs folder, create performance data logs, and set up performance counter alerts.
Starting the Performance Logs & Alerts service
To start the Performance Logs & Alerts service in Windows Server 2022, complete the following steps:
- Press the Winkey + R.
- Enter services.msc and press Enter.
- From the list of services, locate the Performance Logs & Alerts service (see Figure 10.13) to check its status.
- If it is stopped, then right-click and select Start.
- Close the Services window.
You can see an overview of the Services window in the following screenshot:
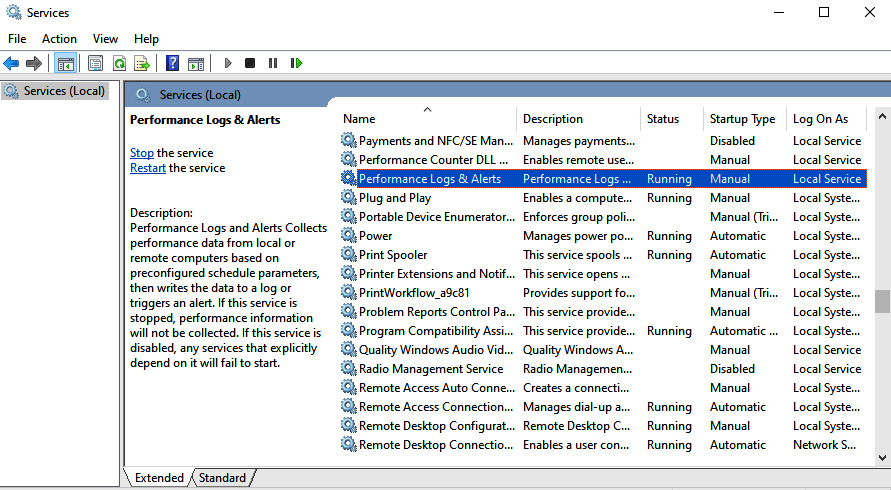
Figure 10.13 – Performance Logs & Alerts service in Windows Server 2022
Now that we have started the Performance Logs & Alerts service, let’s move on to our next task of accessing the Performance Monitor logs folder.
Accessing the Performance Monitor logs folder
To access the Performance Monitor logs folder, PerfLogs, in Windows Server 2022, complete the following steps:
- Press the Windows key + R.
- Enter C: and press Enter.
- The PerfLogs folder appears, as shown in the following screenshot:
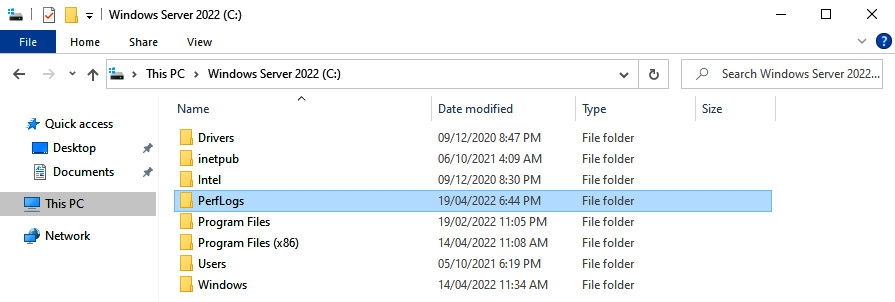
Figure 10.14 – PerfLogs folder in Windows Server 2022
Let’s now create some performance data logs using Performance Monitor.
Creating performance data logs
To create performance data logs in Windows Server 2022, complete the following steps:
- With Performance Monitor open, expand Data Collector Sets and select User Defined.
- Right-click User Defined and select New | Data Collector Set.
- Enter the name for your Data Collector Set.
- Choose the Create manually (Advanced) option and then click Next.
- Choose the Create data logs option and the Performance counter sub-option, then click Next.
- Click the Add… button to add counters, as shown in the following screenshot, specify a time interval, and then click Next:
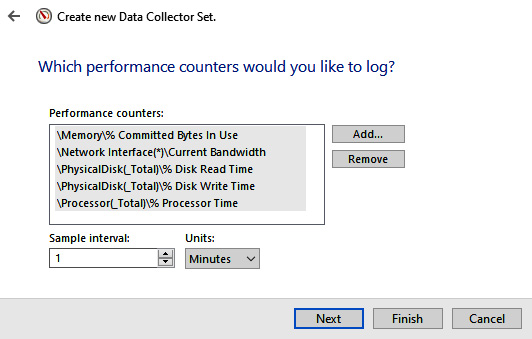
Figure 10.15 – Adding performance counters
- Check that the default folder for saving data logs is the PerfLogs folder, and then click Next.
- Set the User in Run option and select the Start this data collector set now option.
- Click Finish.
Let’s now set up performance counter alerts and complete this exercise.
Setting up performance counter alerts
To set up a performance counter alert in Windows Server 2022, complete the following steps:
- Repeat steps 1 to 4 from the Creating performance data logs section.
- Choose Performance Counter Alert, and then click Next.
- Click the Add… button to add counters, as shown in the following screenshot, specify an alert limit, and then click Next:
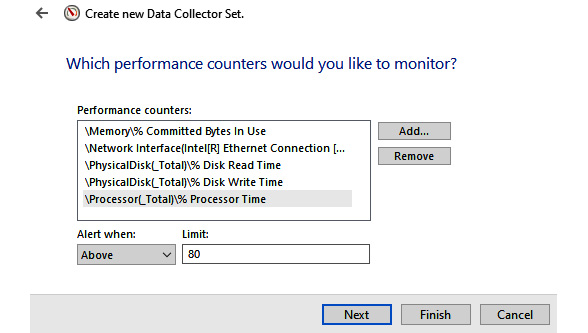
Figure 10.16 – Setting up a performance counter alert
- Set the User in Run option and select the Start this data collector set now option.
- Click Finish.
That was an excellent exercise as it covered various examples of performance logs and alerts in Windows Server 2022.
Summary
In this chapter, you have learned about a server’s hardware components and how to maintain and monitor a server’s performance through Windows Server 2022 native tools and utilities.
This module provided valuable information on server hardware, including key components such as processor, memory, disk, and network. In addition, using Performance Monitor, Resource Monitor, Task Manager, and performance counters will help monitor the server’s performance, specifically server hardware performance.
Finally, the chapter concluded with an exercise that provided instructions to run the Performance Logs & Alerts service.
The next chapter will teach you about updating and troubleshooting Windows Server 2022.
Questions
Provide answers to the following questions:
- Servers provide network services and handle user requests to access services. (True | False)
- ________ represents a snapshot of the server’s performance under a normal workload.
- Which of the following is related to processors? (Choose two)
- Cache
- Cores
- NIC teaming
- Hot-swap
- Task Manager enables you to monitor the server’s processes, performance, and services currently running. (True | False)
- ________ is the hardware that generates the most thermal heat.
- Which of the following benefits from having multiple NICs on the server? (Choose two)
- NLB
- Network separation
- Word size
- Virtualization technology
- Because power supplies are not considered a SPOF, servers are not equipped with a redundant power supply. (True | False)
- ________ has to do with the processor’s internal architecture and defines the data bus size, the size of the instructions, and the address size.
- Which of the following Windows MMCs programs are used for performance and resource monitoring? (Choose two)
- Performance Monitor
- Resource Monitor
- Server Manager
- Device Manager
- Counters provide performance information on how well an operating system, application, service, or driver works. (True | False)
- ________ helps identify server problems at an early stage of development and take the necessary steps to prevent them from turning into costly issues in terms of time and business.
- Which of the following are considered to be a server’s primary storage? (Choose two.)
- RAM
- ROM
- HDD
- USB flash drive
- Discuss Performance Monitor and Resource Monitor.
- Discuss performance logs and alerts.
Further reading
For further information, have a look at the following resources:
- Hardware requirements for Windows Server: https://docs.microsoft.com/en-us/windows-server/get-started-19/sys-reqs-19
- Server Hardware Performance Considerations: https://docs.microsoft.com/en-us/windows-server/administration/performance-tuning/hardware/
- How to: Use Performance Monitor to Collect Event Trace Data: https://docs.microsoft.com/en-us/dynamics365/business-central/dev-itpro/administration/monitor-use-performance-monitor-collect-event-trace-data