
Use XSLT and SVG to offset points in X-Y scatterplots so they do not plot on top of each other.
If you need to create an X-Y scatterplot from XML data, XSLT and SVG make a winning combination. But sometimes several points have the same X,Y coordinates and fall on top of each other. You can’t tell that there is more than one. This is most likely to happen with so-called categorical data, in which the categories get translated to integer values, as in this example:
Unsatisfied          = 0
Slightly satisfied   = 1
Moderately satisfied = 2
Satisfied            = 3
A time-honored way for handling this problem is to dither the points by adding small random offsets to their X and Y positions. But XSLT 1.0 does not provide a random function, so how can you get the random values to add to the points?
Dimitre Novatchev has created an elegant method for generating random sequences based on his functional programming templates for XSLT. (See his work at http://fxsl.sourceforge.net/articles/Random/Casting%20the%20Dice%20with%20FXSL-htm.htm.) Dimitre’s approach is elegant but complex. There is a simpler way, a real hack in the best sense of the word.
In the XSLT stylesheet that will turn your source data into SVG, insert two random strings of digits, one for the X-axis offset and one for the Y-axis. This fragment of an XSLT stylesheet shows what they might look like:
<!--=  =  =  =  =  = Random digits for the X- and Y- axes  =  =  =  =  =  =  =-->
<xsl:variable name='ditherx'
   select='3702854522015844305808889564635884085342'/>
<xsl:variable name='dithery'
   select='5818255782986735059479247335208010636341'/>
You can just copy random strings from the fragment shown here, or you can use most any standard programming language to create the random strings. With Python, you can use this code:
import random
result = ''
for n in range(40):
   result = result + str(random.randrange(10))
print result
Now you just index into the string to get a random digit.
The source data looks like this in XML (dither_data.xml):
<data>
  <point x="1" y="1"/>
  <point x="1" y="2"/>
  <point x="1" y="2"/>
   <!-- ... more points ... -->
</data>
The stylesheet sets up the SVG definitions, such as the gridlines and the shape of the points. Then it extracts the data, scales it, gets the offsets and adds them, and finally creates the SVG elements to display the points (dither2svg.xsl in Example 3-47).
Example 3-47. dither2svg.xsl
<?xml version="1.0" encoding='utf-8'?>
<!--=  =  =  =  =  =  =  =  =  =  =  =  =  =  =  =  =  =  =  =  =  =  =  =  =  =  =  =
 =  =  =  =  =  =  =  =  =  =  =  =  =  =  =  =  =  =  =  =  =  =  =  =
    dither2svg.xsl
    Purpose:
        Prevent points of a scatterplot that have the same
        values from falling exactly on top of each other.
    Author: Thomas B Passin
    Creation date: 7 March 2004
=  =  =  =  =  =  =  =  =  =  =  =  =  =  =  =  =  =  =  =  =  =  =  =  =  =  =
 =  =  =  =  =  =  =  =  =  =  =  =  =  =  =  =  =  =  =  =  =  =  =  =  =-->

<xsl:stylesheet version="1.0"
    xmlns:xsl="http://www.w3.org/1999/XSL/Transform"
    xmlns="http://www.w3.org/2000/svg"
    xmlns:xlink="http://www.w3.org/1999/xlink">

<!--
    NOTE - indent='yes' is just there to make the
    output more readable.  It is not necessary
    for the functionality.
-->
<xsl:output encoding='utf-8' indent='yes'/>

<!--=  =  =  =  =  = Random digits for the X- and Y- axes  =  =  =  =  =  =  =-->
<xsl:variable name='ditherx'
   select='3702854522015844305808889564635884085342'/>
<xsl:variable name='dithery'
   select='5818255782986735059479247335208010636341'/>
<!--=  =  =  =  =  =  =  =  =  =  =  =  =  =  =  =  =  =  =  =  =  =  =  =  =  =  =  =
 =  =  =  =  =  =  =  =  =  =  =  =  =  =  =  =  =  =  =  =  =  =  =  =-->

<!--=  =  =  =  =  =  =  =  =  =  =  =  = Root template =  =  =  =  =  =  =  =  =  =  =
  =  =-->
<xsl:template match='/data'>
<svg xmlns="http://www.w3.org/2000/svg"
    height='500' width='500'
    xmlns:xlink="http://www.w3.org/1999/xlink">

    <!--
        All the SVG setup is done by the svg-defs template.
    -->
    <xsl:call-template name='svg-defs'/>

    <!--
        Our graph should grow upwards from the lower left,
        but SVG coordinates grow downwards from the upper
        left.  So we scale the y-axis by -1 to invert it, and
        shift the whole curve down to the lower left.
    -->
    <g transform='translate(50,450) scale(1,-1)'>
        <use xlink:href='#axis'/>
        <use xlink:href='#gridlines'/>
        <xsl:apply-templates select='point'/>
    </g>
</svg>
</xsl:template>
<!--=  =  =  =  =  =  =  =  =  =  =  =  =  =  =  =  =  =  =  =  =  =  =  =  =  =  =  =
 =  =  =
 =  =  =  =  =  =  =  =  =  =  =  =-->

<!--=  =  =  =  =  =  =  =  =  =  = Plot each point =  =  =  =  =  =  =  =  =  =  =  =
 =  =  =-->
<xsl:template match='point'>

    <!--
        The random digits range from 0 to 9, which is a little
        small for the desired offset, so we scale them by 2.
        A factor of 3 would also work.

        We don't want all the offsets to be in the same
        direction, so we subtract 10 (if we scaled by 3,
        we would subtract 15, and so on).

        We use the position of the point in the source
        document to index into the random strings.  There
        cannot be more points than there are digits in
        the strings! But if there are, a slight modification
        can handle it (see later commentary).
    -->
    <xsl:variable name='offsetx'
        select='2*substring($ditherx,position( ),1) - 10'/>
    <xsl:variable name='offsety'
        select='2*substring($dithery,position( ),1) - 10'/>

    <!--
        Scale the points by 100 to match our SVG drawing
        area, which is 500 by 500.
    -->
    <xsl:variable name='x' select='100*@x'/>
    <xsl:variable name='y' select='100*@y'/>

    <!--
        Here we output the SVG instruction to render
        the point.  Note the use of attribute value templates
        (in the curly braces).
    -->
    <use xlink:href="#dot"
        transform="translate({$x  + $offsetx},{$y + $offsety})"/>
</xsl:template>
<!--=  =  =  =  =  =  =  =  =  =  =  =  =  =  =  =  =  =  =  =  =  =  =  =  =  =  =  =
=  =  =  =  =  =  =  =  =  =  =  =  =  =  =-->

<!--=  =  =  =  = SVG definitions for dot shape and grid lines =  =  =-->
<xsl:template name='svg-defs'>
   <defs>
      <circle id="dot" r="4"
        style="stroke:black; stroke-width:1; fill:none"/>

      <g id='axis'>
          <polyline points='-10,0 410,0'
            style='stroke:black;stroke-width:1'/>
          <polyline points='0,-10 0,410'
            style='stroke:black;stroke-width:1'/>
      </g>

      <g id='xgridline'>
          <polyline points='-10,0 410,0'
            style='stroke:gray;stroke-width:0.5'/>
      </g>

      <g id='ygridline'>
          <polyline points='0,-10 0,410'
            style='stroke:gray;stroke-width:0.5'/>
      </g>

      <g id='gridlines'>
          <use xlink:href='#xgridline' x='0' y='100'/>
          <use xlink:href='#xgridline' x='0' y='200'/>
          <use xlink:href='#xgridline' x='0' y='300'/>
          <use xlink:href='#xgridline' x='0' y='400'/>

          <use xlink:href='#ygridline' x='100' y='0'/>
          <use xlink:href='#ygridline' x='200' y='0'/>
          <use xlink:href='#ygridline' x='300' y='0'/>
          <use xlink:href='#ygridline' x='400' y='0'/>
      </g>
   </defs>
</xsl:template>
<!--=  =  =  =  =  =  =  =  =  =  =  =  =  =  =  =  =  =  =  =  =  =  =  =  =  =  =  =
=  =  =  =  =  =  =  =  =  =  =  =  =  =  =  =  =  =  =  =  =  =  =  =  =  =  =  =
=  =-->

</xsl:stylesheet>
If there are more points than there are digits in the random strings,
we have to modify the code slightly to avoid indexing past the end of
the string. We do this by using the mod operator.
If we use a different mod value for the X and Y
strings, they will not roll over at the same places. The effect is to
act as if the random strings were much longer. Here is the modified
part:
<xsl:variable name='offsetx' select='2*substring($ditherx,1+ position( ) mod 39,1) - 10'/>
<xsl:variable name='offsety' select='2*substring($dithery,1+ position( ) mod 37,1) - 10'/>
It is better to use mod values that are relatively
prime, as shown here. We have to add 1 because the
mod operation can return 0, but XSLT indexes into
strings starting at 1.
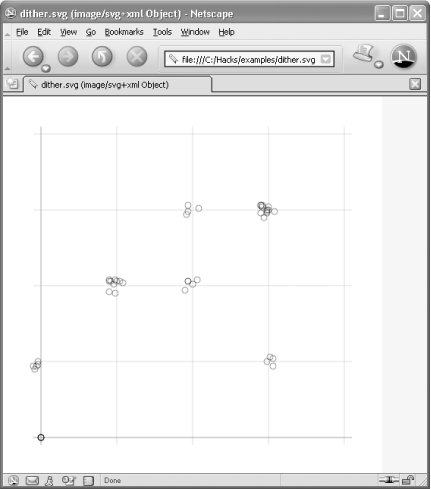
Prepare some source data or use the included file dither_data.xml. In the following, we use the Instant Saxon XSLT processor. Assuming that Saxon is on your path and that both the data and stylesheet are in the current working directory, type the following command:
saxon -o dither.svg dither_data.xml dither2svg.xsl
The resulting file, dither.svg , is shown in Example 3-48, and in Figure 3-28 it is shown in the Netscape 7.1 browser with the Corel SVG plug-in.
Example 3-48. dither.svg
<?xml version="1.0" encoding="iso-8859-1"?>
<svg height="500" width="500" xmlns="http://www.w3.org/2000/svg" xmlns:
xlink="http://www.w3.org/1999/xlink">
<defs>
<circle id="dot" r="4" style="stroke:black; stroke-width:1; fill:none" />
<circle id="filled-dot" r="4" style="stroke:black; stroke-width:1; fill:black" />
<g id="axis">
<polyline points="-10,0 410,0" style="stroke:black;stroke-width:1" />
<polyline points="0,-10 0,410" style="stroke:black;stroke-width:1" />
</g>
<g id="xgridline">
<polyline points="-10,0 410,0" style="stroke:gray;stroke-width:0.005%" />
</g>
<g id="ygridline">
<polyline points="0,-10 0,410" style="stroke:gray;stroke-width:0.005%" />
</g>
<g id="gridlines">
<use xlink:href="#xgridline" x="0" y="100" />
<use xlink:href="#xgridline" x="0" y="200" />
<use xlink:href="#xgridline" x="0" y="300" />
<use xlink:href="#xgridline" x="0" y="400" />
<use xlink:href="#ygridline" x="100" y="0" />
<use xlink:href="#ygridline" x="200" y="0" />
<use xlink:href="#ygridline" x="300" y="0" />
<use xlink:href="#ygridline" x="400" y="0" />
</g>
</defs>
<g transform="translate(50,450) scale(1,-1)">
<use xlink:href="#axis" />
<use xlink:href="#gridlines" />
<use xlink:href="#dot" transform="translate(4,106)" />
<use xlink:href="#dot" transform="translate(90,192)" />
<use xlink:href="#dot" transform="translate(94,206)" />
<use xlink:href="#dot" transform="translate(206,194)" />
<use xlink:href="#dot" transform="translate(300,100)" />
<use xlink:href="#dot" transform="translate(298,300)" />
<use xlink:href="#dot" transform="translate(300,304)" />
<use xlink:href="#dot" transform="translate(294,306)" />
<use xlink:href="#dot" transform="translate(194,294)" />
<use xlink:href="#dot" transform="translate(-10,108)" />
<use xlink:href="#dot" transform="translate(92,206)" />
<use xlink:href="#dot" transform="translate(100,202)" />
<use xlink:href="#dot" transform="translate(206,204)" />
<use xlink:href="#dot" transform="translate(298,96)" />
<use xlink:href="#dot" transform="translate(298,300)" />
<use xlink:href="#dot" transform="translate(290,290)" />
<use xlink:href="#dot" transform="translate(290,290)" />
<use xlink:href="#dot" transform="translate(190,290)" />
</g>
</svg>
—Tom Passin