
Galileo once wrote, "Count what is countable, measure what is measurable. What is not measurable, make measurable." This is still controversial advice 400 years later. In this chapter, we will look at what is countable by YouTube Insight and what is measurable by TubeMogul and Visible Measures. We'll also look at other tools that make measurable what is not measurable by these tools. But we will need to continue explaining, "The chart, of course, is nonrepresentational," until currently available metrics get more robust.
Chapter Contents:
The Map Room
Week 1: Trust YouTube Insight
Week 2: Verify with TubeMogul
Week 3: Verify with Visible Measures
Week 4: Build an Integrated Trinity Platform
Galileo once said, "Count what is countable, measure what is measurable. What is not measurable, make measurable." That was controversial advice 400 years ago, when the dominant view was geocentric (the Earth is the center of the universe), not heliocentric (the sun is the center of the solar system). In fact, Galileo's ability to make measurable Copernicus's heliocentric hypothesis, which was not measurable before telescopic observation, got Galileo in trouble with the Roman Inquisition.
Another historic figure who discovered how difficult it is to make measurable what is not measurable was Winston Churchill. At the beginning of World War II, Churchill inherited a navy that counted only capital ships and measured only victories over other fleets—pretty much the same as it had since the Battle of Trafalgar in 1805.
But Churchill understood that victory depended on getting a higher percentage of Allied convoys through German U-boats and surface raiders. So, in 1941, he coined the term Battle of the Atlantic to get the Admiralty to focus more attention on this strategic threat.
Churchill had a large map of the Atlantic Ocean hung on the southern wall in the Map Room down the hall from his War Cabinet Rooms. It was used to plot the position of convoys and the movements of individual warships—and the thousands of pinholes left by markers still mark the principal convoy routes, which could be seen from the other end of the room.
The Map Room remained open day and night, and the chief task of the officers manning this room was to collate and summarize all relevant information on the progress of the war and present it on maps, which would be constantly updated. In other words, Churchill required the map keepers to make as measurable as possible what was often not easily measurable.
This, in turn, kept the pressure on the chiefs of staff to develop new weapons, tactics, and countermeasures, which eventually drove the German surface raiders from the ocean by the middle of 1941 and decisively defeated the U-boats in a series of convoy battles between March and May 1943.
As Churchill wrote afterward, "The only thing that ever frightened me during the war was the U-boat peril.... It did not take the form of flaring battles and glittering achievements, it manifested itself through statistics, diagrams, and curves unknown to the nation, incomprehensible to the public."
Veteran marketers and new YouTubers are fighting similar battles today. Whether your YouTube video has 10 or 10 million views, you will want to know the answers to these questions: Who's watching this? Where do these viewers come from? How did they find my video?
The battles to answer these questions are part of a larger war to develop a successful web analytics strategy. If you want to learn web analytics the right way, I strongly recommend that you read Web Analytics: An Hour a Day by Avinash Kaushik (Sybex, 2007). His thought-provoking analysis of the challenges and opportunities facing today's web analytics challenges conventional wisdom and debunks popular myths.
If you like Kaushik's book, you'll love his blog, Occam's Razor. He also has a day job: Kaushik is the analytics evangelist for Google. And on the swing shift, he's the cofounder and chief education officer for Market Motive, where I'm also on the faculty. Like Galileo and Churchill, Kaushik is one of my heroes, and I try to apply his thought-provoking recommendations to video marketing.
So, in this chapter, we'll look at what is countable by YouTube Insight, what is measurable by TubeMogul and Visible Measures, and what is not measurable by these tools...yet. As Figure 10.1 illustrates, veteran marketers and new YouTubers need to explain to colleagues and clients, "The chart, of course, is nonrepresentational," until currently available metrics get more robust.

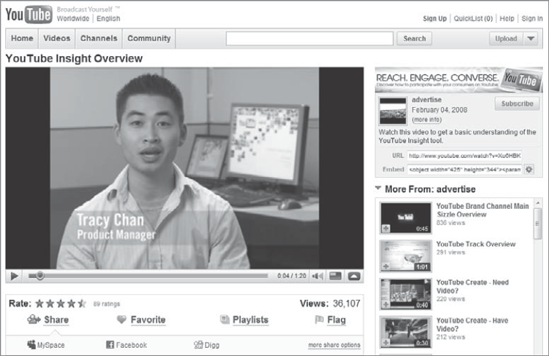
On March 26, 2008, Tracy Chan, product manager at YouTube, posted this item to the Official Google Blog: "I remember the first time a video I posted to YouTube cracked 100 views. I wasn't so much surprised as curious: Who were these people? How did they find this video? Where did they come from?"
Chan then announced YouTube's first step toward answering these questions by introducing YouTube Insight, a free analytics and reporting tool that enables anyone with a YouTube account to view detailed statistics about the audience for the videos that they upload to the site.
For example, uploaders can see how often their videos are viewed in different geographic regions as well as how popular they are relative to all videos in that market over a given period of time. Users, partners, and advertisers can also delve deeper into the life cycle of their videos, like what pages viewers were on before they navigated to a video, how long it takes for a video to become popular, and what happens to video views as popularity peaks.
Insight also gives video creators an inside look into the viewing trends of their audience on YouTube. This information can help video creators increase views and get better ratings. Partners can evaluate metrics to understand and better serve their audiences as well as increase ad revenue. And advertisers can study their metrics and successes to tailor their marketing—both on and off the video sharing site—in order to reach the right viewers. As a result, Insight turns YouTube into one of the world's largest focus groups.
How can this help you? Well, let's say you learn that new videos that play off your previous content become popular more quickly, your videos are most popular on Wednesdays and Thursdays, and you have a huge following in Canada. Using these metrics, there are some things you can do to increase your videos' view counts and improve the popularity of your channel:
Create compelling new content that appeals to your target audience.
Post these videos on days these viewers are on the site.
Post your next video in French as well as English.
Brad O'Farrell, the technical editor of this book, finds that Insight doesn't report much variation from video to video. He says, "Most of the time Insight just tells me that videos are extremely popular in areas that are more populated and that their views spiked up when they were featured. I'm hoping they'll eventually add a weighted Insight feature."
Brad notices that video views dip down near the end of the week, spike up on Sunday, then remain steady until about Thursday at MyDamnChannel's channel (www.youtube.com/MyDamnChannel), which features "original originality by comedians, filmmakers, musicians, and photoshoppers."
I notice that video views dip down near the weekend, spike up on Monday, then remain steady until about Thursday at SESConferenceExpo's channel (www.youtube.com/SESConferenceExpo), which is a global conference and training series focused on search engine optimization and search engine marketing.
So, your mileage may vary, but I agree with Brad that YouTube needs to continue adding features and functionality to Insight. In April 2009, YouTube added a link that allows you to export your Insight data into CSV files. CSV files are open-format files that organize data so it can be moved and analyzed using spreadsheet software such as Microsoft Excel and Google Docs.
As Figure 10.2 illustrates, Chan also uploaded a video that provides a basic understanding of the YouTube Insight tool.
Some of the features were made available fairly quickly—like the specific breakdown of how viewers discovered the video. Other features were rolled out over the first year. Let's take a closer look at some of the more important ones.
Monday: Count your video views
Tuesday: Measure your relative popularity
Wednesday: Discover how people find a video
Thursday: Determine the demographics of your audience
Friday: Figure out a video's hot spots
To see YouTube Insight for your own videos, simply sign into your YouTube account, then click on My Videos, and click the YouTube Insight link to check out this analytics and reporting tool.
As Figure 10.3 illustrates, the default is set to display a summary page that shows how many views your videos were getting in the past week, your top 10 videos for the week, the demographics of the people watching the videos in your channel, and how popular your videos are relative to those of other uploaders.

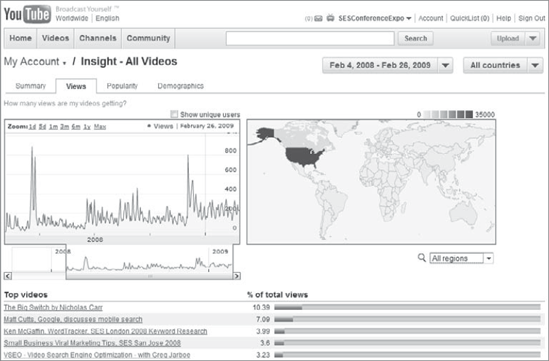
If you click the Views tab, you'll see video views charted on an interactive timeline and map, allowing you to drill down into different geographic regions and see the viewing activity in those regions over selected time periods.
The Views graph captures the viewing trend of all your videos or a particular video in a specific geographic market over a certain period of time. The aggregate data includes views from YouTube as well as from embedded videos, if you have embeds. You can see how views have trended over a period of time by clicking on and dragging various settings (1 day, 5 days, 1 month, 3 months, 6 months, or 1 year). You can also check the Show Unique Users box to see the number of unique viewers across all your videos or for a specific video.
It's worth noting that unique user metrics are displayed as aggregated data. As with all Insight statistics, no personally identifiable information is collected or shared.
The Views map captures the distribution of views in a geographic market over a certain period of time. The aggregate data includes views from YouTube as well as from embeds, if you've got them. You can click a particular country or select a specific map to see how viewing for a particular video has trended over a period of time for that country.
As Figure 10.4 illustrates, the graph shows data over time for the geographic region defined by the map and the map shows geographic data for the time period defined by the slider on the graph. You can change various settings on the graph by pulling the slider bar to a different time frame; the colors on the map will change to reflect the new time period selected on the graph. Conversely, if you select a country (e.g., Canada) or a new map (e.g., USA), the graph will update to reflect the viewing trends in that geographic market.
If you click the Popularity tab above the graph display in YouTube Insight, you can compare the relative popularity of your videos in a given region to all other videos in that region.
As Figure 10.5 illustrates, Popularity is a relative measure between 0 and 100 of how the views for a particular video compare to all other videos or how the aggregated video views for your channel compare to all other channels.
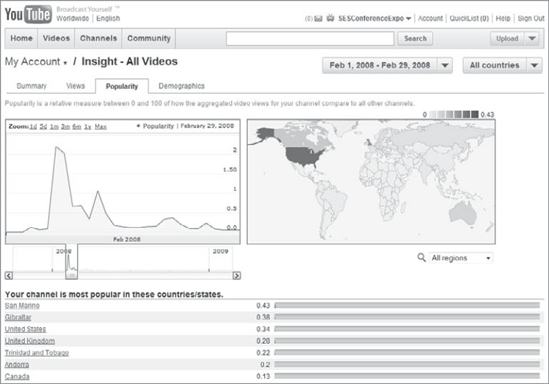
The Popularity graph provides insight into how popular a particular video has been over time. This graph uses a popularity index, which measures how much more or less popular a particular video is compared to overall videos in that geographic market. For example, if my video is indexed at 96 on the graph, this means that only 4 percent of all videos in the selected region and timeframe have been viewed more than my video.
The Popularity map shows the relative popularity of a particular video within the different countries of a region. The scale is again relative, so the country within which the video is most popular will be dark green and the one in which it is least popular will be light green.
Before we go to the next tab in YouTube Insight, are there any questions?
Search Engine Marketer: "Can I find out how many video responses, text comments, and ratings all the videos on my channel have received?"
I'm glad you asked that question. In March 2009, YouTube Insight added a feature: a Community tab that allows you to see how YouTube users engage with your content over time. You can see total numbers related to ratings, comments, and favorites as well as the average number of actions the community takes per view of your video.
YouTube Director: "Can I compare popularity indexes for one group of videos with indexes for another group of videos?"
Currently, reporting is available for only one video at a time or all videos on a channel. But YouTube has said it will explore additional functionality and reporting options with future iterations of Insight.
Entrepreneur: "Can I get statistics for videos in other channels?"
Currently, reporting is available for only your own videos. But if YouTube explores additional functionality and reporting options, this feature could appear in future iterations of Insight.
Okay, now let's go to the next tab.
Today, let's look at the Discovery tab in YouTube Insight.
The Discovery tab shows you how viewers "discovered" your video. They could have been searching on YouTube or Google, browsing under "Related Videos," watching it in an embedded player on a blog or website, or receiving a link to the video in an email from a friend or colleague.
As Figure 10.6 illustrates, the Discovery tab will give you insight into how people found your videos.

Figure 10.6. My Account / Insight, Discovery tab, "Web Analytics Recap with Avinash Kaushik at SES NY 2008"
If you click the links under Source of Views, you will see additional details about these aspects:
- YouTube Search
This section shows which terms viewers searched for on YouTube to find your video. For example, the top two search terms used to find the video in Figure 10.6 were web analytics and avinash kaushik.
- Related Videos
This section shows video content owners which related YouTube videos are driving views to your video. You can click through the Video ID to see these videos. The video in Figure 10.6 was found in Related Videos about SES NY 2008 and Avinash Kaushik.
- Embedded Player
This section shows what percentage of your views came from a YouTube player that is embedded on another site or blog. For example, the video in Figure 10.6 was embedded in the Search Engine Watch Blog.
- Google Search
This section shows which terms viewers searched for on Google to find your video. The top search term used to find the video in Figure 10.6 was Avinash Kaushik.
- External Links
This section shows which websites are driving views to your video. For the video in Figure 10.6, the top external link was
www.kaushik.net.- YouTube Other
This section represents different pages on YouTube.com that are driving views to your video.
- Viral / Other
This section represents direct links to your video, where there is no reference URL. These video views will come from users clicking links from emails or IMs.
- Google Video
This section shows which terms viewers searched for on Google Video to find your video.
On May 15, 2008, demographics became available in YouTube Insight.
In a post to the Official Google Blog, Nick Jakobi, product manager at YouTube, wrote, "When we first announced YouTube Insight, our free video analytics tool for YouTube, we were excited to see just how users, partners, and advertisers might creatively use information about the viewing trends of their videos. We've since learned that some users and partners are modifying their upload schedules based on when they know their audience is tuning in, and advertisers are studying geographic traffic patterns to assess the effectiveness of regional ad campaigns."
Jakobi backed this up by linking to two articles: one by Kim Hart in the Washington Post entitled "The Smart Money Watches You Watch Videos" and another by Zachary Rogers in ClickZ entitled "YouTube Analytics: Marketers Draw New Insights from Old Uploads."
Both articles told the story about how MSHC Partners had used YouTube Insight to discover that an old video clip promoting CleanMyRide.org, which featured comedian Sarah Silverman, had seen a sudden spike in views when she appeared on Jimmy Kimmel Live with a new video, dubbed "I'm F**king Matt Damon."
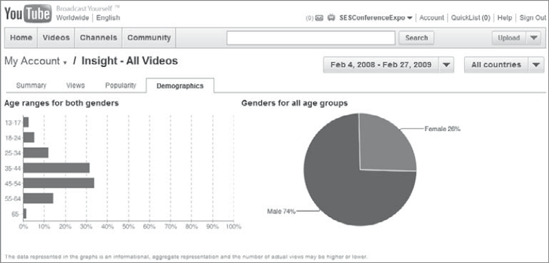
Jakobi then announced the addition of some new features to Insight. One was a new demographics tab that displays view count information broken down by age group (such as ages 18 to 24), gender, or a combination of the two to help you get a better understanding of the makeup of your YouTube audience. He added, "We show you general information about your viewers in anonymous and aggregate form, based on the birth date and gender information that users share with us when they create YouTube accounts. This means that individual users can't be personally identified."
In addition, some of the demographic data might represent the gender and age of the individual setting up a YouTube account for an organization instead of all the other people who might also be using it.
Plus, some people lie about their age. You need to be at least 13 years old to have an account; a younger kid might pretend to be older just to become a subscriber of Fred. I was born September 2, 1949, and have learned that it's not just the young who lie about their age; Jack Benny celebrated his 39th birthday 41 times. So, an older user might pretend to be Benny's age when signing up on YouTube.
Fortunately, Nielsen/NetRatings independently confirmed in December 2008 that YouTube's audience in the United States mirrors the demographics of the online population: 52 percent of YouTube visitors are male and 48 percent are female. And just as many are over the age of 55 as under 18:
Eighteen percent are under the age of 18
Twenty percent are 18–34
Nineteen percent are 35–44
Twenty-three percent are 45–54
Twenty percent are over the age of 55
As Figure 10.7 illustrates, the default of the Demographics tab is to display age ranges for both genders and genders for all age groups. However, if you click male or female, you will see the age ranges of male or female visitors.
As with Insight's other features, this new information helps you learn how to create more compelling content that best engages the audiences you want to reach. Of course, it also helps to have been Kimmel's long-time girlfriend.
On September 30, 2008, YouTube added a new feature to Insight called Hot Spots. With Hot Spots, you can figure out which scenes in your videos are the "hottest," so you don't have to guess what viewers are watching. Insight also shows which parts of your videos are "coldest," so you can edit those videos to keep your audience engaged. You can find this new feature under the Hot Spots tab within the Insight dashboard.
What does hot mean? Hot shows that compared to other YouTube videos of similar length, fewer viewers are leaving your video at that point, and many viewers may even be rewinding on the control bar to see a particular sequence in your video again. Cold means that, compared to other YouTube videos of similar length, many viewers are moving to another part of your video or leaving the video entirely.
Figure 10.8 shows an example of Hot Spots in action. The Hot Spots tab in Insight plays your video alongside a graph that shows the ups and downs of viewership at different moments within the video. YouTube determines the "hot" and "cold" spots by comparing your video's abandonment rate at that moment to other videos on YouTube of the same length and incorporating data about rewinds and fast-forwards.
So what does that mean? Well, when the graph goes up, your video is hot: few viewers are leaving, and many are even rewinding on the control bar to see that sequence again. When the graph goes down, your content's gone cold: many viewers are moving to another part of the video or leaving the video entirely.
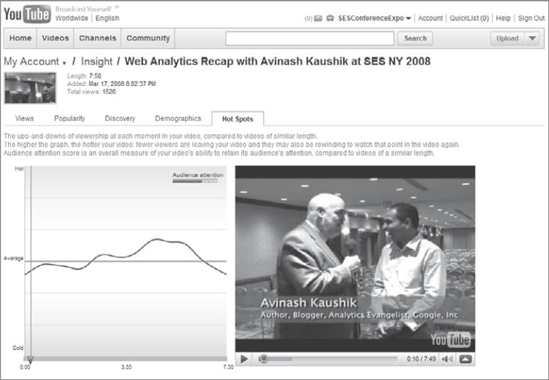
Figure 10.8. My Account / Insight, Hot Spots tab, "Web Analytics Recap with Avinash Kaushik at SES NY 2008"
You can see that viewers seemed to enjoy Kaushik's shout out to the Buckeyes; he got his MBA at The Ohio State University. But some started drifting off as he explains why it is getting harder to make a ton of money on the Web. The longer the video goes on, the more people tend to stay, generating a small hot spot as Kaushik predicts what's going to happen in the next 24 to 36 months and then a big hot spot as he talks about trying to measure "faith-based initiatives" like advertising in Fortune magazine. The final hot spot comes as he explains what he covers at his blog, Occam's Razor, and the dip at the end occurs as he talks about his book, Web Analytics: An Hour a Day.
Now, what can I do with this feedback? I could edit the video, keeping the "hottest" scenes. Or I could include a couple of well-timed annotations during the "coldest" scenes to let the audience know that Kaushik will be predicting what's going to happen in the next two to three years.
I could also leave this video alone but learn what parts of it viewers were watching and skipping so I can create better content in the future. YouTube is the world's largest focus group, so it makes sense to study the effectiveness of my interview.
Tracy Chan and Nick Jakobi are the YouTube product managers who cooked up Hot Spots. If either one of you read this, consider letting me compare my video to other videos of the same length in the same category. That way, I can use other 7-minute, 50-second videos from other reporters as my benchmark instead of videos of the same length in all categories.
YouTube Insight provides you with information that helps you better understand your audience: who they are, where they come from, what they watch, and when. However, if 20 to 60 percent of your video marketing campaigns are on other online video sites, then you will also want to analyze your overall marketing efforts—both on and off YouTube.
To do that, you can use TubeMogul, which not only distributes videos to more than 20 online video sites (including YouTube, Yahoo! Video, Veoh, Metacafe, MySpace, and Dailymotion), it also provides in-depth tracking and analytics for online video.
Although, if you upload an individual video without using TubeMogul, you can't retroactively add it to TubeMogul's Insight for your overall channel—"which is a pain," according to my technical editor.
As Figure 10.9 illustrates, this combination of syndication and analytics services enables TubeMogul to provide the SES Conference and Expo with independent information about online video performance on YouTube and other top video sharing sites.

Founded in 2006, TubeMogul aggregates video-viewing data from multiple sources, including YouTube, Yahoo! Video, Veoh, Metacafe, MySpace Video, Dailymotion, Revver, and Crackle. As TubeMogul's channel on YouTube says, this gives "publishers improved understanding of when, where and how often videos are watched," and they can "track and compare what's hot and what's not, measure the impact of marketing campaigns, gather competitive intelligence, and share the data with colleagues and friends."
Through its acquisition of Illumenix in October 2008, TubeMogul is also able to offer additional engagement and performance metrics. For sites that host their own video, TubeMogul InPlay can be set up in any Flash video player to track viewership metrics such as audience engagement, attention span, and site performance in real time.
In April 2009, TubeMogul landed $3 million in Series A funding from Trinity Ventures. This should enable the online video analytics and distribution company to address some of the growing pains created by over 75,000 users and tracking hundreds of millions of video streams.
Who uses TubeMogul? As I mentioned in the Introduction, 9 of the 100 most viewed channels on YouTube use TubeMogul: Machinima.com, Mondo Mini Shows, Fred's TubeMogul, HotForWords, Athene Wins, Barely Political, Philip DeFranco, Nuclear Blast USA, and Venetian Princess. TubeMogul's client list also includes CBS Interactive, PBS, Ford Models, Universal McCann, AvenueA, Conde Nast, FreeMantle Media, Warner Bros., The Onion, Next New Networks, Revision3, Red Bull, Intel, Cisco, Home Depot, Green Peace, and the White House.
Although you can trust YouTube Insight, let's take a closer look at how you can use TubeMogul to verify the information and track far more than the traditional metric of video "views."
Monday: Understand your audience
Tuesday: Measure industry trends
Wednesday: Get rich metrics for your site's video player
Thursday: Use your audience metrics to drive innovation
Friday: Revise your ad revenues upward
TubeMogul offers a number of features to help you understand your audience beyond the YouTube community:
- Cross-Site Analytics
TubeMogul provides you with a reporting dashboard to compare and contrast viewership information on your videos across multiple video sharing sites. Analytics include views, comments, and ratings trended over time. It also sends you daily emails that show changes in this data.
- Data Export
TubeMogul lets you export your analytics into Excel. YouTube didn't add this functionality until April 2009. You can also upgrade to one of TubeMogul's advanced product levels to export data that is more than 30 days old.
- Data Feed
TubeMogul lets you grab your raw data through a data feed set up to your specifications. If you want to merge your TubeMogul data with other data sets you're collecting, this is a pretty useful solution.
- Link Intelligence
TubeMogul also lets you see which blogs and websites are linking to your videos according to sites like Technorati, Google, and Digg. This can help you find out how link worthy your video content is, although I will show you another way to get this information in week 4.
- Custom Video Groupings
TubeMogul lets you group together any set of videos to aggregate viewership information for analysis. Common groupings are by episode, season, and sponsor. You can also upgrade to one of TubeMogul's advanced levels to create unlimited custom tracking units.
- Event Reporting
If you are wondering why your channel spiked with viewers, TubeMogul lets you see when your video was featured on more than 20 video sharing sites. You can also add your own markers to note events of significance to your video's success.
- Audience Demographics
TubeMogul enables you to learn your audience's gender, age, household income, ethnicity, education, and household size. This can help you get to know your viewers better and measure key segments.
- Audience Geographics
Finally, TubeMogul lets you see the geographic location of the viewers watching your videos on a world map. Who knows, you could be big in the United States but huge in Canada, eh?
As Figure 10.10 illustrates, Wallstrip, the popular online video show with a humorous and educational take on stocks and pop culture, uses TubeMogul data to help advertisers and investors understand the demographics of its audience, which is primarily male, 35 to 54 years old, and viewership trends across nine sites. Wallstrip also uses TubeMogul to benchmark its viewership against its competitors.

You can also track videos by producer on any site TubeMogul tracks, whether the video is yours or that of another producer. This might be your competitor's videos or any video that mentions a keyword. This feature allows you to track your own videos even if they weren't uploaded through TubeMogul.
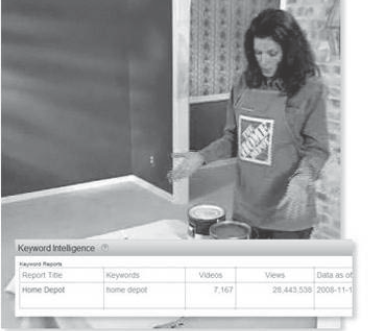
For example, Home Depot uses TubeMogul to distribute videos to multiple sites rather than just uploading to YouTube alone, more than doubling their viewership. Home Depot also utilizes TubeMogul's Keyword Intelligence to track all videos mentioning Home Depot.
As Figure 10.11 illustrates, over 7,000 videos with more than 28 million views had mentioned Home Depot as this was written.
TubeMogul also enables you to track buzz in the world of user-generated content or compare your brand to your competitors' by tracking videos and viewership across the Internet based upon selected keywords. This is a significant timesaver for anyone manually collecting keyword statistics.
For example, Infuse Creative is one of the agencies that use TubeMogul. While working on a major theatrical release for a large Hollywood studio, Infuse Creative was asked to analyze the buzz created for keywords and tags on all videos across several video sharing sites.
Infuse Creative was already tracking the success of the studio's videos uploaded through TubeMogul to the studio's accounts at the video sites, but it also needed to track all the videos uploaded by fans and movie critics because the Hollywood studio wanted to get a picture of all views from all videos tagged with keywords pertaining to its new movie.
Infuse Creative used TubeMogul's Analytics by Keyword tool to gain competitive intelligence on all videos—regardless of video site or who uploaded them—tagged with specific words and phrases. The agency was able to share with its client data showing both the benefits of uploading theatrical trailers to the sharing sites and the subsequent buzz in the form of user-generated videos.
Although Infuse Creative couldn't share any of its client's charts, you can get an idea of the kind of competitive intelligence TubeMogul offers by looking at a chart that appeared in the TubeMogul Blog in March 2007.
The chart in Figure 10.12 illustrates what happened when the "Hillary 1984" attack video was posted on YouTube by an unknown party in March 2007. As you can see, the unanticipated consequence was a huge spike in daily views of the official videos by Democrats.

The "Hillary 1984" attack video was widely distributed and had over 1.5 million views as of March 22, 2007. However, the buzz spilled over to the response videos officially put out by the Barack Obama and Hillary Clinton campaigns. The chart shows an aggregate of video views on YouTube of the top three Democrats (Obama, Clinton, and John Edwards) vs. that of the top three Republicans at the time (Rudy Giuliani, John McCain, and Mitt Romney).
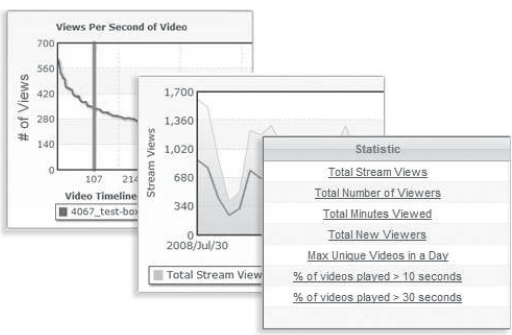
Through its acquisition of Illumenix in October 2008, TubeMogul also offers InPlay to sites that host their own video. InPlay is a Flash-based analytics service that gives you an in-depth view into your site's video performance.
Able to be integrated with any Flash video player, InPlay tracks audience statistics and user interaction in real time. As Figure 10.13 illustrates, the metrics InPlay offers include viewed minutes, viewer attention, and per-stream quality.
One of the users of TubeMogul InPlay is eBaum's World, which was created by Eric Bauman and sold to ZVUE Corporation in August 2007 for $17.5 million. eBaum's World uses TubeMogul InPlay to track about 30 million streams per month on the online entertainment site.
At an individual video level, eBaum's World uses InPlay to track viewer engagement, including how much of a video is actually watched, what the most popular segments of a video are, when a viewer clicks away, and much more. Insights gleaned from these metrics allow eBaum editors to feature the most engaging videos as well as share rich viewership data with their video producers and sponsors.
At a sitewide level, eBaum's World also utilizes InPlay to track minutes viewed by category and viewer behavior around the content as a whole, leading to insights in everything from bandwidth delivery to optimal site structure.
In January 2009, Bauman reported on his blog that ZVUE had decided to let him and the rest of this team go. He said, "We have been running eBaum's World for 10+ years so this is a very sad time for all of us. Without us, I am sure the site will not run nearly as smoothly anymore since there is a brand new team running it and they have no idea what they are doing."
According to Compete, unique visitors to ebaumsworld.com peaked at over 1.4 million in November 2008 and dropped to under 1.2 million in February 2009. So, getting rich metrics for your site's video player can help you handle some, but not all, of the things that go bump in the night.
There are other benefits of using TubeMogul. As Figure 10.14 illustrates, TVWeek is using TubeMogul's audience metrics to track within Brightcove's player.

In December 2008, TubeMogul announced an integration and partnership relationship with Brightcove. When TVWeek heard the announcement, it jumped at the chance to start collecting in-depth viewership metrics of the video content it produces, including Daisy Whitney's show "New Media Minute." Like many sites, the company hosts the videos on its site using Brightcove's platform player.
In a press release, Greg Baumann, editor of TVWeek and the Brightcove plug-in's first user, said, "TubeMogul InPlay statistics are infinitely useful. In an instant, I know how many new viewers we have, our salespeople know by geographic region where our most engaged viewers are and our technical team knows who is experiencing errors."
A case study on TubeMogul's site provides some additional details about the benefits that TVWeek has seen:
- Editorial
TVWeek's editors now measure audience engagement. By examining each video's audience retention at a per-second level, editors can figure out what makes the most popular videos successful. At a macro level, editors are able to establish benchmarks like overall minutes viewed, peak times of day, unique and repeat viewers, and referral sites/keywords.
- Sales
TVWeek's ad sales team now provides objective reporting to advertisers. TVWeek is able to offer third-party metrics like "viewed seconds," which is a statistic that measures audience engagement at every moment and is unlike commonly cited data points like "impressions" or "views," which don't necessarily guarantee that anyone ever actually saw an ad.
- Video delivery
TVWeek's engineers now know where in the world viewers are having slow load times. The engineers have access to video delivery metrics, such as download speeds, the number of users that experienced "rebuffers," and the peak times of day to avoid shuffling in new content.
Finally, the video-player metrics of TubeMogul InPlay have enabled Revision3 to make data-driven production decisions. This in turn has enabled Revision3 to revise its ad revenues...upward.
Effective measurement of video performance became much more important as the economy contracted and ad spending worsened. Few companies know this better than Revision3, the TV network for the Internet generation, which is posting record revenues amid industry projections of declining ad spending.
Revision3 uses TubeMogul to syndicate many of its shows to YouTube, MySpace, Yahoo!, Metacafe, and other sites as well as track the results (Figure 10.15).
According to a case study on TubeMogul's site, Revision3 utilizes TubeMogul InPlay for its own video player, tracking rich data on viewer behavior that occurs on its site. Using InPlay, Revision3 is able to track typical viewers' experiences, including per-stream data for how much of a video is actually watched, where in the world people are watching, and average download speeds.
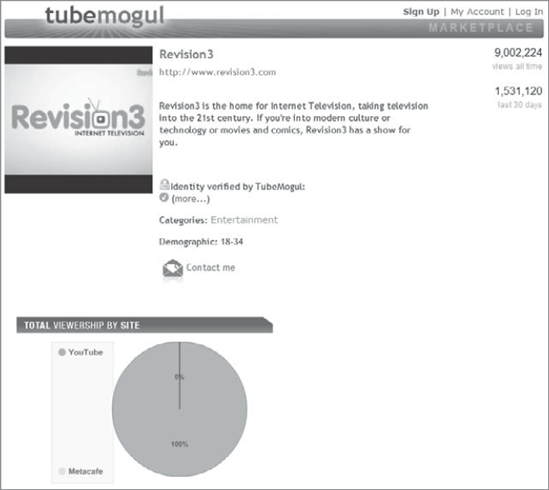
This enabled Revision3 shows to garner a record number of views for 2008 and helped launch its hit programs—including Diggnation, The Totally Rad Show, and Tekzilla. Views of Revision3's programs increased more than 140 percent year over year to over 46 million views in 2008 from 19 million views in 2007. In addition, the network reported a whopping 129 million segments viewed and nearly 1 billion minutes of engagement in 2008.
This, in turn, powered Revision3's impressive growth for 2008. With revenue tripling in the past year, viewership growing to 140 million minutes of engagement monthly, and more than 60 advertising partners, Revision3 enjoyed strong momentum and increased market penetration as the company moved into 2009.
With reach doubling in 2008, Revision3 continued to maintain a strong connection with the male, age 18 to 34 audience. Revision3 also delivered the most effective advertising products in the industry, with 99.9 percent audience sponsor recall. In addition, 48 percent of Revision3's audience has purchased a product or service from one of the company's sponsors.
All this has helped to fuel Revision3's strategic partnerships with Adobe, the Air Force, Anheuser-Busch, Axe, Carmex, Dolby, Dr. Pepper, EA, Go Daddy, Microsoft, Sony, Virgin America, and Zune.
Another tool that can help you analyze your overall marketing efforts—both on and off YouTube—is Visible Measures.
Coincidentally, TubeMogul and Visible Measures were both launched at Demo 08 on the same day: January 30, 2008. In a column entitled "Visible Measures and TubeMogul measure video usage," on the Between the Lines Blog on ZDNet.com, Dan Farber, said, "TubeMogul doesn't get inside the videos like Visible Measures."
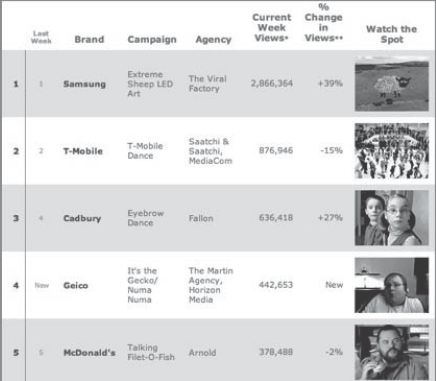
The weekly Ad Age Viral Video Chart (Figure 10.1) uses data from Visible Measures about brand-driven viral video ads that appear on online video sharing destinations. Each campaign is measured on viewership of both brand-syndicated video clips and viewer-driven social video placements. The data is compiled using the Visible Measures Viral Reach Database of analytic data on more than 100 million Internet videos across more than 150 video sharing destinations.
Founded in 2005, Visible Measures is an independent third-party measurement firm that specializes in measuring the consumption and distribution of Internet video. In March 2009, Visible Measures raised $10 million in Series C financing. In April 2009, the company announced that it had become the online video measurement platform of record for MySpace.
The company's Internet video measurement solutions are powered by three core technologies: its Video Placement Multiplier, Viral Reach Database, and Video Metrics Engine. Let's take a closer look.
Monday: Distribute your video content
Tuesday: Count your true reach
Wednesday: Measure your video engagement
Thursday: Measure brand exposure
Friday: Measure audience behavior
According to Visible Measures, Video Placement Multiplier distributes your video content to "over 40 of the top video sharing sites in a single step." Although the company doesn't list those sites by name, it says they range "from the hottest video sharing sites to tightly targeted niche destinations."
The first step in the company's automated video placement process involves providing Visible Measures with your video assets and metadata by filling out a form about the meta tags, titles, descriptions, and categories you want to use for your videos. This allows Visible Measures to prepare your videos for distribution and gives you control over brand placement.
Video Placement Multiplier classifies and categorizes every video sharing site supported by Visible Measures. This gives you control over where and how your brand is seen, helping you reach your target audience while staying clear of undesirable content.
To distribute your video content, Video Placement Multiplier uses an automated viral seeding technique that targets 40 of the top video sharing sites. These video destination sites are continuously monitored to ensure functionality and compatibility with your video content.
Video Placement Multiplier is integrated with the Visible Measures Viral Reach Database. As Figure 10.17 illustrates, this means that after your video content is seeded, you can immediately begin tracking how the community responds, no matter where it goes or how it changes.
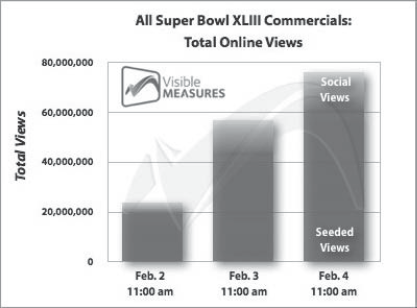
As you can see from the figure, the Super Bowl XLIII commercials got about 60 million seeded views on the top 40 video sharing sites and another 15 million social views on blogs and social networking sites.
According to Visible Measures, "Viral Reach Database gives you the ability to track your viral video campaign wherever it goes online and however it looks."
The Viral Reach Database collects data from over 150 video sharing destinations. This process finds tens of thousands of new video clips every day, constantly growing its video repository. This allows Visible Measures to detect and monitor responses, remixes, spoofs, parodies, mashups, and other derivative videos created by the community that are related to your campaign.
When this discovery process finds new videos, Visible Measures collects the publicly available analytic data and adds it to its video data storage center. Each clip produces more than a dozen data points, including title, comments, view count, rating count, and duration.
The company's constantly growing Viral Reach Database currently houses information for more than 100 million unique videos. The database stores all the data for every video Visible Measures discovers, ranging from daily stats to metadata. These statistics allow you to benchmark your campaign.
The Viral Reach Database also enables Visible Measures to provide detailed reports on viral video distribution, community participation, and audience growth. The ability to see the "True Reach" of a campaign enabled the company to create the Visible Measures 100 Million Views Club (Figure 10.18), which lists the online video campaigns that have accumulated a nine-figure total viewership.
It's worth noting that "Susan Boyle (Britain's Got Talent)" became a member of the 100 Million Views Club in less than a month. By comparison, the four videos ranked ahead of her took 14 to 21 months to earn their top positions.

According to Visible Measures, its Video Metrics Engine captures "every interaction with every video everywhere in your online video network." As my technical editor points out, it's impossible to track when someone emails or IMs a video URL to a friend unless they use a built-in "share" tool. So, let's just say that the company's Video Metrics Engine is able to provide "best-in-class" Internet video metrics through a straightforward instrumentation process with your video player.
This process, led by a team of integration experts from Visible Measures, involves inserting Video Metrics Engine code into your video player. Once the code is inserted, virtually every interaction by every viewer with all of your videos is collected by the Video Metrics Engine. In addition, the code works with your player wherever it goes online—from blogs and embeds to social networking sites.
As soon as your player is instrumented, the Video Metrics Engine begins collecting data. Every time a viewer interacts with your video, the player sends information to the data collection system. This means that every pause, play, rewind, fast-forward, replay, copy, embed, repost, forward, share, and comment is collected by the Video Metrics Engine from every video, user, and site and stored for processing in the Visible Measures computational grid.
Information collected by the data collection system is stored on a distributed file system within the computation grid. This grid receives, processes, and stores information on millions of video streams every day. This means that regardless of the size of your content catalog or audience, the Video Metrics Engine is able to produce your video metrics data immediately.
Data that has been aggregated and processed by the computational grid is then loaded into the data warehouse. Once the data has been loaded, it can be viewed by a Web-based dashboard for analysis as users interact with your video content in real time.
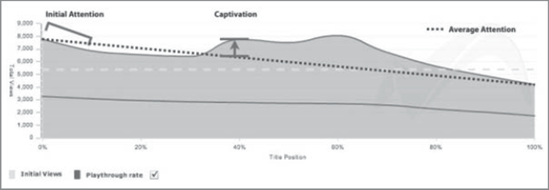
The dashboard is the face of the Video Metrics Engine. As Figure 10.19 illustrates, it shows you visualizations of key metrics like engagement, captive viewing time, day parting, initial attention, play-through rate, title reach, stickiness, and many more.
These metrics can help you make better decisions regarding future Internet video investments and drive increases in audience growth, content consumption, viewing time, and the discovery of new revenue opportunities.
By combining what Visible Measures calls "True Reach" analysis with the audience interaction data, the company can estimate a campaign's aggregate viewing time, which represents total brand exposure.
For example, Nike recently launched a viral video in support of its Hyperdunk basketball shoe. As Figure 10.20 illustrates, the video featured basketball superstar Kobe Bryant recklessly leaping over a speeding Aston Martin.
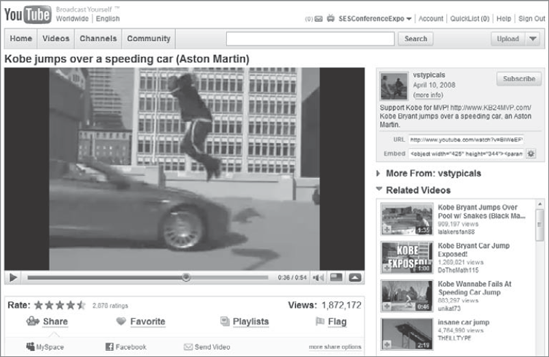
The company's Viral Reach Database captured well over 250 unique placements for the Kobe video. The brand appeared to be responsible for posting just over a dozen of these placements, so the remaining 240 placements were community driven.
Of these, 60 percent were copies of the original video and 40 percent were derivative videos, ranging from reenactments of the stunt and parodies of the clip to a truth squad of viewers determined to reveal the video as a fake. The large number of viral placements reflects the clip's overall audience appeal.
The original and viral placements of the Hyperdunk campaign accumulated more than 16 million views in aggregate. The original Kobe clips posted by Nike generated less than 40 percent of the overall reach. The viral placements increased the campaign reach by over 200 percent.
All told, the Nike Hyperdunk viral video campaign attracted over 35,000 comments. Based on a term frequency analysis, the audience reacted strongly to the campaign. Many of the comments collected reflect admiration ("best," "must-see"), skepticism ("fake," "real," "stunt"), and note the product placement of both the Aston and the Hyperdunk shoes ("Aston," "car," "Nike," "shoes").
The so-called "engagement curve" for the Hyperdunk video also illustrates a number of viral phenomena. First, the clip's initial attention score indicates significant audience abandonment during the clip's opening. However, as Kobe takes flight, the engagement curve spikes significantly, indicating substantial rewind behavior as viewers rewatch the stunt—most likely to try to see if it was real or not. Finally, the downward slope at the end of the clip indicates moderate concluding abandonment as users realize the fun is over and click away from the video.
As a result, the estimated engaged reach of this campaign was a whopping 375,000 hours of total viewing time. For perspective, the original 54-second clip drove well over 40 viewing years in aggregate!
Here is another example. Boston.com, one of the most visited regional portals in the United States, uses Visible Measures to capture new data about its audience's interaction with viral videos. Boston.com is part of the business unit that also publishes the Boston Globe, which is owned by the New York Times Company.
In April 2009, the New York Times Company threatened to stop the presses of the Globe for good unless union workers agreed to $20 million in cuts. The newspaper, which has been printed for 137 years, had been saddled with reader flight and a drop in advertising—problems echoed in newsrooms across the country.
As Figure 10.21 illustrates, Boston.com's mission is to provide audiences with trusted editorial content from the Globe and other sources. Increasingly, video has become an important component of the editorial mix for Boston.com.
For several years video content has been delivered through strategic relationships with local broadcasters New England Cable News and New England Sports Network. More recently, as the appetite for video content increased, Boston.com has been expanding the use of video that it produces itself as well as video content that is user generated. Video is becoming a more important component in such areas as entertainment, special news reports, sports, and even breaking news.
Over the years, Boston.com has adopted a stable of measurement best practices and technologies to capture data on web page viewers. However, page view metrics alone do not tell a complete story for Internet video. An early adopter in an emerging market, Boston.com is working to develop a fuller assessment of its Internet video audience's in-stream behavior by partnering with Visible Measures.

Using VisibleSuite, Boston.com is capturing new data about its audience's access to, consumption of, and engagement with individual videos. For instance, early results show that Internet video audience engagement is not necessarily tied to video length. In the world of online news, fresh new content is more critical.
With VisibleSuite, Boston.com has identified viewing patterns associated with demographics, editorial design, and day-of-the week and time-of-day viewing that will have a profound effect on marketing and promotion of Internet video content. This audience behavior measurement data will allow Boston.com to continually refine its Internet video content, create more compelling packages for advertisers, and promote video content through its distribution partners more effectively.
Unfortunately, it may not prevent the Globe from following the Rocky Mountain News, which has shut down completely, the Christian Science Monitor, which is no longer printed on a daily basis, or the Seattle Post-Intelligencer, which has gone to a web-only version. Nevertheless, refining the Internet video content may be the last best hope of saving Boston.com no matter what happens to the Globe. And it may be the last best hope in other cities too.
In February 2009, ReelSEO released an in-depth report sponsored by EveryZing on how online video can help newspaper companies to grow their Internet audience and advertising base. Written by Senior Analyst Grant Crowell, "Business Models for New Realities: The Newspapers Industry's Video SEO Opportunity" is the culmination of more than two years of industry research along with interviews with editors and publishers of newspaper companies nationwide.
I was one of the analysts who was interviewed for the report and was quoted in a press release when it was announced. I said, "If you do a SWOT analysis of newspapers, their strengths are in print, their weaknesses are online, but their opportunities are in online video, and their threats are legion. That's why newspaper executives should read this report today, not tomorrow."
I wrote that two months before The New York Times Company threatened to shutter the Globe. Today let me repeat my urgent request.
You should use YouTube Insight to count what is countable. And you should use TubeMogul or Visible Measures to measure what is measurable. But what can you do to make measurable what is not measurable by these tools?
The answer is to start building an integrated Trinity platform. What's that? In Web Analytics: An Hour a Day, Kaushik calls Trinity a mindset and a strategic approach. He says, "The central raison d'être of the Trinity strategy is something radical: actionable insights and metrics."
He adds, "Actionable insights and metrics are the über-goal simply because they drive strategic differentiation and a sustainable competitive advantage."
The first component of this strategic approach is behavior analysis. The goal of behavior analysis is to infer the intent of video viewers or website visitors based on the data we have about them.
The second component of the Trinity mindset is outcome analysis. You want to know the outcomes for your target audience and your company. We look at some dramatic outcomes in Chapter 11.
The third component of this strategic approach is experience analysis. You need to get into the heads of your viewers, visitors, and customers to gain insights about why they do the things they do.
As Kaushik says and Figure 10.22 illustrates, "In the end, the Trinity mindset drives the fundamental understanding of the customer experience so that you can influence the optimal customer behavior that will lead to win-win outcomes for your company and your customers."
So, how do we start building an integrated Trinity platform? Kaushik says, "The entire framework will not come into existence overnight. Typically, you'll diagnose what you currently have and will work toward putting the missing pieces of the puzzle together."

This week, we'll look at other tools that make measurable what is not measurable by YouTube Insight, TubeMogul, or Visible Measures. These tools can help you put the missing pieces of the puzzle together.
One of the missing pieces of the puzzle is finding out who's talking about your brand in the online communities that surround the YouTube community. There are a number of solutions, including BuzzLogic and Trackur. But I'm currently using Radian6, an automated solution that monitors and analyzes a variety of social media.
Founded in 2006, Radian6 provides a social media monitoring platform, flexible dashboard, and as-it-happens alerts. Various analysis widgets give users the ability to uncover the top influencers as well as measure which conversations are having an impact online.
Radian6 has the ability to analyze buzz about your company, products, issues, and competitors and the outcomes of specific marketing campaigns and social media investments. You can know immediately which content is making an impact and what needs to be managed. You can uncover the opinion leaders online by topic, based on user-determined formula weightings. You can listen and learn more about these opinion leaders and decide on a path of engagement tracking the steps along the way.
Radian6 enables you to monitor all forms of social media, from video sharing sites like YouTube to blogs, discussion forums, opinion sites, social networking sites such as MySpace and Facebook, microblogging sites like Twitter, and photo sharing sites like Flickr. This gives you the ability to listen, measure, and decide which customers to engage across the entire social web.
In April 2009, Radian6 announced a partnership with Webtrends Open Exchange to offer Webtrends Social Measurement, powered by Radian6. This offers businesses a more complete view of customer engagement, in terms of both what's happening within their own website and what's happening outside their domain across the social web.
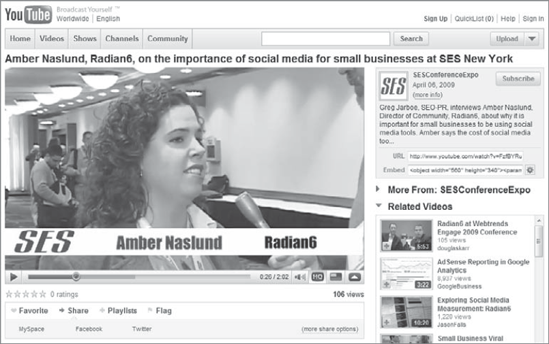
As Figure 10.23 illustrates, I interviewed Amber Naslund, director of community of Radian6, at SES New York 2009. I asked her why it is important for small businesses to use social media monitoring tools. She said the cost of these tools is relatively low and using social media is a great way to connect with smaller communities.
Another one of the missing pieces of the puzzle is finding a better way to track the comments and inlinks to your videos and channel.
On any video's watch page, you can find out what the top five sites linking to a video are under Statistics & Data. Also, with YouTube Insight, you can see what the top sites embedding one of your videos are. You can contact these sites and establish a relationship, and they may continue to post your future videos.
Also, you can check the comments on your videos. You can skim the comments to pick up on helpful information. If a popular user in the YouTube community comments on one of your videos, you can contact them and see if they would be interested in future collaboration or cross promotion. This requires you to be an avid community member, of course.
You can also check the content of the comments for memes—cultural references to specific communities—to figure out what kind of audience you're getting. For example, check out "Play him off, keyboard cat" on Brad OFarrell's channel at www.youtube.com/watch?v=2ndx_IdlUQU. Even though none of the Insight or reference data mentions 4chan.org, a lot of the comments contained references to 4chan memes, which you can find at http://en.wikipedia.org/wiki/4chan#Memes.
O'Farrell says, "So I knew the audience were '4chan people' and as such I modified my video's metadata to react to that. I changed the title to name the cat 'keyboard cat' since that's the naming convention 4chan memes often have (e.g., "long cat" or "speedy cat") so that it would be more consumable to the 4chan audience. I also put in the extra effort to get it monetized (I had to obtain the rights) and featured, and enabled video responses without my approval."
As Figure 10.24 illustrates, "Play him off, keyboard cat" had over 670,000 views as of May 2009 and it became a meme: over 790 parodies of the video have been made as of that date.

Now that YouTube allows you to export your Insight data into CSV files, it's easier to move and analyze it using spreadsheet software. But Insight doesn't provide data for the sites linking to your channel. And YouTube doesn't report what sites are linking to other channels or more than the top five sites linking to a popular video.
So use Yahoo! Site Explorer (https://siteexplorer.search.yahoo.com) to track sites that link to a channel or watch page. Exploring a channel or watch page is as easy as doing a web search, but instead of entering a query term, you enter the URL into the Explore URL Search box and click Explore.
What's different about Site Explorer is that it does not return the same kind of results as a web search. Instead, the Site Explorer results page shows all the indexed inlinks to the URL.
By default Site Explorer provides 50 results per page. You can view the live or cached version of any result. You can also export the data to a tab-separated value (TSV) file for further analysis. And you have the option to download up to 1,000 results into a TSV file at once—and avoid having to page through the results.
How you format or specify the URL that you submit to Site Explorer influences what kind of results you get. So you should specify URLs in different forms to display different results in Site Explorer.
For example, when I pasted http://www.youtube.com/user/huluDotCom into Site Explorer, it found close to 57,000 inlinks to HuluDotCom's channel on YouTube in May 2009, but when I pasted http://www.youtube.com/huluDotCom into Site Explorer, it found only 138 inlinks.
When I pasted http://www.youtube.com/watch?v=lich59xsjik into Site Explorer, it found 2,188 inlinks to "Family Guy - Cool Whip," and I could export the inlinks to a TSV file for further analysis.
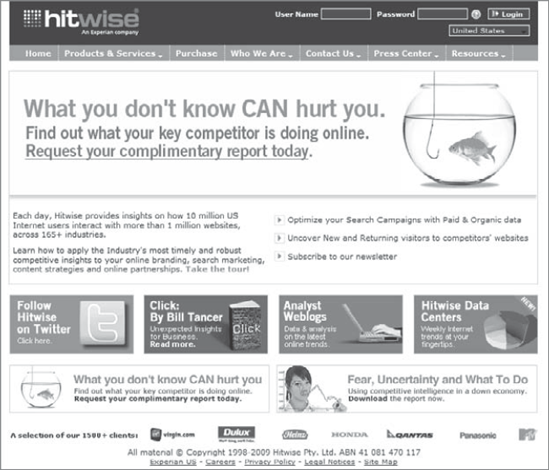
Another one of the missing pieces of the puzzle is finding out what your key competitor is doing online. There are several good services that provide this information, including comScore and Nielsen Online. But the one that I keep going back to for more competitive insights is Hitwise.
As Figure 10.25 illustrates, Hitwise provides its 1,500 clients with daily insights on how 10 million Internet users in the United States interact with more than 1 million websites, across more than 165 industries as well as how 100,000 Internet users in Canada interact with 85,000 websites in 160 industry categories. And Hitwise clickstream data provides extensive reports on the upstream traffic to and downstream traffic from a specific website, industry, or custom category.
Founded in 1997, Hitwise is now an Experian company. Instead of monitoring a sample of 10,000 to 50,000 Internet users, Hitwise works with ISP networks to monitor millions of Internet users. As a result, while many other measurement companies have data on the top 1,000 websites, Hitwise has data on over 1 million online businesses.
Hitwise offers a range of products and services that help marketers improve their online performance. The Hitwise flagship product is its online Competitive Intelligence Service.
Although Hitwise doesn't publish the cost of its service on its website, a typical subscription costs from $20,000 to $50,000 a year, depending on the features purchased. Veteran marketers will want to evaluate the benefits as well as the cost of Hitwise. However, new YouTubers might agree with Rebecca Kelley, who posted a review to the SEOmoz Blog on March 2, 2007, entitled, "Hitwise: Damn Expensive, but Damn Cool."
There are a couple of less-expensive alternatives. First, you can go to the Hitwise Research Store (http://researchstore.hitwise.com) and purchase a report on your competitor starting at $695 per report. Second, you can subscribe to the free monthly Hitwise newsletter to receive industry statistics, market trends, and other competitive intelligence data.
In addition, I strongly recommend reading the Hitwise Intelligence Analyst Weblogs. I do. You'll find posts entitled "Hulu and the Older Early Adopter" by Bill Tancer and "YouTube Site Search - Lil Wayne Tops" by Heather Hopkins.
Or, go to the Hitwise Press Center. Yes, there's plenty of good data there too, including the press releases "Google Closing in on 73 Percent of U.S. Searches in April 2009" and "Hitwise Launches Internet Measurement Service for Canada."
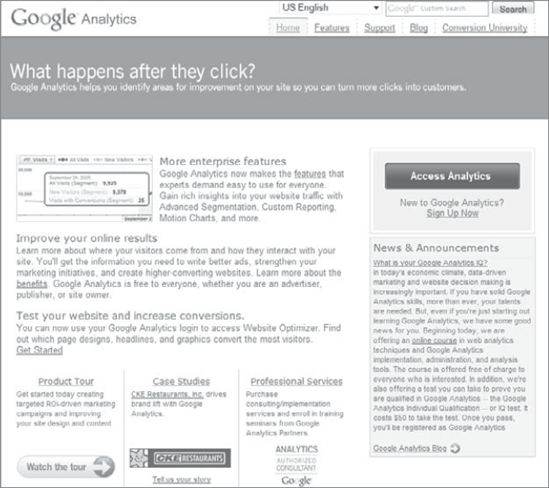
If one of the missing pieces of the Trinity mindset is "outcome analysis," then one of the tools you need is web analytics. As Figure 10.26 illustrates, Google Analytics can help you find out what happens after they click.
Google Analytics offers a number of features and benefits:
- Advanced segmentation
You can isolate and analyze subsets of your traffic. For example, you can select from predefined custom segments such as "Visits with Conversions" or create new custom segments with a flexible, easy-to-use segment builder. You can apply segments to current or historical data and compare segment performance side by side in reports.
- Motion charts
You can select metrics for the x-axis, y-axis, bubble size, and bubble color and view how these metrics interact over time.
- Custom reports
You can create, save, and edit custom reports that present the information you want to see organized in the way you want to see it. A drag-and-drop interface lets you select the metrics you want and define multiple levels of subreports.
- Keyword and campaign comparison
You can track and compare all your ads, email newsletters, affiliate campaigns, referrals, paid links, and keywords on Google and other search engines.
- Internal site search
You can find out how your visitors search your site, what they look for, and where they end up.
- Benchmarking
You can find out whether your site usage metrics underperform or outperform those of your industry vertical. Opt-in benchmarking compares your key metrics against aggregate performance metrics while preserving the confidentiality of your data.
- Trend and date slider
You can compare time periods and select date ranges without losing sight of long-term trends.
- E-commerce tracking
You can trace transactions to campaigns and keywords, get loyalty and latency metrics, and identify your revenue sources.
- Funnel visualization
You can find out which pages result in lost conversions and where your would-be customers go.
- Site overlay
You can see traffic and conversion information for every link as you browse your site.
- GeoTargeting
You can find out where your visitors come from and identify your most lucrative geographic markets.
Getting started is relatively straightforward—if you know how to add tracking code to your website. If you don't, ask your webmaster to do it or find someone who has passed the Google Analytics Individual Qualification (IQ) test.
Go to www.google.com/analytics if you know how to add tracking code and sign up to access Analytics. Remember, even if it isn't as easy as Google says, it is free.
Installing the tracking code is a 10-step process:
Create a Google Analytics account.
Configure your profile.
Edit the tracking code for custom website setups.
Add the tracking code to your pages.
Link with your AdWords account.
Create goals and funnels.
Tag your advertising campaigns.
Create filters.
Grant access to other users.
Enable e-commerce transaction tracking.
If you look at the preceding list and think, "I can do that," then go right ahead. If not, don't be too proud to ask for help. Remember, just because you didn't pass the Google Analytics IQ test doesn't mean you aren't "wicked smart" when it comes to YouTube and video marketing.
The final missing piece of the puzzle is a dashboard that helps you measure your success across an integrated Trinity platform. And to get one, you will want to beat a path to the door of Katie Delahaye Paine.
Paine is the founder and CEO of KDPaine & Partners, a New Hampshire–based communications measurement company. She is the publisher of KDPaine's Measurement Blog and The Measurement Standard. And back in 1986, she was the director of corporate communications for Lotus Development Corporation. Yep, she was my immediate predecessor at Lotus, which may explain why we both got interested in measuring the effectiveness of marketing.
One of the products and services that KDPaine & Partners offers is DIY Dashboard software. Version 3.0 has a couple of features that you will want to check out. One is the ability to track content from YouTube as part of social media reports. Another is an automated metrics tool, dubbed KdPI, which translates thousands of data points into a simple table, which can be customized around your specific Key Performance Indicators (KPIs).
Advanced versions of DIY Dashboard 3.0 offer the ability to integrate data from web server statistics, sales lead programs, and survey research. Additionally, if a client outgrows the Do-It-Yourself version, KDPaine & Partners also offers custom coding and analysis to relieve the burden of data entry. Pricing for the DIY Dashboard starts at $300 per month.
The Measurement Standard used DIY Dashboard 3.0 to cover the YouTube video presidential primary race in New Hampshire. As Figure 10.27 illustrates, Republican hopeful Ron Paul was ahead in YouTube videos that mentioned New Hampshire, with more than 3 million views as of December 2007. But John McCain's reply, "Thanks, you little jerk," to a question about his age at a stump speech in New Hampshire was the most-viewed of any video. It was watched more than 300,000 times.

Making measurable what is not measurable won't be easy. But it can yield some "insights" that you might miss if you use only YouTube Insight.
For example, The Measurement Standard reported in December 2007, "Videos posted by the campaign of front-runner Hillary Clinton were among the least favorably rated among the democratic candidates by YouTube users, who score each video on a one to five scale. Clinton's videos received an average rating of 3.47, compared to 4.80 for videos posted by Paul's campaign."
It also reported, "Although viewers have access to as many as 400 videos in a month, less than 10 percent of videos account for 80 percent of views, a trend that is also true among the other YouTube channels."