
Chapter 20: Performance Tuning Until It Flies
Performance is one of those things that separates acceptable apps from extraordinary apps. Of course, some performance bugs make an app unusable, but many more just make an app sluggish. Even apps that have good UI responsiveness may be using much more battery life than they should. Every developer needs to spend time periodically evaluating performance and making sure that nothing is being wasted. In this chapter you discover how to best prioritize, measure and improve the performance of your apps, including memory, CPU, drawing, and disk and network performance. Through it all, you learn how to best use one of the most powerful profiling tools available: Instruments. This chapter also provides tips on how to get the most from the powerful math frameworks available in iOS, including Accelerate, GLKit, and Core Image.
The Performance Mindset
Before going down the road of optimizing an application, you need to adopt the right mindset. This mindset can be summarized in a few rules.
Rule 1: The App Exists to Delight the User
I could really stop the rules right here. Everything else is a corollary. As a developer, never forget that your app exists to do more than just “provide value” to the user. It’s a competitive market out there. You want an app that the user really loves. Even minor annoyances detract from that goal. Scrolling that stutters, a slow launch, poor response to buttons, all these things accumulate in the user’s mind and turn a great app into a “good-enough” app.
Rule 2: The Device Exists for the Benefit of the User
It’s very unlikely that your app is why users bought an iDevice. Users likely have many apps, and many reasons for using their devices. Never let your app get in the way of that reality. Your users may really enjoy your app, but that doesn’t mean it’s okay to drain the battery. It’s not okay to fill the disk. You live in a shared environment. Behave accordingly.
Rule 3: Go to Extremes
When your app is working for the user, use every resource available. When it’s not doing work for the user, use as few resources as possible. This means that it’s okay to use a lot of CPU to maintain a high frame rate while the user is active. But when the user is not using your app directly, it shouldn’t be using much of the CPU. As a general rule, it’s better for the app to use 100 percent of available resources for a short period and then go completely to sleep than to use 10 percent of available resources all the time. As many have pointed out, a microwave can use more power illuminating its clock than it does heating food, because the clock is on all the time. Look for these low-power, always-on activities and get rid of them.
Rule 4: Perception Is Reality
Much of iOS is devoted to giving the illusion of performance that’s unrealistic. For instance, launch images that display the UI give the user the impression that the application is immediately available, even though it hasn’t finished launching yet. Similar approaches are acceptable and even encouraged in your apps. If you can display some information while waiting for full data, do so. Keep your application responsive, even if you can’t actually let the user do anything yet. Swap images for hard-to-draw views. Don’t be afraid to cheat, as long as cheating makes the user experience better.
Rule 5: Focus on the Big Wins
Despite everything I just said, I don’t think you must chase every leaked byte or every wasted CPU cycle. Doing so isn’t worth the effort. Your time is better spent writing new features, squashing bugs, or even taking a vacation. Cocoa has small leaks, which means that even if your program is perfect, it may still have some leaks you can’t remove. Focus on the things that impact the user. A thousand bytes leaked over the run of the program don’t matter. A thousand bytes lost every second matter quite a lot.
Welcome to Instruments
Instruments is one of the most powerful performance tools ever developed, and it can be one of the easiest to use. That doesn’t mean that using it is always easy. Many things in Instruments don’t work entirely correctly because of default configurations, but once you know the handful of things to reconfigure, no tool is more adept at finding performance problems quickly.
In this chapter, you will be evaluating a fairly simple piece of code that has several problems. It’s an app that reads a file and displays the contents one character at a time in its main view. You can find the full listing in the ZipText project for this chapter on the book’s website. You can test each revision by changing the REVISON value in ZipTextView.h. Here is the code you’ll be focusing on.
ZipTextView1.m (ZipText)
- (id)initWithFrame:(CGRect)frame text:(NSString *)text {
... Load long string into self.text ...
... Set timer to repeatedly call appendNextCharacter ...
}
- (void)appendNextCharacter {
for (NSUInteger i = 0; i <= self.index; i++) {
if (i < self.text.length) {
UILabel *label = [[UILabel alloc] init];
label.text = [self.text substringWithRange:NSMakeRange(i,1)];
label.opaque = NO;
[label sizeToFit];
CGRect frame = label.frame;
frame.origin = [self originAtIndex:i
fontSize:label.font.pointSize];
label.frame = frame;
[self addSubview:label];
}
}
self.index++;
}
- (CGPoint)originAtIndex:(NSUInteger)index
fontSize:(CGFloat)fontSize {
CGPoint origin;
if (index == 0) {
return CGPointZero;
}
else {
origin = [self originAtIndex:index-1 fontSize:fontSize];
NSString *
prevCharacter = [self.text
substringWithRange:NSMakeRange(index-1,1)];
CGSize
prevCharacterSize = [prevCharacter sizeWithFont:
[UIFont systemFontOfSize:fontSize]];
origin.x += prevCharacterSize.width;
if (origin.x > CGRectGetWidth(self.view.bounds)) {
origin.x = 0;
origin.y += prevCharacterSize.height;
}
return origin;
}
}
This program starts out well, but quickly slows to a crawl and starts displaying memory warnings. To figure out what is going wrong, start by launching Instruments using Product⇒Profile in Xcode. Here are a few things to note before diving into the details:
• By default, Instruments builds in Release mode. This can display radically different performance than Debug mode, but it’s usually what you want. If you want to profile in Debug mode, you can modify the mode in the scheme.
• Performance in the simulator and on a device can be radically different. Most of the time, it’s important to profile only on a device.
• Instruments often has a difficult time finding the symbols for the current application. You’ll often need to re-symbolicate the document using File⇒Re-Symbolicate Document.
The last bug in Instruments is extremely frustrating and difficult to eliminate completely. Apple says that Instruments is supposed to find its symbols using Spotlight, but this almost never works. I recommend duplicating rdar://10158512 at bugreport.apple.com. See http://openradar.appspot.com/10158512 for the text of this bug report.
In my experience, if you add the following directory to Preferences⇒Search Paths, you can at least press the Symbolicate button, rather than search for the dSYM by hand:
~/Library/Developer/Xcode/DerivedData
If you have to search by hand, note that the dSYM is in the following directory:
~/Library/Developer/Xcode/DerivedData/<app>/Build/Products/Release-iphoneos
In the rest of this chapter, assume that I have symbolicated whenever required.
Finding Memory Problems
Many performance problems can be tracked to memory problems. If you’re seeing unexpected memory warnings, it’s probably best to track those down first. Use the Allocations template in Instruments. Figure 20-1 shows the result.
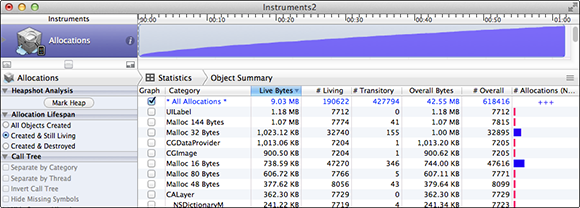
Figure 20-1 Allocations Instrument
Looking at the graph, memory allocations are clearly out of control in this app. Memory use is constantly growing. By sorting the Live Bytes column, you see that the largest memory use is in UILabel and that there are over 7,000 of them currently allocated after just one minute. That’s very suspicious. Click the arrow beside UILabel to get more information and press Cmd-E to show Extended Detail (see Figure 20-2).
Here you see that the UILabel is created in –[ViewController appendNextCharacter]. If you double-click that stack frame, you will see the code along with hot-spot coloring indicating how much time is spent in each line of code (see Figure 20-3).
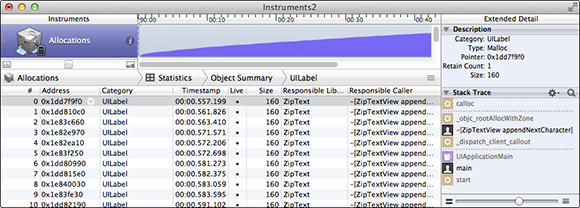
Figure 20-2 Extended Detail for Allocations
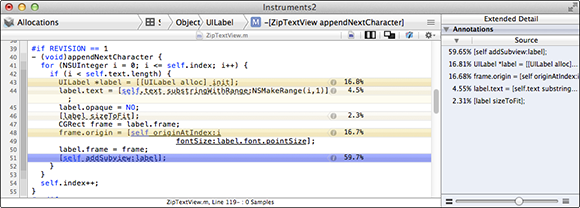
Figure 20-3 Code View
A little investigation here shows the problem. Every time this method is called, it re-creates all of the labels instead of just creating one new one. You just need to remove the loop, as shown here:
ZipTextView2.m (ZipText)
for (NSUInteger i = 0; i <= self.index; i++)
and replace it with the assignment
NSUInteger i = self.index;
Now, when you rerun Instruments, memory usage is better. After a minute, you’re using less than 2MB, rather than more than 9MB, but steady memory growth over time is still a problem. In this case, it’s pretty obvious that the problem is the UILabel views, but this is a good opportunity to demonstrate how to use heapshot analysis. Launch ZipText again with the Allocations instrument, and after a few seconds press the Mark Heap button. Let it run few a few seconds and then press Mark Heap again. This shows all the objects that were created between those two points and haven’t been destroyed yet. This is a great way to figure out which objects are being leaked when you perform an operation. Figure 20-4 shows that in about six seconds, we’ve created 148 new UILabel objects.
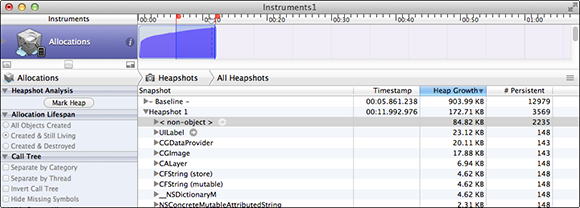
Figure 20-4 Improved memory management
At this point, you should be reevaluating the choice to use a separate UILabel for every character. Maybe a single UILabel, UITextView or even a custom drawRect: would have been a better choice here. ZipTextView3 demonstrates how to implement this with a custom drawRect:.
ZipTextView3.m (ZipText)
- (void)appendNextCharacter {
self.index++;
[self setNeedsDisplay];
}
- (void)drawRect:(CGRect)rect {
for (NSUInteger i = 0; i <= self.index; i++) {
if (i < self.text.length) {
NSString *character = [self.text substringWithRange:
NSMakeRange(i, 1)];
[character drawAtPoint:[self originAtIndex:i fontSize:kFontSize]
withFont:[UIFont systemFontOfSize:kFontSize]];
}
}
}
One more run, and as you see in Figure 20-5, there’s no memory growth at all. But now performance has slowed to a crawl. Before moving on to CPU performance problems, here are a few more useful tips for memory performance investigations:
• Clicking the small i beside the Allocations instrument lets you set various options. One of the most useful options is to change the Track Display from Current Bytes to Allocation Density. This graphs how many allocations happen during a sample period. This indicates where you may have excessive memory churn. Allocating memory can be expensive, so you don’t want to rapidly create and destroy thousands of objects if you can avoid it.
• The Leaks instrument can be useful occasionally, but don’t expect too much from it. It only looks for unreferenced memory. It won’t detect retain loops, which are more common. Nor will it detect memory you fail to release, like the UILabel views in the previous example. It also can have false positives. For example, it often shows one or two small leaks during program startup. If you see new leaks show up every time you perform an action or regularly at some time interval, then it’s definitely worth investigating. Generally, heapshot is a more useful tool in tracking down lost memory problems.
• Keep track of whether you’re looking at Live Bytes or not. Instruments keeps track of both total and net allocations. Net allocations are allocated memory minus freed memory. If you create and destroy objects regularly, total allocations may be orders of magnitude greater than net allocations. Instruments sometimes refers to net allocations as live or still living. In the main screen (refer to Figure 20-1), the graph in the final column shows total allocations as a light bar and net allocations as a darker bar.
• Remember that the Leaks instrument and the Allocations instrument can tell you only where memory was allocated. This has nothing to do with when memory was leaked. The allocation point probably isn’t where your bug is.
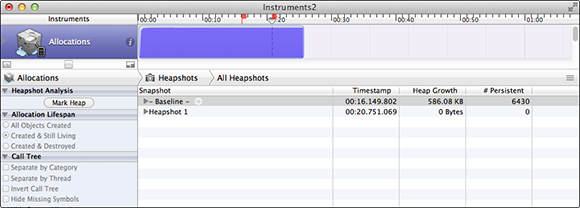
Figure 20-5 Memory footprint of ZipTextView with custom drawing
A Word on Memory Allocation
All objects in Objective-C are allocated on the heap. Calls to +alloc eventually turn into calls to malloc(), and calls to –dealloc eventually turn into calls to free(). The heap is a shared resource across all threads, and modifying the heap requires a lock. This means that one thread allocating and freeing memory can block another thread allocating and releasing memory. Doing this quickly is called memory churn and should be avoided, particularly in multithreaded applications (including ones using Grand Central Dispatch). iOS has many tricks to minimize the impact of this. Small blocks of memory can often be allocated without modifying the heap. But as a rule, avoid rapidly creating and freeing memory if you can help it. It can be better to reuse objects than to create new ones rapidly. This can conflict with the advantages of using immutable objects (see Chapter 4), so there is a tradeoff.
As an example, when working with NSMutableArray and NSMutableDictionary, consider using removeAllObjects rather than throwing away the collection and making a new one.
Finding CPU Problems
Although we fixed the memory problems in the example, it’s still running much too slowly. After a few paragraphs, it slows to a crawl. Instruments can help with this as well. Profile ZipText again using the Time Profiler Instrument. You will see Time Profiler graph similar to Figure 20-6.
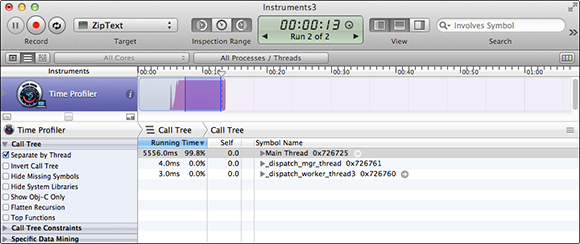
Figure 20-6 Time Profiler analysis of ZipText
What’s important about this graph is that it’s staying at 100%. Programs should seldom run at 100% CPU for very long. Using Option-Drag, you can select part of the graph. The Call Tree list will update to show you the methods and functions called during those samples.
In the Call Tree list, select Invert Call Tree. You will almost always want an inverted call tree. It is bizarre that it’s not the default. The “standard” call tree puts the top-level function at the top. This is always going to be main() for the main thread, which is useless information. You want to know the lowest-level method or function in the stack. Inverting the call tree puts that on top.
Several other Call Tree options are useful at different times:
• Top Functions. This option appeared in Instrumenets at some point, and I’ve never seen documentation on it, but it’s great. It makes a list of the functions (or methods) that are taking the most time. This has become the first place we look when investigating performance problems.
• Separate by Thread. There are reasons to turn this on or off. You definitely want to know what’s taking the most time on your main thread, since this can block the UI. You also, however, want to know what’s taking the most time across all threads. On iPhone and older iPads, there is only one core, so saying that something is being done “in the background” is a bit misleading. The UI thread still has to context-switch to service background threads. Even with the multi-core iPads, “background” threads cost just as much battery life as the UI thread, so you want to keep it under control.
• Hide System Libraries. This only shows “your” code. Many people turn this on immediately, but I generally find it useful to leave it turned off most of the time. You generally want to know where the time is being spent, whether or not it’s in “your” code. Often the biggest time impacts are in system actions like file writes. Hiding system libraries can hide these problems. That said, sometimes it’s easier to understand the call tree if you hide system libraries.
• Show Obj-C Only. This is very similar to Hide System Libraries in that it tends to focus on higher-level code. I tend to leave it turned off for the same reasons I leave Hide System Libraries turned off. But again, it can be useful sometimes to help you find your place in the code.
For ZipText, select Invert Call Tree and Hide System Libraries. In Figure 20-7, you see that originAtIndex:fontSize: is taking most of the time and that it’s being called recursively. A little investigation shows that every character recomputes the location of every previous character. No wonder this runs slowly. You can modify originAtIndex:fontSize: to cache previous results as shown in ZipTextView4.m.
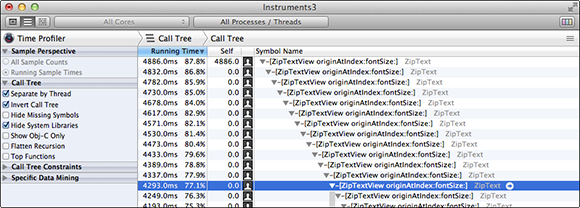
Figure 20-7 ZipText with caching
ZipTextView4.m (ZipText)
@property (nonatomic) NSMutableArray *locations;
...
- (id)initWithFrame:(CGRect)frame text:(NSString *)text {
...
_locations = [NSMutableArray
arrayWithObject:[NSValue
valueWithCGPoint:CGPointZero]];
}
- (CGPoint)originAtIndex:(NSUInteger)index
fontSize:(CGFloat)fontSize {
if ([self.locations count] > index) {
return [self.locations[index] CGPointValue];
}
else {
CGPoint origin = [self originAtIndex:index-1 fontSize:fontSize];
NSString *
prevCharacter = [self.text
substringWithRange:NSMakeRange(index-1,1)];
CGSize
prevCharacterSize = [prevCharacter sizeWithFont:
[UIFont systemFontOfSize:fontSize]];
origin.x += prevCharacterSize.width;
if (origin.x > CGRectGetWidth(self.bounds)) {
origin.x = 0;
origin.y += prevCharacterSize.height;
}
self.locations[index] = [NSValue valueWithCGPoint:origin];
return origin;
}
}
Now things are looking better, but drawing still seems to slow down when it gets about halfway down the screen. You dig into that in the next section.
Here are some other thoughts on hunting down CPU performance issues:
• Operations can take a long time because they are expensive on the CPU or because they block. Blocking operations are a serious problem on the main thread, because the UI can’t update. To look for blocking operations, use the Time Profiler instrument, click the i button to display the options, and select Record Waiting Threads. In the Sample Perspective, select All Sample Counts. This will let you see what is taking the most time on each thread (particularly the main thread), even if it’s blocking.
• By default, the Time Profiler instrument records only User time. It doesn’t count Kernel time against you. Most of the time, this is what you want, but if you’re making a lot of expensive kernel calls, this can skew the results. Click the i button to display the options, and select User & Kernel in Callstacks. You will generally also want to set the Track Display to User and System Libraries, which will separate your code from the system code with a small yellow line.
• Function calls in tight loops are the enemy of performance. An ObjC method call is even worse. The compiler will generally inline functions for you when it makes sense, but just marking a function inline doesn’t guarantee that it will be inlined. For instance, if you ever take a pointer to the function, that function cannot be inlined anymore. Unfortunately, there’s no way to know for certain whether the compiler has inlined a function other than compiling in Release mode (with optimizations) and going and looking at the assembly. The only way to be absolutely certain that something will inline is to make it a macro with #define. I don’t generally like macros, but if you have a piece of code that absolutely must be inlined for performance reasons, you may want to consider it.
• Always do all performance testing in Release mode with optimizations turned on. It’s meaningless to do performance testing on unoptimized Debug code. Optimizations are not linear. One part of your program may be no faster, whereas another may speed up by orders of magnitude. Tight loops are particularly subject to heavy compiler optimization.
• Although Instruments is incredibly powerful, don’t neglect an old standby: small test programs that subtract the end time from the start time. For pure computational work, pulling the algorithm into a test program is often the most convenient approach. You can use a standard Single View template and just put the call to your code in viewDidLoad.
The Accelerate Framework
The most cited framework for improving performance is Accelerate. In my experience, it’s a mixed bag, and you need to approach it as you would any other performance fix—with skepticism and testing. The Accelerate framework is made up of several pieces, including vecLib, vImage, vDSP, BLAS, and LAPACK. Each is distinct, with many similar-but-slightly-different feature sets and data types. This mix makes it difficult to use them together. Accelerate isn’t so much a single framework as a collection of mostly preexisting math libraries that have been stuck together.
None of the Accelerate libraries are good at working on small data sets. If you just need to multiply small matrices (particularly 3 × 3 or 4 × 4, which are very common), Accelerate will be much slower than trivial C code. Calling an Accelerate function in a loop will often be much slower than a simple C implementation. If the function offers a stride option and you don’t need a stride, then writing your own C code may be faster.
A stride lets you skip through a list by a specific size. For example, a stride of 2 uses every other value. This is very useful when you have interleaved data (such as coordinates or image color information).
On multi-core laptops, the Accelerate libraries can be very fast because they are multithreaded. On mobile devices with one or two cores, this advantage may not outweigh its cost for moderate-sized data sets. The Accelerate libraries are also portable, with a history of focusing on the Altivec (PPC) and SSE3 (Intel) vector processors rather than the NEON processor that’s in iOS devices.
For all the Accelerate libraries, you want to gather all your data into one convenient layout so that you can call the Accelerate functions as few times as possible. If at all possible, avoid copying memory, and store your data internally in the format that is fastest for Accelerate, rather than rearrange the data when it’s time to make the performance-critical call.
You’ll generally need to do significant performance testing to determine the fastest approach. Be sure to do all your testing in Release with optimizations turned on. Always start with a simple C implementation as a baseline to make sure you’re getting good payback from Accelerate.
The vImage library is a large collection of image-processing functions and, in my experience, is the most useful portion of Accelerate. In particular, vImage is good at applying matrix operations on high-resolution images very quickly. For most common problems, consider Core Image rather than vImage, but if you need to do the raw math yourself, vImage is quite good at applying matrices and at converting images. Like the other parts of Accelerate, vImage is designed for large data sets. If you’re working with a small number of moderate-sized images, Core Image is likely a better choice.
To use vImage effectively, you need to be aware of the difference between an interleaved and a planer format. Most image formats are interleaved. The red data for a pixel is followed by the green data for that pixel, which is then followed by the blue data, which is followed by the alpha data for the same pixel. That’s the format you’re probably used to from CGBitmapContext with kCGImageAlphaLast. That’s RGBA8888. If the alpha comes first, then it’s ARGB8888. Alpha generally comes first in vImage.
You can also store color information as 16-bit floats rather than 8-bit integers. If you store the alpha first, then the format is called ARBGFFFF.
Planer formats separate the color information into planes. Each plane holds one kind of information. There’s an alpha plane, a red plane, a green plane, and blue plane. If the values are 8-bit integers, then this format is called Planar8. If it’s 16-bit floats, then it’s PlanarF. Although there are planar image formats, most vImage functions work on a single plane at a time, and the functions often don’t care what kind of data the plane holds. There’s no difference between multiplying red information and multiplying blue information.
It’s generally much faster to work on planar formats than interleaved formats. If at all possible, get your data into a planar format as soon as you can, and leave it in that format through the entire transformation process. Generally, you convert back to RGB only when you need to display the information.
vecLib and vDSP are vector libraries with some overlap in their functionality. vecLib tends to be a bit easier to use and is focused on applying a single operation to a large list of numbers. vDSP tends to have much more flexibility (and therefore slower) functions, and it also has very specialized functions relevant to signal processing. If you need those kinds of functions on large tables of numbers, vDSP is likely much faster than your hand-built solutions. The key word here is “large.” If you’re computing only several hundred or a few thousand numbers, simple C solutions can often be faster. The cost of making the function call overwhelms everything else.
BLAS and LAPACK are C versions of well-established FORTRAN libraries. They’re primarily focused on linear algebra. As with other parts of Accelerate, they are best applied for very complex problems. They tend to be slow for solving small systems of equations because of the overhead of the function call. Apple does not provide good documentation for BLAS and LAPACK. If you’re interested in these functions, go to netlib.org and find the FORTRAN documentation. So far, we’ve seldom found them to be really helpful in solving our problems.
GLKit
GLKit is great for integrating OpenGL into your applications, but it also has some hidden gems for fast math. In particular, GLKit offers vector-optimized functions for working with 3 × 3 and 4 × 4 matrices as well as 2-, 3-, and 4-element vectors. As we mentioned in the previous section on the Accelerate framework, flexibility is often the enemy of performance. Functions that can take matrices of arbitrary sizes can never be as optimized as a hard-coded solution for multiplying a 3 × 3 matrix. So, for many of these kinds of problems, I recommend GLKit.
Before you get too excited, GLKit’s math optimizations are not particularly faster than what you would get by hand-coding a C solution and letting the compiler optimize it. But they’re no slower, and they’re easy to use and easy to read. Look for GLKMatrix3, GLKMatrix4, GLKVector2, GLKVector3, and GLKVector4.
Drawing Performance
Set REVISION to 4 in ZipTextView.h and select the Core Animation instrument. You’ll see results like those in Figure 20-8.
The Core Animation instrument displays frames per second. The Time Profiler is configured to show both User and System times in a stacked bar graph. As you see, the frames per second are dropping over time. That suggests we still have a problem.
The Core Animation instrument has several options that can help debug drawing problems. I discuss these shortly. Unfortunately, none of them is particularly helpful in the case of ZipText. The fps output does, however, provide a good metric for testing whether changes are effective. We at least want the fps output to stay constant over time.
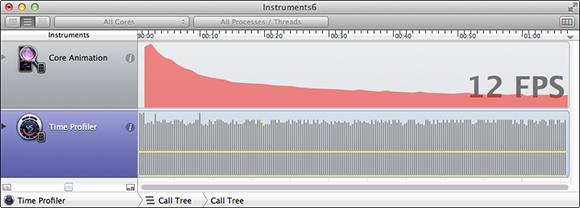
Figure 20-8 Core Animation instrument
Looking at drawRect:, it always draws every character, even though most of the characters never change. In fact, only one small part of the view changes during each update. You can improve performance here by drawing only the part that actually needs updating.
In appendNextCharacter, calculate the rectangle impacted by the new character:
ZipTextView5.m (ZipText)
- (void)appendNextCharacter {
self.index++;
if (self.index < self.text.length) {
CGRect dirtyRect;
dirtyRect.origin = [self originAtIndex:self.index fontSize:kFontSize];
dirtyRect.size = CGSizeMake(kFontSize, kFontSize);
[self setNeedsDisplayInRect:dirtyRect];
}
}
In drawRect:, draw only the character that intersects that rectangle:
- (void)drawRect:(CGRect)rect {
...
CGPoint origin = [self originAtIndex:i fontSize:kFontSize];
if (CGRectContainsPoint(rect, origin)) {
[character drawAtPoint:origin
withFont:[UIFont systemFontOfSize:kFontSize]];
}
...
}
Instruments now reads a steady frame rate of nearly 60 fps. That’s excellent. But don’t misread high frame rates. You want high frame rates when you’re displaying new data, but it’s normal to have low frame rates when nothing is happening. Once your UI is stable, it’s normal and ideal for your frame rate to drop to zero.
The Core Animation instrument has several Debug options in the left-hand pane that can be very useful. The following are some of our most-used options:
• Color Blended Layers. This applies red to any parts of the screen that require color blending. Parts of the screen that don’t require color blending will be green. Color blending generally means nonopaque views. If you have a lot of red on the screen, investigate which views you can make fully opaque.
• Color Misaligned Images. As we discuss in Chapter 8, you always want to draw on pixel boundaries when possible. This will indicate areas of the screen that aren’t aligned with pixel boundaries.
• Flash Updated Regions. This is one of my favorite options. It will flash yellow for any layer that is being updated. For UIs that aren’t games, very little of the UI should update from moment to moment. If you turn this option on and see a lot of yellow, then you’re probably updating the screen more often than you mean to. The granularity of this is the layer, however. So, if you use setNeedsDisplayInRect: to draw only part of a view, the entire view (which is backed by a layer) will flash yellow.
Core Image
For most image-processing needs, Core Image is the best choice. iOS 6 has substantially expanded Core Image. The docs for Core Image tend to be quite good, but here are some tips that may not be obvious:
• If you’re down-sampling images (that is, shrinking them), look at CILanczosScaleTransform. This provides much better quality than a simple affine transform at little cost.
• CIColorCube is generally much faster at color shifting operations than specialized filters like CISepiaTone. CISepiaTone is focused on accuracy, not speed.
• Whenever you finish with a CIFilter, remember to set its input to nil if you’re not going to destroy the filter right away. They retain a frame buffer, and this can use a lot of memory.
• A CIContext can be expensive to create. Reuse it when possible.
• Filtering large images is expensive. See if you can get away with filtering a smaller version and then scaling it up. Often, the quality loss isn’t significant. This is particularly noteworthy with blurs.
For an excellent overview of what’s new in Core Image for iOS 6, I recommend the Session 511 video from WWDC 2012, “Core Image Techniques.”
Optimizing Disk and Network Access
Memory and CPU are the most common performance bottlenecks, but they’re not the only resources to be optimized. Disk and network access are also critical, particularly in prolonging battery life.
The I/O Activity instrument is particularly useful for checking whether you’re hitting the disk more often than you should be. This instrument is most easily accessed through the System Usage template.
Network access is particularly expensive on iOS devices, and it’s worth serious consideration. For instance, creating a new network connection is very expensive. The DNS lookup alone can be incredibly, surprisingly slow. Whenever possible, reuse existing connections. NSURLConnection will do this for you automatically if you use HTTP/1.1. This is yet another reason to prefer it versus hand-built network solutions.
Network access is also a serious drain on the battery. It’s much better for battery life if you batch all your network activity into short bursts. The cost of network utilization is much more proportional to the length of time than to the amount of data. The device will reduce power on its radios when the network is not in use, so providing long periods of quiet with short bursts of activity is the best design.
The Connections instrument can be useful in tracking down network usage, but keep in mind that it tracks all processes on the device, not just yours.
Summary
You need to strongly consider the limited resources of the platform when designing mobile applications. Things that are acceptable on a desktop device will overwhelm an iPhone, bringing it to a crawl and draining its battery. Continual analysis of performance and improvement should be part of every developer’s workflow.
Instruments is one of the best tools available for analyzing your application’s performance. Despite being buggy and at times infuriating, it is nevertheless very powerful and a critical tool in tracking down memory and CPU bottlenecks. It’s also useful for detecting I/O and network overuse. Spend some time with it and experiment. You’ll find it a worthwhile investment.
Accelerate can be useful for very large math operations, but simpler code and higher-level frameworks are often faster for more common operations. Core Image is particularly useful for speeding image processing, and GLKit is useful for small-matrix operations.
In any case, always carefully test the changes you make to improve performance. Many times, the simplest code is actually the best. Find your hotspots with Instruments, and test, test, test.
Further Reading
Apple Documentation
The following documents are available in the iOS Developer Library at developer.apple.com or through the Xcode Documentation and API Reference.
Accelerate Framework Reference
Core Image Programming Guide
File-System Performance Guidelines
GLKit Framework Reference
Instruments User Guide
Memory Usage Performance Guidelines
Performance Overview
Performance Starting Point
WWDC 2012, “Session 511: Core Image Techniques”
Other Resources
Bumgarner, Bill. bbum’s weblog-o-mat. “When Is a Leak Not a Leak?” Good introduction to using heapshot analysis to find lost memory.www.friday.com/bbum/2010/10/17
Netlib. “Netlib Repository at UTK and ORNL.” Documentation of LAPACK and BLAS, which are offered by Accelerate.www.netlib.org