Chapter 1
The Physiology of 3D Perception
1.1 Binocular Viewing or Human Stereopsis
As one eye is capable only of perceiving a planar image, 3D viewing is commonly achieved by the cooperation of both eyes in providing each eye with a view of the object. The images that the eyes receive from the same object are different according to the different locations of the eyes. This binocular viewing provides the perception of depth, the third dimension, as further explained by the horopter circle in Figure 1.1. This circle serves as a reference from which the depth is determined [1, 2]. If the eyes are focusing, for which the synonyms fixating, accommodating, or converging are also used, on point M on the horopter circle, the ciliary muscles of the eyes rotate the eyeballs into such a position that the light from M passes the pupils parallel to the axes of the lenses in the eyes. The axes intersect at M. Then the light hits the retina in Figure 1.1 at the foveas ml for the left eye and mr for the right eye. The foveas are in the center of the retina and exhibit the highest density of light receptors. The rotation of the eyes is called the vergence. Obviously the axes of the eyes are no longer parallel, which will provide the depth information required by the brain [1, 3]. In this situation light from point P hits the retinas at the points pl for the left eye and pr for the right eye. The angles α at the periphery of the circle are, as is known from geometry, the same for all points P on the circle above the distance b between the pupils. As a consequence, also all the angles γ for points on the horopter circle are equal [4]. The angle γ at the retina, measured as a rule in arcmin, is called the disparity or the parallax. As all the points M and P on the horopter circle have the same disparity γ in both eyes, the difference d in the disparities of all points on this circle is zero. The further P is away from M, but still on the horopter circle, the larger is the disparity [2, 3]. Obviously the larger disparity is associated with a smaller depth. The disparity information is transferred to the brain, which translates it into a perceived depth. How the brain fuses the two disparities into a 3D image is not yet fully understood.
Figure 1.1 Horopter circle.
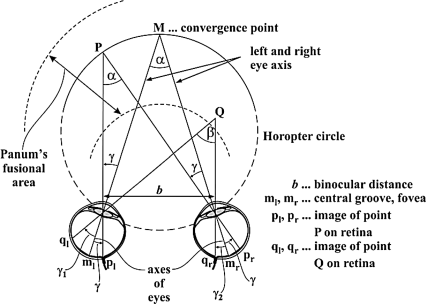
As all points on the horopter circle exhibit a zero difference in disparities, the circle serves as a reference for the depth. The fusion of the disparities and the depth perception as described works only in Panum's fusional area in Figure 1.1 [3]. In this area, reliable depth perception decreases monotonically with increasing magnitude of the disparity. This relationship is called the patent stereopsis. For a point Q in Figure 1.1 [3] not on the horopter circle but closer to the eyes and still in Panum's area, the disparities on the retina are given by the points ql for the left eye and qr for the right eye with the disparities γ1 and γ2. These points lie across the fovea on the other side of the retina and exhibit a so-called crossed disparity, while the points farther away than the horopter have an uncrossed disparity. Their image points corresponding to qr and ql for crossed disparities lie on the opposite side of the fovea.
For point Q the disparities γ1 and γ2 are no longer equal. The value γ1 − γ2 ≠ 0 together with the disparities themselves provide information to the brain on how much the depth of Q is different from the depth on the horopter. However, how the brain copes with this difference of disparities is again not fully known.
When moving an object from the horopter closer to the eye, the patent stereopsis is finally lost at a distance of around 2 m or less from the eyes. Fusion of the images may no longer work and double images, called diplopia, appear [3]. Due to overlarge disparities, the eyes perceive the object they are trying to accommodate and its background separately. The brain unsuccessfully tries to suppress the background information. On the other hand, the further away from the horopter the object is, the smaller is the disparity, because the axes of the lenses become closer to being parallel. Finally, at distances beyond about 10 m the differences between the small disparities can no longer be resolved and the depth information is lost. This coincides with our inability to estimate the difference in depth of objects that are too far away.
The average distance b of the pupils in Figure 1.1 of adults in the USA is 6.5 cm, and for 90% of these adults it lies between 6 and 7 cm [5]. The total range of disparity is about 80 arcmin for the perception of spatial frequencies from 2 to 20 cycles per degree and about 8 arcdegrees for low spatial frequencies around 0.1 cycles per degree [3]. This means that for low spatial frequencies larger disparities are available than for larger spatial frequencies. As a consequence, the sensitivity of disparities for low spatial frequencies is larger than for larger spatial frequencies. The same facts apply also for lower and larger temporal frequencies of the luminance in an image.
The smallest still recognizable disparity, the stereoacuity Dmin, is 20 arcsec in the spatial frequency range of about 2–20 cycles per degree, while the maximum perceivable disparity Dmax is 40 arcmin for low spatial frequencies [3]. As the values for Dmin and Dmax apply to both the crossed and uncrossed disparities standing for different ranges of depths, the values can be added to a total of 80 arcmin for high and 8 arcdegrees for low spatial frequencies, as already given above [6, 7]. Again this is also true for temporal frequencies in dynamic images with a larger sensitivity of disparities for lower temporal frequencies and a lower sensitivity for larger temporal frequencies of luminance.
There are two visual pathways from the retina to the brain. The parvocellular-dominated dorsal–cortical path connects the central retina to the ventral–cortical areas in the visual cortex where spatial patterns and color are analyzed. The magno-cellular-dominated dorsal–cortical path leads from the central and peripheral retina to dorsal–cortical areas in the visual cortex, where optical flow information for heading control and biological motion are investigated. Further information on these paths can be found in [8–10].
The stereoanomalies are associated with defects in these paths of information where there are neurons sensitive to only crossed or uncrossed disparities. The perception of depth is thought to involve responses from both types of neurons. In stereoanomalous individuals, one type of these neurons fails to be sensitive to their information. Then the other type of neurons dominates the response to all disparity information. In the case where neurons are only sensitive to uncrossed disparities belonging to objects located further away than the horopter circle, the information from crossed disparities stemming from objects closer to the eye than the horopter is suppressed in favor of objects far away. The individual perceives the close-up information as far away information with a far away depth. When the neurons are only sensitive to crossed disparities, the individual perceives the far away information with a depth close to the eye [11, 12].
Individuals who are stereoblind, as a rule resulting from a disease called strabismus, are assumed to be entirely lacking in disparity-sensitive neurons.
Under degraded stimulus conditions such as brief stimulus exposure, stereoanomalies are found in 30% of the population [13]. In addition, 6–8% of the population are stereoblind. The relatively large percentage of people incapable of perceiving a 3D image would merit more attention.
Another physiological disturbance is binocular rivalry. In this case an individual views a stereo display with a very large disparity or with interocular misalignment or distortion such that no fusion of the two eyes' image takes place [7, 14]. One eye inhibits the visual activities of the other eye. One view may be visible, as the other eye's view is suppressed, which reverses over time. This is a problem which may be experienced with headworn displays, where two images from different sources may be misaligned or distorted [15].
Two physiological stimuli of depth can be detected by one eye alone. These are disparity and motion parallax. Under this parallax the shift of a moving object toward a still background is understood. The eye together with the brain extracts from this parallax a 3D perception with an associated depth.
Similar to motion parallax is Pulfrich's phenomenon [16]. One eye is covered with a filter which darkens the image. The processing of the dark image is delayed in relation to the processing of the bright image. This leads to disparity errors when the viewer moves relative to an object. However, it can also be used to provide a depth cue, as the delay renders the two eyes' images differently as usually caused by depth.
1.2 The Mismatch of Accommodation and Disparity and the Depths of Focus and of Field
Now we are ready to consider a phenomenon explicable with known stereoptic facts. As we shall see later, in stereoscopic and autostereoscopic displays the two required views of an object are presented next to each other on the screen of a display. The distance to the eyes of the viewer is constant for all scenes displayed. That is the cause of a problem, as the eyes accommodate to the two images with a vergence associated with the disparity. The disparity stimulates a depth perception in the brain. On the other hand, the accommodation of points on the screen also conveys depth information, which is the constant distance to the screen. The two depth details are contradictory, and are called the mismatch of accommodation and vergence or disparity. This may cause discomfort for viewers, manifested by eyestrain, blurred vision, or a slight headache [7]. Fortunately the problems stemming from this mismatch are experienced mainly for short viewing distances of around 0.5 m. A quick and obvious explanation is the already mentioned fact that for larger distances the disparities become smaller and are crowded together on the retina, so the resolution of depth associated with disparity is diminished. Therefore the depth information based on disparity no longer changes much with increasing distances and is more easily matched with the depth information based on accommodation. In practice it was found that a viewing distance of 2 m or more from a TV screen no longer leads to annoying discomfort [7].
A more thorough explanation is derived from the depth of focus and the depth of field, which is also important for the design of a 3D system for moving viewers [17]. We assume that the eyes have focused on an object at point C in Figure 1.2, providing a sharp image. The depth of focus describes the range of distance from a point P nearer to the eye than C to a point D further away than C in which an object can still be detected by applying a given criterion for detection. If the distance of point P is p and that of D is d then the depth of focus T in diopters is
where p and d are expressed in m. The depth of field is
also in m.
Figure 1.2 Depth of focus and depth of field.

Diopters are defined by 1/f, where f is the focal length of a lens in m; in our case the lens is the eye with that f where the eyes experience a sharp image.
Possible criteria for the detectability of features in a display are:
a. the deterioration of visual acuity or of resolving power;
b. the discrimination of least perceptible blurring of the image;
c. the loss of visibility or detectability of target details through loss of contrast; and
d. the perceptual tolerance to out-of-focus blur which results in a stimulus for a change in accommodation.
The first three criteria depend on the perception of out-of-tolerance blur, while the last one depends on physiological tolerance. Point P is called the proximal blurring point, while D is the distal blurring point. Below P and beyond D the image is no longer accepted.
The results reported now are based on criterion (a) and the out-of-focus blur in criterion (d) [17]. A checkerboard test pattern is used and test persons provide the percentage of correct answers in detecting the correct pattern. The test pattern had a size of 1.25 arcmin corresponding to a Snellen notation of 20/25. The diameter of the pupils was 4.6 mm. The test result is shown in Figure 1.3. The abscissa represents the displacement of the test pattern from the fixation point C measured in diopters. Hence the abscissa indicates in diopters the degree to which the test pattern is out of focus. The ordinate represents the percentage of the correct visual resolution perceived for the test pattern. This percentage exhibits a Gaussian probability density.
Figure 1.3 Percentage of correct resolution perceived versus displacement of the test pattern from the fixation point C in Figure 1.2.
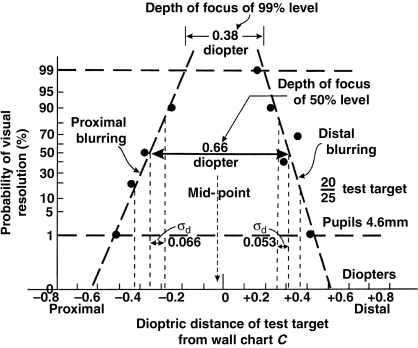
The midpoint of the depth of focus is always slightly nearer to the eye than the focus point C.
For a 50% correct visual resolution, the depth of focus has a width of 0.66 diopters, whereas for 99% the width shrinks to 0.38 diopters. This shrinking is about 0.06 diopters for an increase in the visual resolution of 10% of the proximal blurring. The depth of focus at the 99% level is an important one for the out-of-focus blur at which the visual resolution begins to deteriorate.
The diagram in Figure 1.3 depends upon the location of the fixation point C. This is evident from Table 1.1 with measured distances for the fixation point C in m, the distances p of the proximal and d of the distal blur also in m, as well as the resulting depth of focus T in diopters. Only if T were constant for all points C would the diagram be independent of the location of C. The fixation point C for the diagram in Figure 1.3 is about 1 m from the eye. The depth of field, d − p, in m increases with increasing distance to the fixation point C; it can even become infinite.
Table 1.1 Dependence of proximal and distal blur as well as depth of focus T on location of C.

Further results in [17] relate to the influence of luminance, pupil diameter, and size of object in arcmin on the depth of focus. The larger the luminance, the smaller the diameter of the pupil. At 0.03 cd/m2 the diameter is 6 mm, at 30 cd/m2 it is 3 mm, and at 300 cd/m2 only 2 mm. A linear decrease in the diameter of the pupil is associated with a logarithmic increase in luminance. For a 1 mm decrease of this diameter the depth of focus increases by 0.12 diopters.
For an increase in the object by 0.25 arcmin the depth of focus increases by 0.35 diopters. At a size of 2 arcmin the depth of focus reaches 2 diopters.
The results in Figure 1.3 are very important for those 3D displays where the viewer only has a sharp picture at a given distance from the screen. Figure 1.3 reveals how much the viewer has to move backward and forward while still perceiving an acceptable image.
Newer values for the depth of field depending on the distance of the fixation point C are given in Table 1.2 [18]. Obviously the depth of field increases strongly with increasing distance of the fixation point. So fixation or accommodation on a given point is no longer so important for larger distances. As a consequence for the mismatch of accommodation and disparity, accommodation plays a minor role which also alleviates discomfort. This is no longer true for a fixation point at 0.5 m or closer, meaning that discomfort certainly is a problem for near-to-the-eye displays. For regular 3D displays a viewing distance of at least 2 m should sufficiently minimize discomfort, as already stated above.
Table 1.2 Newer values for those in Table 1.1
| Distance of fixation point C | Distance of low end of depth of field | Distance of high end of depth of field |
| 0.5 | 0.4 | 0.67 |
| 1 | 0.67 | z |
| 2 | 1 | ∞ |
In view of this result, discomfort when viewing 3D movies from larger distances should not occur as a rule. This, however, is not the case, because there is a different effect identified as the cause of discomfort, as discussed in Section 1.6.
Stereoscopic and autostereoscopic displays provide only an illusion of 3D perception. This is among other effects due to the difficulty stemming from the mismatch of accommodation and disparity, resulting in a conflict of depth perception. Contrary to this, integral imaging, holography, and volumetric displays, which will be treated later, do not exhibit this mismatch. There, the viewer, when moving, has the impression of walking around the 3D object, thus experiencing true 3D. On the other hand the viewer would always see the same image in the case of stereoscopic solutions.
1.3 Distance Scaling of Disparity
In stereopsis there are two definitions of perceived distance or depth. The egocentric view refers to the conventional distance D between an observer and an object and is usually measured in m. On the other hand, relative depth is based on the depth interval between a viewer and the reference point on the horopter circle and is measured in radians of the disparity γ on the retina in Figure 1.1. The disparity information γ is connected to D by a strongly nonlinear relation stemming from the geometry shown in Figure 1.1. This relation has to be differently approximated or recalibrated or, in other words, scaled for different regions of distance D [19, 20].
For obtaining a veridical or true value, egocentric distance information D together with the relative depth γ are needed by the brain. It is assumed that the brain combines binocular disparity γ with egocentric distance cues for the process of disparity scaling.
For a large distance D in real-world scenery, the magnitude of the disparity γ varies, as we have seen intuitively from the geometry in Figure 1.1, approximately with the inverse of D2. It was found that γ is also proportional to the interpupillary distance b. This leads to the equation
(1.3)![]()
in which d0, with the dimensions of cm arcmin, is an experimentally determined proportionality factor, called the depth interval and sometimes also the predicted depth [21]; d0 is different for each D and is approximated by a constant in an interval around D.
In stereoscopic displays the disparity γ depends approximately on the separation S between the two images required for 3D perception and inversely on the viewing distance D. Thus
For Equation 1.4, a symmetrical convergence and targets on the retina close to the midsaggital plane symmetrically dividing the body are required.
For a fixed value of S a stereoscopic display will provide the depth interval d0 as
(1.5)![]()
In the denominator the + sign applies for crossed disparities and the − sign for uncrossed disparities. In [22] it was found that this determination of d0 is very robust toward unequal luminances in the two views. If the luminance exceeds 0.63 cd/m2 a 60% difference in the interocular luminance does not harm the perception of the depth interval d0. However, for greater interocular luminance differences the perceived depth may be far away from the correct value. Another luminance-related effect is the discomfort created by interocular luminance differences of more than 25% [22]. Finally, interocular differences in contrast of up to 83% did not affect depth perception, while the threshold for discomfort in this case was between 25% and 50%.
Information leaking from the view in one eye into that of the other eye is known as crosstalk, which as a rule severely damages the quality of the perceived image but can also affect the fusion of the two images. At no crosstalk the fusion is limited by 27 arcmin for crossed disparity and by 24 arcmin for uncrossed disparity. For a 200 ms stimulus, crosstalk has only a small effect on fusion, which is no longer true for a 2 s stimulus [23]. In this case, 2–7% crosstalk can already hamper fusion and can cause discomfort [24].
Autostereoscopic displays may apply spatial multiplexing of the two views, for which an array of lenticular lenses or parallax barriers is used. Lenticular lenses exhibit chromatic aberrations, while barriers produce diffraction by which image content can leak into the wrong eye. The remedy is to limit aberration and diffraction at least for a given position of the viewer.
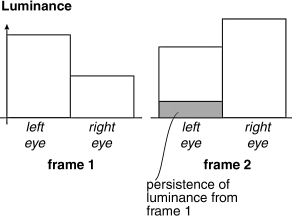
For stereoscopic and autostereoscopic displays with temporal multiplexing, crosstalk occurs due to the persistence of a display, in which the image content of one eye's view is still visible in the next frame when that eye is exposed to a new view. This is shown in Figure 1.4. Temporal multiplexing can also induce flicker seen in the visual periphery. This disrupts vision in large field-of-view immersive displays. The cause is that these displays stimulate the magno-cellular-dominated dorsal–cortical area, which draws connections from the peripheral retina, and above all have a transient response and high temporal acuity, perceived as flicker. A remedy is a high frame rate enabling the visual system to integrate the intermittent information in the periphery [6].
Figure 1.4 Crosstalk due to persistence of luminance in an LCD.
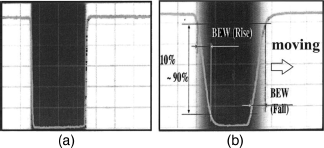
A further, very strong source of crosstalk is blurring of the edges of a moving image. Blur occurs in all displays where the luminance of the image is held constant during the entire frame time. This occurs in liquid crystal displays (LCDs) and in organic light-emitting diode displays (OLED displays). A relatively brief description of this important phenomenon is given here, while a more detailed one can be found on pages 298–300 of [25].
Blur is explained in Figure 1.5a, where a black stripe at rest on an LCD screen can be seen, while Figure 1.5b shows the stripe moving to the right. The edges of the stripe in Figure 1.5a are perfectly sharp but are blurred by the movement in Figure 1.5b. The main cause is that an image on an LCD is held constant during the frame time Tf, which for a frame frequency of f = 60 Hz is given by T = 1/f = 16.66 ms. This holding property does not occur in plasma display panels (PDPs) and in cathode ray tubes (CRTs) and hence they are free of blur.
Figure 1.5 (a) A stationary image and (b) the blurred edge of a moving image on an LCD.
Now we consider what happens to the pixels in the column representing the left edge in Figure 1.5a. Assuming black stands for fully white and white for fully black, then the luminance in the column has to decay from fully white to fully black during the movement. This decay is gradual, as shown in Figure 1.6. The reason is the delayed rotation of the liquid crystal molecules in response to an electric field applied in the first frame in Figure 1.6. The display still provides full luminance at the beginning of the frame time. One frame time later at time Tf the luminance is held at the value it had decayed to at time Tf, as again indicated one frame time later in Figure 1.6. This stepwise decaying luminance continues in Figure 1.6 until fully black is reached. The stepwise decay leads to the blurred left edge in Figure 1.5b and with the same explanation also for the right edge in Figure 1.5b. The duration of the decay is called the blurred edge width (BEW). This duration can also be measured in the number of pixels that the first column has to travel to the right until a decay to black is reached. This number is ν pixels per frame time which provides
(1.6)![]()
Figure 1.6 Decay of luminance of a display and stepwise approximation representing the holding property of an LCD.
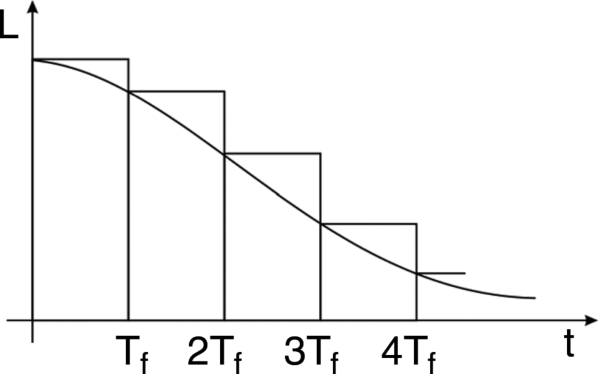
The stripe in Figure 1.5a becomes wider by the blur on each side. A severe consequence for 3D displays is that the gap between the two views required for 3D is filled with blur, which may even extend into the two original images. Thus blur represents crosstalk in both eyes.
Diminishing the width ν of blur is mandatory for shrinking and even avoiding crosstalk in 3D displays. In pursuing this goal we have to understand how blur depends on the frame frequency f and the frame time Tf. This understanding is provided by the physiological law for the perception of a moving picture by the human eye. It states among other things that the eyeballs track the movement of an object perfectly; this is called the smooth pursuit along the track of the movement.
We apply this rule to Figure 1.7a with the coordinates t, with the frame times Tf, 2Tf, etc., and the location m, where the movement ν per time Tf to the right of a black bar (white areas) is indicated. The eye tracking of the movement is carried out in the direction of the arrows along the slanted line in Figure 1.7a. We assume that after time 3Tf, the maximum luminance Lm is reached.
Figure 1.7 Speed of luminous response (a) for 60 Hz and (b) for 120 Hz frame frequencies.
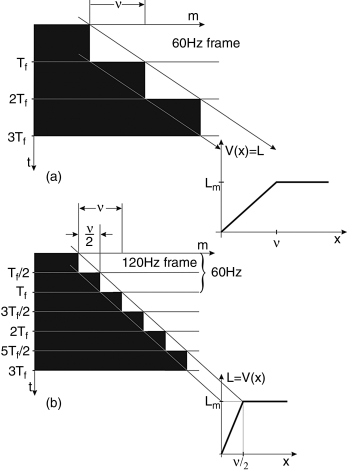
This generates the luminance V(x) over the location x in the diagram in Figure 1.7a, starting with a luminance of zero at x = 0 and Lm at x = ν. The diagram represents the trace of the luminance on the retina.
In order to determine the influence of the frame time, we plot in Figure 1.7b the same diagram but with half the frame time Tf/2 and the same speed ν of movement, resulting in an advance to the right by ν/2 within Tf/2. The pertinent construction of V(x) reveals that the maximum luminance is reached after just half the movement at x = ν/2. As ν represents the width of the blur, this blur is halved and hence crosstalk shrinks to half the width by doubling the frame frequency.
This result has enormous significance for reducing crosstalk by blur in 3D displays. As a rule for 3D displays, a frame frequency of 240 Hz is used for reducing crosstalk by a factor of four in comparison to a 60 Hz frame. In this case crosstalk is virtually invisible, but the addressing circuits have to work at four times the speed.
1.5 Psychological Effects for Depth Perception
The physiological depth perception discussed so far is complemented by a few monocular psychological effects and experiences which are also encountered in 2D displays. They are learned while growing up. With these effects, every 2D picture can induce a 3D impression.
The size of an image on the retina, the real size of which is known, indicates the depth by its actual smaller perceived size. The hiding of an object by closer objects can also create a 3D impression. This perception of so far hidden objects is called dynamic disclosure, while the occlusion of objects is called dynamic occlusion. Both effects convey the sensation of depth. A 3D perspective is also created by two straight lines which intersect at a vanishing point. This was discovered by medieval painters and is now used extensively. Objects becoming bluish and misty with increasing distance also induce the perception of depth. Further, one instinctively assumes that the illumination comes from above, so the length and direction of the shadow also help to perceive depth. Finally, motion parallax, described in the next section, is another strong trigger for depth. Further depth cues to be detailed later are the luminance, contrast, and sharpness of an object.
1.6 High-Level Cognitive Factor
Immersive stereo displays such as 3D movies and 3D TV create real-world scenes by presenting a variety of cues to depth and distance. These cues include binocular disparity, focusing on depth by accommodation, motion parallax, linear perspective, and texture perspective. For ease of viewing, all these cognitive factors are supposed to provide the same magnitude of depth, otherwise the viewer experiences high-level cue conflict – high level because reasoning is involved, as we shall see below. Cue conflict induces discomfort, as viewers may encounter in watching 3D movies [7].
This can be illustrated by a stereo scene of an American football game [26]. Binocular disparity information may provide a depth perception of a few inches, while linear and texture perceptive information could convey depths of several tens of yards consistent with the football field. A viewer exposed to this conflict over a longer time will complain of discomfort. Psychologists explain this by assuming that human reasoning is based on two modes of operation: activity in an analytical and in an intuitive system [26]. The analytical system permits conscious rule-based reasoning, while the intuitive system is based on situational pattern recognition. The latter approach uses information derived from immersive stereo displays consisting of the perception of simultaneous redundant traits such as the psychological features mentioned in Section 1.5. That way, immersive stereo displays stimulate the intuitive system. However, there are exceptions, such as the perception of motion parallax, which provides a stereo impression in the intuitive system that, as a rule, does not exist in immersive stereo displays.
For a deeper understanding of this statement we have to look at the motion parallax shown in Figure 1.8. If a viewer is moving to the right with eyes fixed on the stationary point F, then the stationary objects behind F are perceived as moving in the same direction to the right as the viewer, while those in front of F are perceived as moving to the left. This motion parallax is part of the intuitive experience of the viewer and provides the locomotive viewer with depth information relative to F.
Figure 1.8 Motion parallax.

Now we consider single view immersive stereoscopic and autostereoscopic displays in which the 3D impression can only be perceived from a single given position of the viewer. This implies that there is no full motion parallax, because the entire scene is placed on the plane of the display screen. The eyes focus on point F on that plane and all objects are perceived to be further away than F, that is, in an area where the objects seem to move in the same direction as the viewer. Objects closer than F and their movement against the viewer's movement do not exist [27].
The fact that there is no full motion parallax in single view stereoscopic and autostereoscopic displays contributes to confusion in the viewer's brain, causing discomfort. This discomfort disappears in multiview stereoscopic and autostereoscopic displays where the regular motion parallax can be detected from a few specific viewing positions.
Obviously the discomfort originating from immersive stereoscopic and autostereoscopic displays is not caused by the mismatch of accommodation and disparity which, as we know, plays virtually no role in viewing from larger distances associated with immersive displays.
The author gratefully acknowledges permission to reproduce a figure granted by the institution named below. The source of the figure is also listed below together with its corresponding number in this book.
Optical Society of America (OSA)
Journal of the Optical Society of America, vol. 49, no. 2, March 1959, p. 276, figure 2 Reproduced as Figure 1.3
1. Wheatstone, C. (1838) Contributions to the physiology of vision. Philos. Trans. R. Soc. A, 128, 371.
2. Okoshi, T. (1976) Three Dimensional Imaging Techniques, Academic Press, New York.
3. Patterson, R. (2009) Human factors of stereoscopic displays. SID 09, p. 805
4. Bader, G. (1999) Elektrooptische Signalverarbeitung zur Darstellung autostereoskopischer Bewegtbilder und zur Strukturerkennung. PhD thesis. University of Stuttgart.
5. Ferwerda, J.G. (1990) The World of 3D: 3D Book Productions, Borger.
6. Patterson, R. (2007) Human factors of 3D displays. J. SID, 151 (11), 861.
7. Patterson, R. (2009) Human factors of stereodisplays: an update. J. SID, 17 (112), 987.
8. Livingstone, M.G. and Hubel, O.H. (1988) Segregation of form, color movement and depth: anatomy, physiology and perception. Science, 240, 740.
9. Schiller, P.H. et al. (1990) Role of the color opponent and broad band channels in vision. Visual Neurosci., 5, 321.
10. Milner, A.D. and Gordale, M.A. (1995) The Visual Brain in Action, Oxford University Press, Oxford.
11. Patterson, R. and Fox, R. (1984) The effect of testing method on stereoanomaly. Vision Res., 25 (3), 403.
12. Cumming, B.G. and Destagelis, G.C. (2001) The physiology of stereopsis. Am. Rev. Neurosci., 24, 203.
13. Richards, W. (1970) Stereopsis and stereoblindness: experimental. Brain Res., 10, 380.
14. Howard, I.P. (2002) Seeing in Depth: Vol. 1, Base Mechanisms; Vol. 2, Depth Perception, Porteous, New York.
15. Blake, R.R. (2001) A primer on binocular rivalry including current controversies. Brain Mind, 2, 5.
16. Adelson, S.J. et al. (1991) Comparison of 3D display and depth enhanced techniques. SID Dig., 321, 25.
17. Ogle, K.N. and Schwartz, J.T. (1959) Depth of focus of the human eye. J. Opt. Soc. Am., 49 (3), 273.
18. Wang, B. and Cinffreda, K.J. (2006) Depth of focus of the human eye: theory and clinical application. Surv. Ophthalmol., 51, 75.
19. Patterson, R. et al. (2006) Perceptual issues in the use of headmounted visual displays. Hum. Factors, 48, 555.
20. Ono, H. and Comerford, T. (1977) Stereoscopic Depth Constancy, Image Society, John Wiley & Sons, Inc., New York/Bethesda, MD, p. 91.
21. Cormack, B.H. and Fox, R. (1985) The computation of retinal disparity. Attention, Percept. Psychophys., 37, 176.
22. Boydstun, A.S. et al. (2009) Stereoscopic depth perception survives significant interocular luminance differences. J. SID, 17, 467.
23. Yeh, Y. and Silverstein, L. (1990) Limits of fusion and depth judgements in stereoscopic color displays. Hum. Factors, 32, 45.
24. Kovi, F.L. and Toet, A. (2004) Visual comfort of binocular and 3D displays. Displays, 25, 99.
25. Lueder, E. (2010) Liquid Crystal Displays – Addressing Schemes and Electro-Optical Effects, 2nd edn, John Wiley & Sons, Ltd, Chichester.
26. Patterson, R. and Silzars, A. (2009) Immersive stereo displays, intuitive reasoning and cognitive engineering. J. SID, 17, 443.
27. Private Communication by Aris Silzars (June 2010).
