
Chapter 10: Working with the Cypress Framework
As highlighted in Chapter 3, Top Web Test Automation Frameworks, Cypress is the fastest-growing cross-browser and developer-friendly test automation framework. Focused on JavaScript and TypeScript development languages, the framework offers an end-to-end web application testing ability. While Cypress is an open source framework, as opposed to Selenium and other featured frameworks in this book, Cypress also has a paid functionality through its dashboard (https://docs.cypress.io/guides/dashboard/introduction#Features) and reporting platform. In this chapter, you will get a technical overview of the framework with a focus on its advanced capabilities, including time travel, component testing, network control, API testing, supported plugins, cloud testing, and support for Behavior-Driven Development (BDD) testing.
The chapter will cover the following topics:
- Getting started with Cypress and running a first test scenario
- Highlighting the most advanced and important-to-know capabilities of the framework
- Understanding where the framework is heading in the future
The goal of this chapter is to help frontend developers enrich their test automation coverage with more advanced capabilities of the framework, whether they are built-in features or plugins.
Technical requirements
The code files for this chapter can be found here: https://github.com/PacktPublishing/A-Frontend-Web-Developers-Guide-to-Testing.
Getting started with Cypress
As explained in Chapter 3, Top Web Test Automation Frameworks, to get started with the Cypress (https://www.cypress.io/) framework, you need to install the node package through the following command line:
npm install cypress -D
After the installation is complete, you can use both the Cypress GUI and the IDE (in our case, we will use Visual Studio Code) to run your Cypress tests.
Launching the Cypress GUI is done by running the following command:
npx cypress open
The Cypress GUI
After launching the Cypress GUI using the preceding command, you will be presented with three windows:
- Tests: This gives an overview of scripts and execution. In this window, you can either launch a single JavaScript or TypeScript test against any of your local browsers.
- Runs: In this window, a user can log in to the dashboard and run tests in parallel, identify test flakiness and debug failures, manage multiple users and organizations, integrate easily with the Jira defect management tool as well as CI tools, and get more scaled analytics on the overall test suites.
- Settings: In this window, a user can review their Cypress workspace configuration, the Node.js version used, the proxy settings configuration, the file opener preference, and so on:
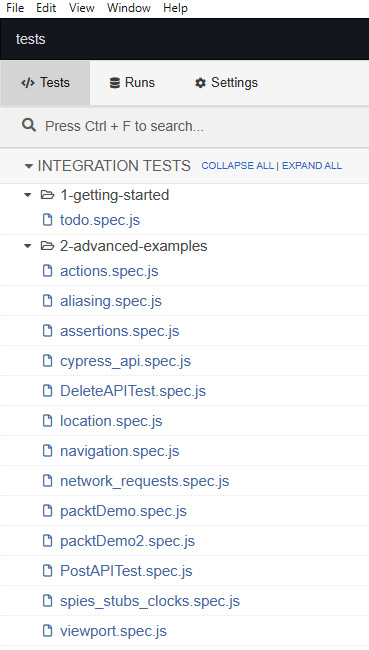
Figure 10.1 – The Cypress GUI main window with a focus on the Tests tab
When running a test script from the GUI runner, the practitioner sees in real time all the steps running side by side on the browser and the website under test. It provides a unique time-travel ability that shows upon each step in the test what happened, what the website status was, and so on:
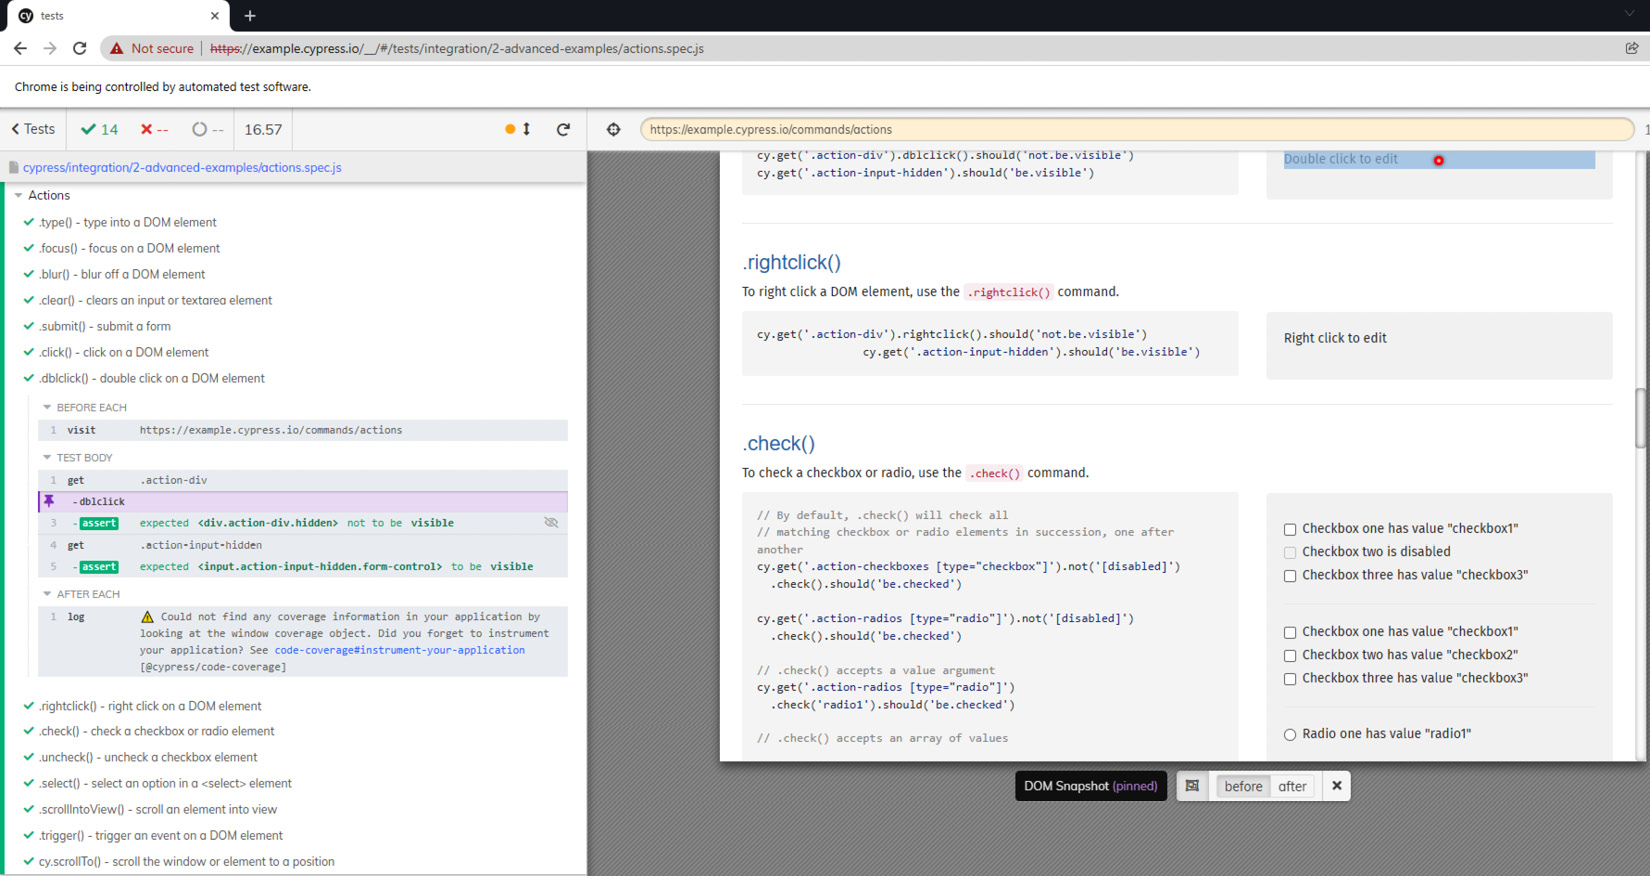
Figure 10.2 – The Cypress test execution window with the time-travel ability demonstrated
Another great feature that can be used within the GUI runner is the Cypress selector. The Cypress selector is an advanced built-in object spy that can be used to analyze the DOM elements, as well as provide the element locator IDs to be used in test code creation:
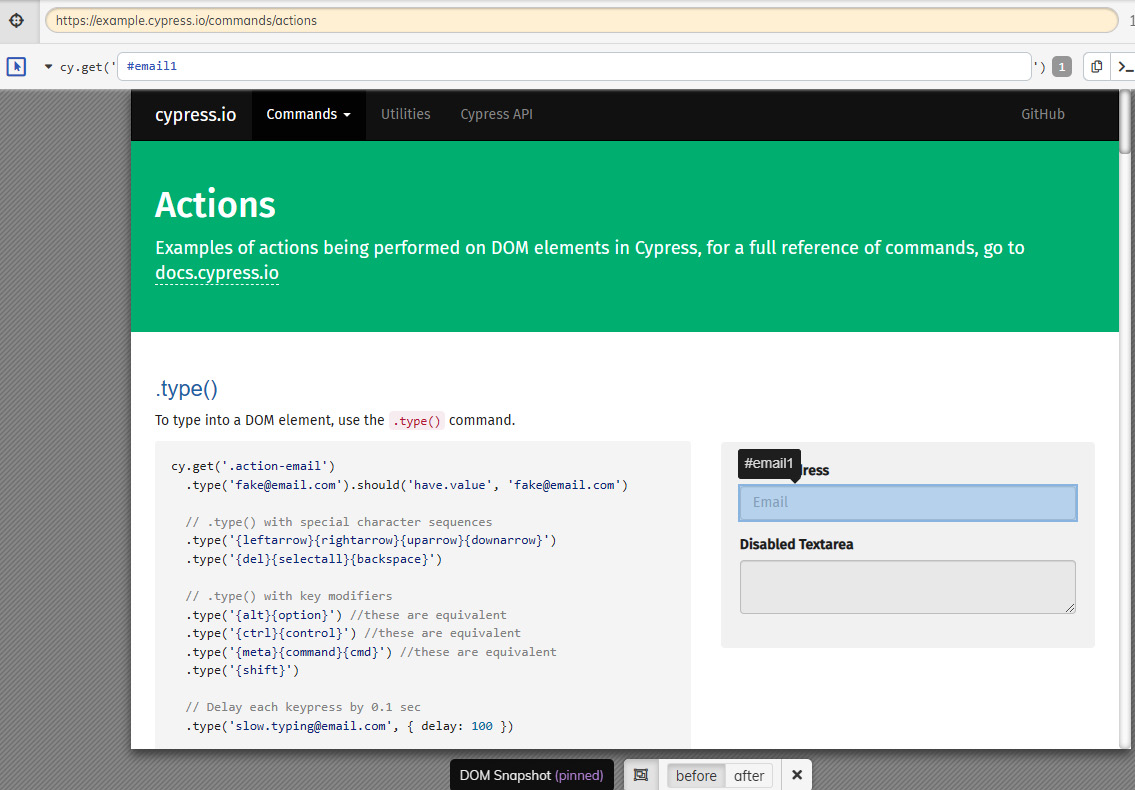
Figure 10.3 – The Cypress element selector capabilities within the Cypress GUI
In the preceding Cypress selector screenshot, a user can analyze and copy and paste the textbox element locator into their JavaScript test code (in this case, the element ID is #email1).
Cypress IDE and command-line executions
Alternatively, to run the Cypress tests from the command line within an IDE such as Visual Studio Code and utilize the Cypress dashboard, you will need to log in with a valid email and place the generated project ID in the cypress.json file. You will also receive a new private generated key. Running the following command will execute and present in the web-based dashboard your test results:
npx cypress run --record --key ["private key"]
If all was properly set up, you should see in your command-line output the execution progress, as well as the results being populated on your Cypress dashboard:
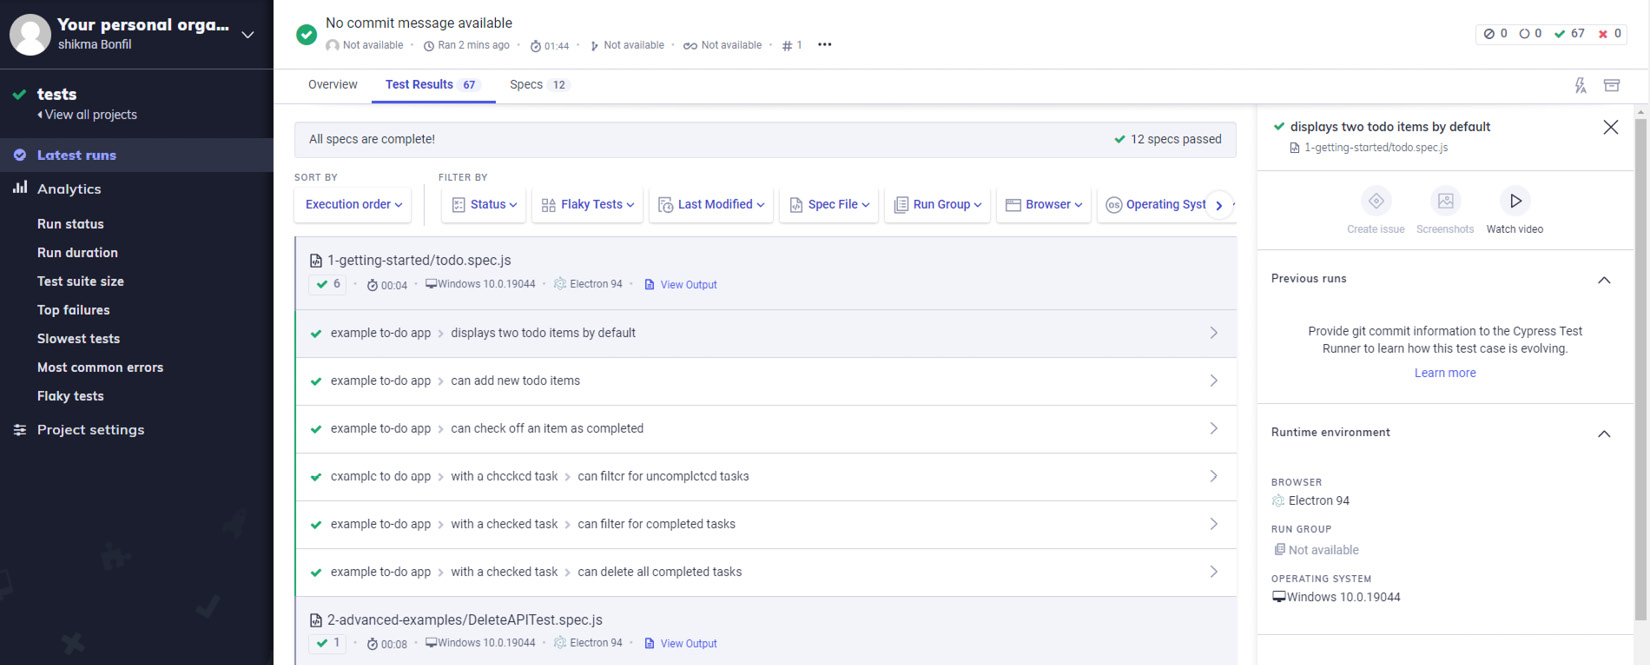
Figure 10.4 – The Cypress dashboard test results output
As you can see from the preceding dashboard screenshot, there are a few pillars of the platform that include the test results (passed, failed, pending, and so on) and the test execution insights, covering test duration, the slowest tests, test suite size, and so on. In the paid version, users can also obtain much deeper insights from their suite as well as more test analysis and scale.
To run Cypress tests in parallel, you will need to set up local machines with the supported CI servers (Jenkins, Bitbucket Pipelines, GitLab, GitHub Actions, CircleCI, and so on), and pass the --parallel command-line option at the end of the aforementioned execution command (https://docs.cypress.io/guides/guides/parallelization#Overview).
To get the feel for a simple Cypress JavaScript test scenario that navigates to the Packt website and checks the different viewport visuals when changing screen resolutions, we have created the following test code. The first validation is to provide the test with a very small screen resolution that will collapse the main home page navigation bar, then expand the size to various sizes, and assert the screen's UI.
To execute all of your test code from the command line, you will need to use the following option from your IDE command line:
npx cypress run --headed
To specifically run a JavaScript test spec, you will need to add the --spec command-line option with the path to the specific test file:
/// <reference types="cypress" />
context('Viewport', () => {
beforeEach(() => {
cy.visit('https://www.packtpub.com')
})
it('cy.viewport() - set the viewport size and dimension',
() => {
// https://on.cypress.io/viewport
cy.get('#search').should('be.visible')
cy.viewport(320, 480)
cy.viewport(2999, 2999)
cy.viewport('macbook-15')
cy.wait(200)
cy.viewport('macbook-13')
cy.wait(200)
cy.viewport('macbook-11')
cy.wait(200)
cy.viewport('ipad-2')
cy.wait(200)
cy.viewport('ipad-mini')
cy.wait(200)
cy.viewport('iphone-6+')
cy.wait(200)
cy.viewport('iphone-6')
cy.wait(200)
cy.viewport('iphone-5')
cy.wait(200)
cy.viewport('iphone-4')
cy.wait(200)
cy.viewport('iphone-3')
cy.wait(200)
// cy.viewport() accepts an orientation for all presets
// the default orientation is 'portrait'
cy.viewport('ipad-2', 'portrait')
cy.wait(200)
cy.viewport('iphone-4', 'landscape')
cy.wait(200)
// The viewport will be reset back to the default
// dimensions in between tests (the default can be set
// in cypress.json)
})
})
After running the preceding functional test spec from the Cypress GUI, we will see how the Packt home page looks with various screen sizes and resolutions. Specifically, as shown in the following screenshot, we can see what the page will look like in an iPhone 6+ smartphone screen resolution:
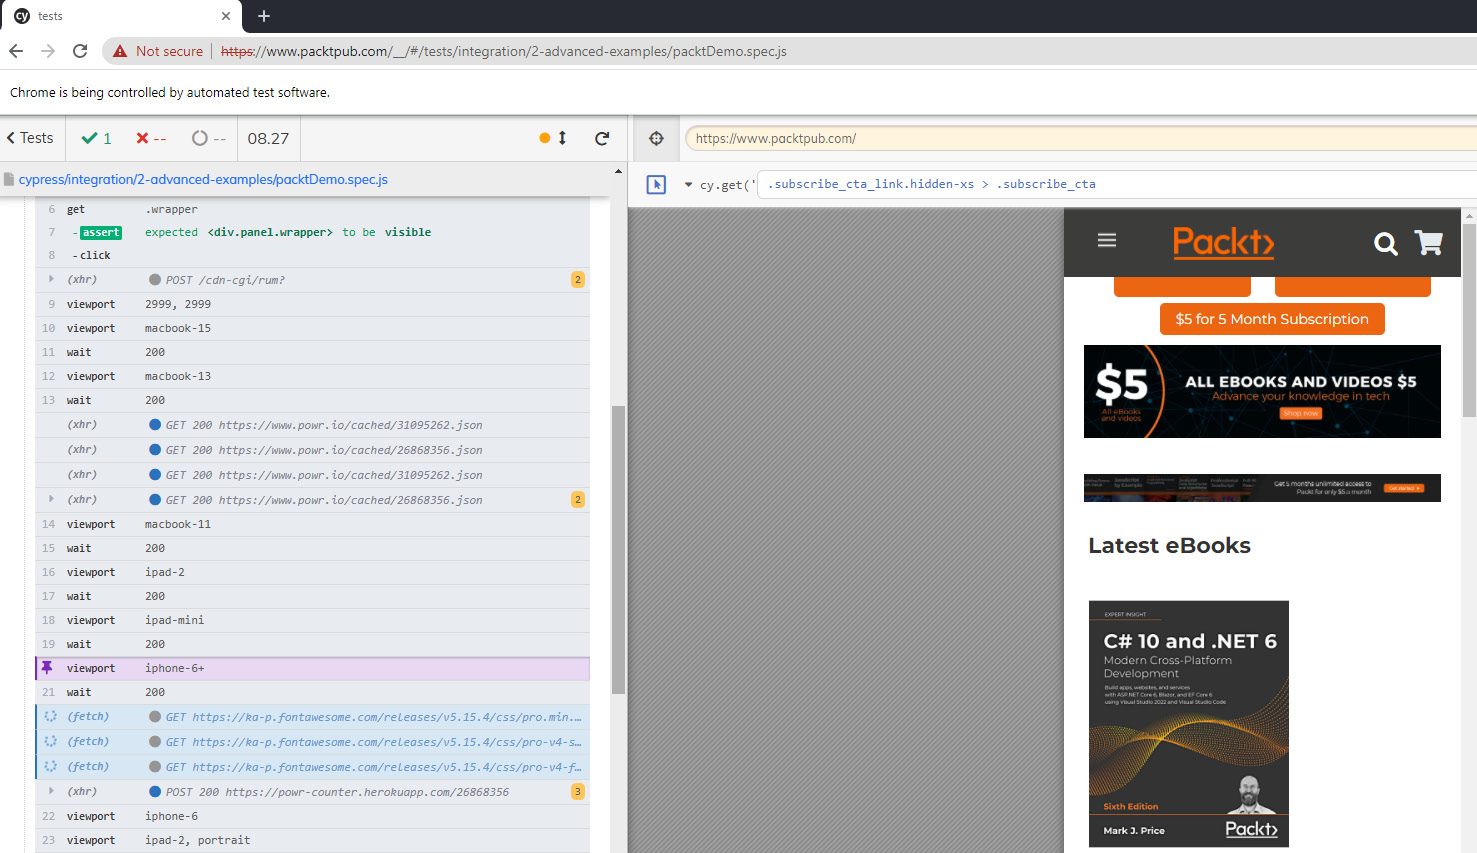
Figure 10.5 – The Cypress viewport test execution output on the Packt homepage
Now that we successfully have set up a Cypress test environment and explored the two main methods of running Cypress test code (the GUI and the IDE command line), let's explore the most advanced features of the Cypress framework.
Cypress's advanced test automation capabilities
In Chapter 9, Working with the Selenium Framework, we explored the advanced features of the framework that frontend developers and SDETs can use, and we will now do a similar overview of the most advanced features of Cypress.
Note that measuring code coverage is also considered a powerful capability within software test automation; however, since we covered the abilities of code coverage with Istanbul and Babel in Chapter 8, Measuring Test Coverage of the Web Application, we will not repeat it here.
Cypress test retries
When creating test automation scenarios, one of the most complex cases as well as the most time-consuming is test stability and flakiness. Tests can often fail due to platform availability, environmental issues such as loss of network connectivity on the test machine, synchronization issues on the web application under tests, and so on. For such cases, Cypress offers a test retry mechanism (https://docs.cypress.io/guides/guides/test-retries#How-It-Works) that, in cases of failures, will attempt to rerun tests up to three times prior to marking them as failed.
To enjoy this useful feature globally for all your tests, you will need to add a short block of code to the cypress.json file, as shown here:
{
"retries": {
// Configure retry attempts for 'cypress run'
// Default is 0
"runMode": 2,
// Configure retry attempts for 'cypress open'
// Default is 0
"openMode": 0
}
}
Alternatively, to use this feature on a test-by-test case basis, you will need to include this code block within the JavaScript test spec:
It(
'do something',
{
retries: {
runMode: 2,
openMode: 1,
},
},…
When using the retry mechanism, all flaky and retried test executions are visible in the Cypress web-based dashboard. Users can go to the project test suite menu, and within the Flaky tests option, they can look at the identified flaky test cases, as well as see the overall percentage of flakiness within the project. Users can then analyze and decide what the next steps are for these unstable test scenarios.
Using stubs, spies, and clocks with Cypress
When it comes to developing units, APIs, and integration tests, having the ability to manipulate output or force different behaviors of your web application can expand your test coverage and uncover defects earlier in the cycle. For that purpose, Cypress comes equipped with stubbing, spying, and mocking tools through its bundled Sinon.js (https://sinonjs.org/), Lolex (https://github.com/sinonjs/fake-timers), and Sinon-chai (https://github.com/domenic/sinon-chai) libraries.
To better understand the use of the Cypress network control and specifically the cy.clock() method, here is a short code sample that goes to a Cypress web page (https://example.cypress.io/commands/spies-stubs-clocks), which is used for demonstration purposes, and validates the time by moving the clock 10 seconds forward through the cy.tick() method:
/// <reference types="cypress" />
const now = new Date(Date.UTC(2017, 2, 14)).getTime()
context('Viewport', () => {
beforeEach(() => {
cy.visit('https://example.cypress.io/commands/
spies-stubs-clocks')
})
it('set timer',() => {
cy.clock(now)
cy.get('#tick-div').click().should('have.text',
'1489449600')
cy.tick(10000) // 10 seconds passed
cy.get('#tick-div').click().should('have.text',
'1489449610')
cy.wait(2000)
cy.clock()
cy.tick(60000)
cy.clock().invoke('restore')
})
})
In the preceding code snippet, we are setting the date in Coordinated Universal Time (UTC) (https://en.wikipedia.org/wiki/Coordinated_Universal_Time) to keep it consistent and the same for each test run (we are using February 14, 2017). Within the test, we are initiating the clock to the current time and then validating the time prior to using the cy.tick(10000) method and afterward to assert that 10 seconds moved by running the command.
After running the preceding test code, we can see in the following screenshot (taken from the Cypress GUI runner) the before and after time change after using the clock and tick commands:
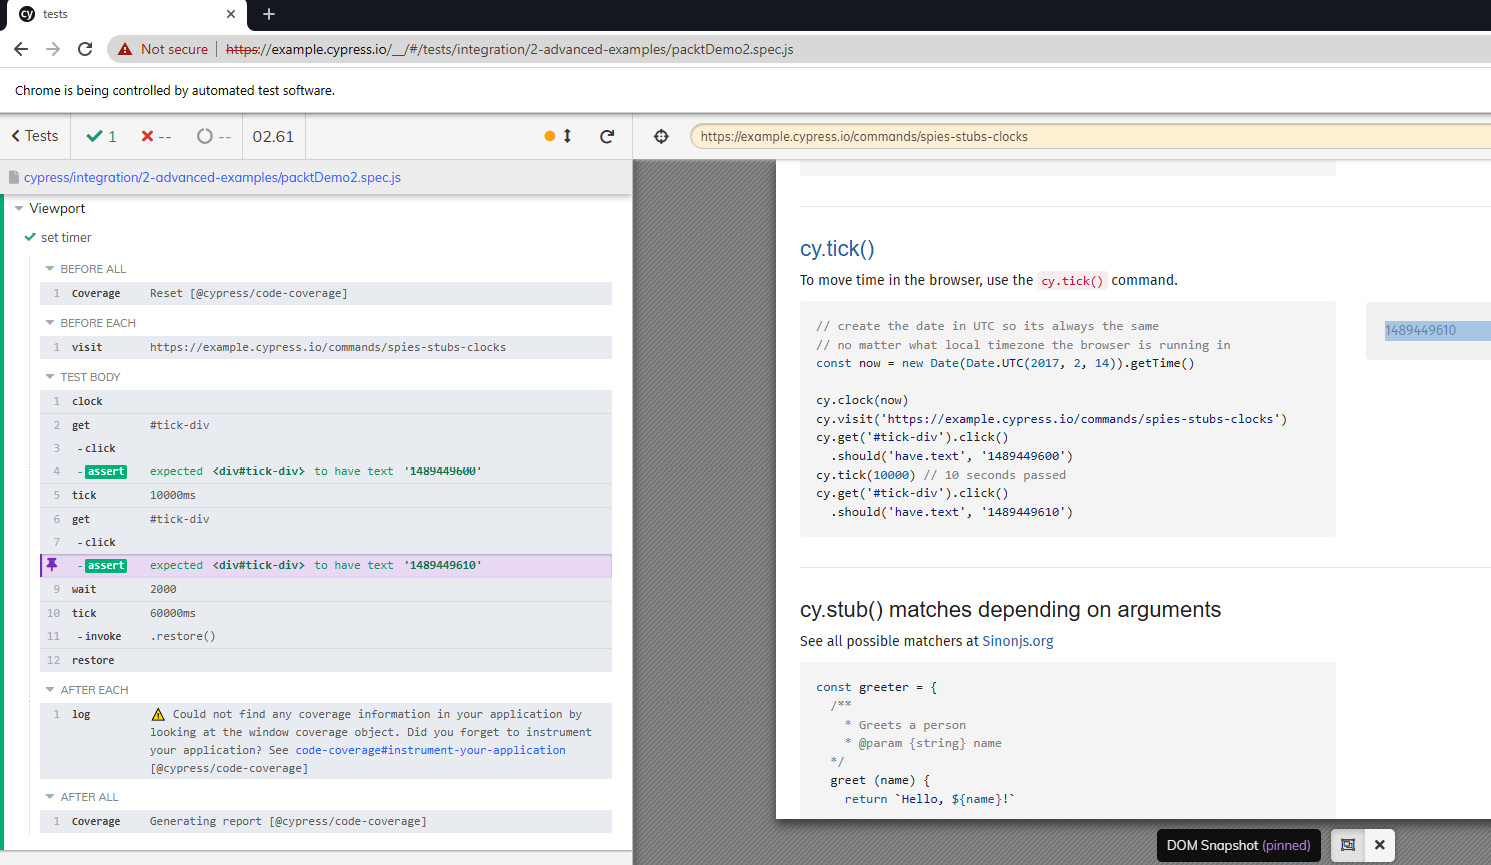
Figure 10.6 – The Cypress clock and tick methods used to push the actual time 10 seconds forward
Within Cypress, you can also use cy.stub() inherited from the SinonJS library to validate different outputs for a test, as well as use the various SinonJS matchers (https://sinonjs.org/releases/latest/matchers/).
Capabilities such as stubbing and network/clock control are very beneficial for test coverage expansion with more negative and boundary conditions, as well as different test case conditions. If you need to validate a web page's output if there is a specified time change or other input to the page, you can use the preceding capabilities and make the proper assertions.
Lastly, for this section, it is very important to be familiar with the cy.intercept() method. This capability is super-powerful in routing API calls from the original/expected and often cached routes to a "controlled" and specific one. This helps to test more often, across different scenarios, and sometimes prior to the real production API being available for testing (https://docs.cypress.io/api/commands/intercept#cy-intercept-and-request-caching). As documented in detail on the Cypress website (https://docs.cypress.io/api/commands/intercept#Matching-url), using the intercept option can provide greater flexibility to test against production, QA, staging, and other environments within a single test code.
Running Cypress within CI
Creating test automation is great; however, within Agile teams and to save time, a lot of tests are being integrated into a CI process that runs them upon a specified trigger. Such a trigger can be any code change made within the source code repository or at a specific time within a day. Cypress integrates perfectly with most of the CI server tools (https://docs.cypress.io/guides/continuous-integration/ci-provider-examples), including CircleCI, Jenkins, GitHub Actions, GitLab, AWS CodeBuild, and Bitbucket Pipelines. You can also configure a local Docker image (https://github.com/cypress-io/cypress-docker-images) that will run your tests via a GitHub action in a container. Note that Cypress already provides ready-made Docker images on Docker Hub. A step-by-step guide on how to configure and run a set of Cypress tests through GitHub Actions is available at https://github.com/marketplace/actions/cypress-io and basically provides a list of .YML configuration files for each of the CI servers supported by Cypress.
In the following file, we specify that any code or repository change driven by the [push] command will trigger a Cypress test run against a Chrome browser:
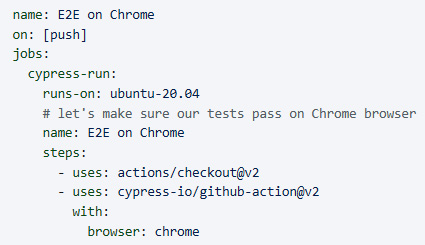
Figure 10.7 – A sample YML GitHub Actions configuration file (source – https://github.com/marketplace/actions/cypress-io)
Based on the CI server that is adopted by the development and testing team, you should select the workflow and configure the respective .YML files accordingly.
Component testing
An innovative and unique testing method is being introduced and driven by Cypress. Component testing (https://docs.cypress.io/guides/component-testing/introduction) aims to bridge the gap between unit and integration testing and offers a test engineer focused and isolated component-based testing to expedite feedback and identify core defects more effectively. This feature is still at an experimental stage at the time of writing; however, it already has great documentation and code samples for practitioners to get started with it.
The key fundamentals for testing a component within a web application is not to use the usual cy.visit() method that will navigate to a specified web page but instead utilize the mount capability, and home in on a target feature or component on the web page under test. Using the mount capability allows the test engineer to perform assertion directly on the rendered component from within the website.
The component testing structure utilizes the webpack JavaScript technology (https://webpack.js.org/concepts/) to process and "bundle" the web application into modules. On top of your existing Cypress installation, you will need to install both the webpack node module as well as the relevant web development framework that you are using for your web application development (React or Vue.js).
In the following command, we will assume that Vue.js is the framework used for web application development:
npm install --save-dev cypress @cypress/vue @cypress/webpack-dev-server webpack-dev-server
After the preceding installation, add the following block to your local cypress/plugins/index.js file:
module.exports = (on, config) => {
if (config.testingType === 'component') {
const { startDevServer } =
require('@cypress/webpack-dev-server')
// Your project's Webpack configuration
const webpackConfig =
require('../../webpack.config.js')
on('dev-server:start', (options) =>
startDevServer({ options, webpackConfig })
)
}
}
Now that the setup is ready, we can create a basic component test in a similar way, as provided by the Cypress documentation (we'll name the file Button.spec.jsx):
import { mount } from '@cypress/vue'
import Button from './Button'
it('Button', () => {
// with JSX
mount(() => <Button>Test button</Button>)
// ... or ...
mount(Button, {
slots: {
default: 'Test button',
},
})
cy.get('button').contains('Test button').click()
})
Running the tests is done by opening the Cypress GUI runner with the -ct command-line option and, from the GUI, selecting the spec file to run. In the preceding example, it would be the Button.spec.jsx file:
npx cypress open-ct
Alternatively, you can run all of your component tests from your IDE command line using the following command:
npx cypress run-ct
That's it!
Cypress Studio
Similar to component testing, Cypress Studio (https://docs.cypress.io/guides/core-concepts/cypress-studio) is under development. This capability is evolving and is aimed at providing a low-code option for frontend developers and SDETs. It comes with a recorded GUI-based test that automatically generates JavaScript test specs.
To use this feature, it needs to be enabled within the cypress.json file. Simply include the following line in that file:
{
"experimentalStudio": true
}
At the time of writing, Cypress Studio supports the .click(), .type(), .check(), .uncheck(), and .select() commands.
The Cypress community provides a preparatory project that leverages an open source web application called Real World App (https://github.com/cypress-io/cypress-realworld-app).
One of the great benefits of the studio is the ability to record directly against the web application under test without writing any lines of code. Another benefit is simply to use the studio as an entry-level point and a learning experience of the Cypress technology.
Let's take the preceding code sample from our Cypress clock demonstration and run it using the Cypress GUI runner. After clicking on the edit test step, we will then see the studio platform enabled, and we can interact with the web application under test as well as record new steps, as shown in the following screenshot:
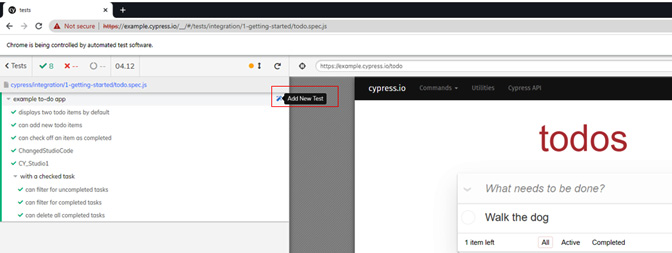
Figure 10.8 – The Cypress Studio launch button within the Cypress GUI
Upon any test launch from the GUI, users will have the ability to click on the Add New Test button, as highlighted in Figure 10.8, and start the test recording process:
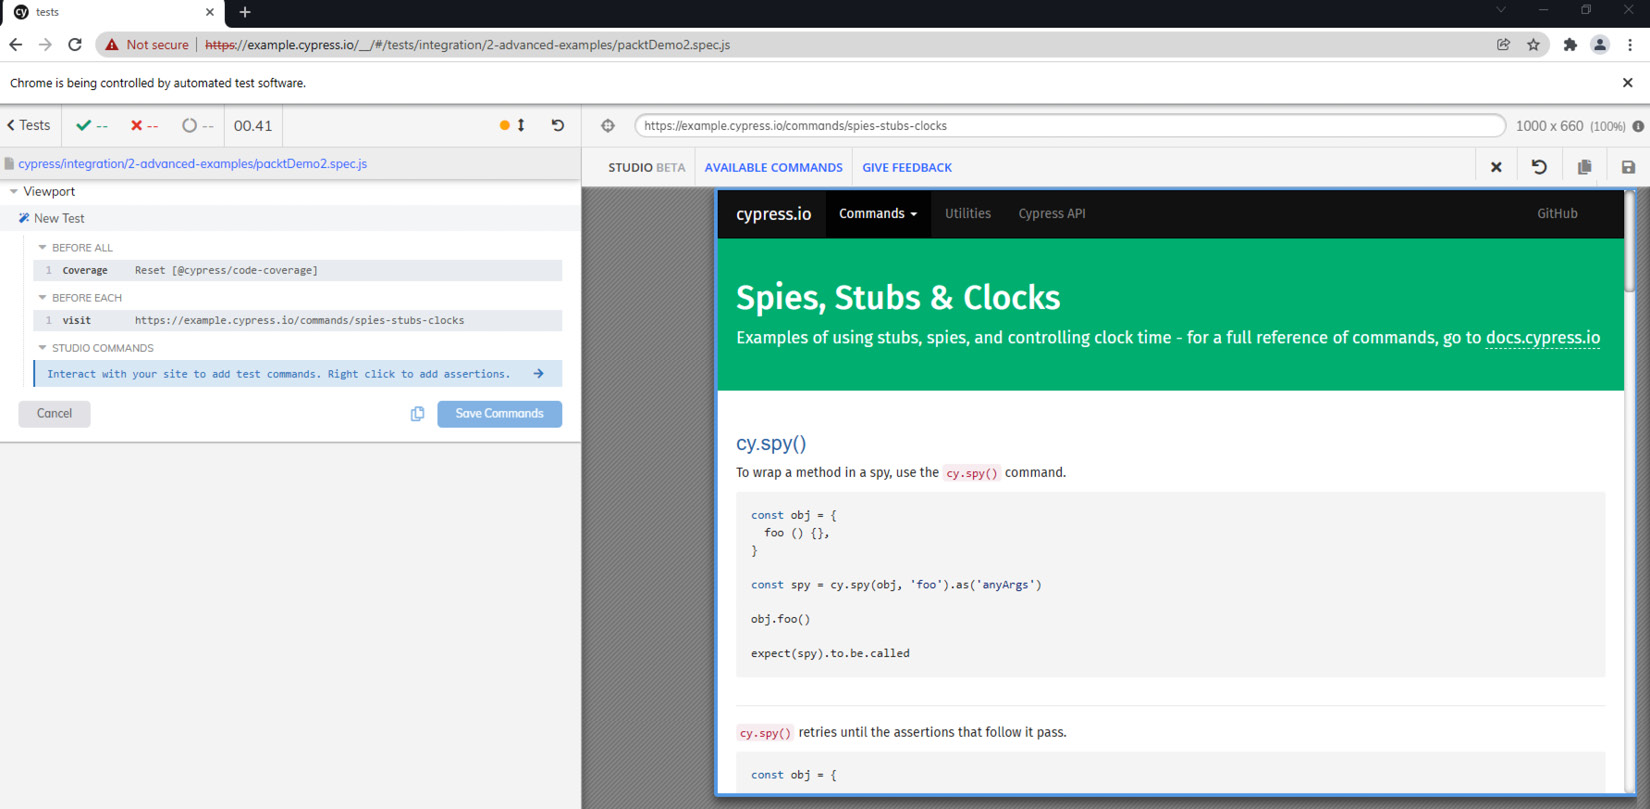
Figure 10.9 – The Cypress Studio UI in action from within an available JavaScript test spec
When I used the recorder on the preceding existing test, I was able to generate in seconds a new test scenario that was added as "studio commands," as shown in the following screenshot:
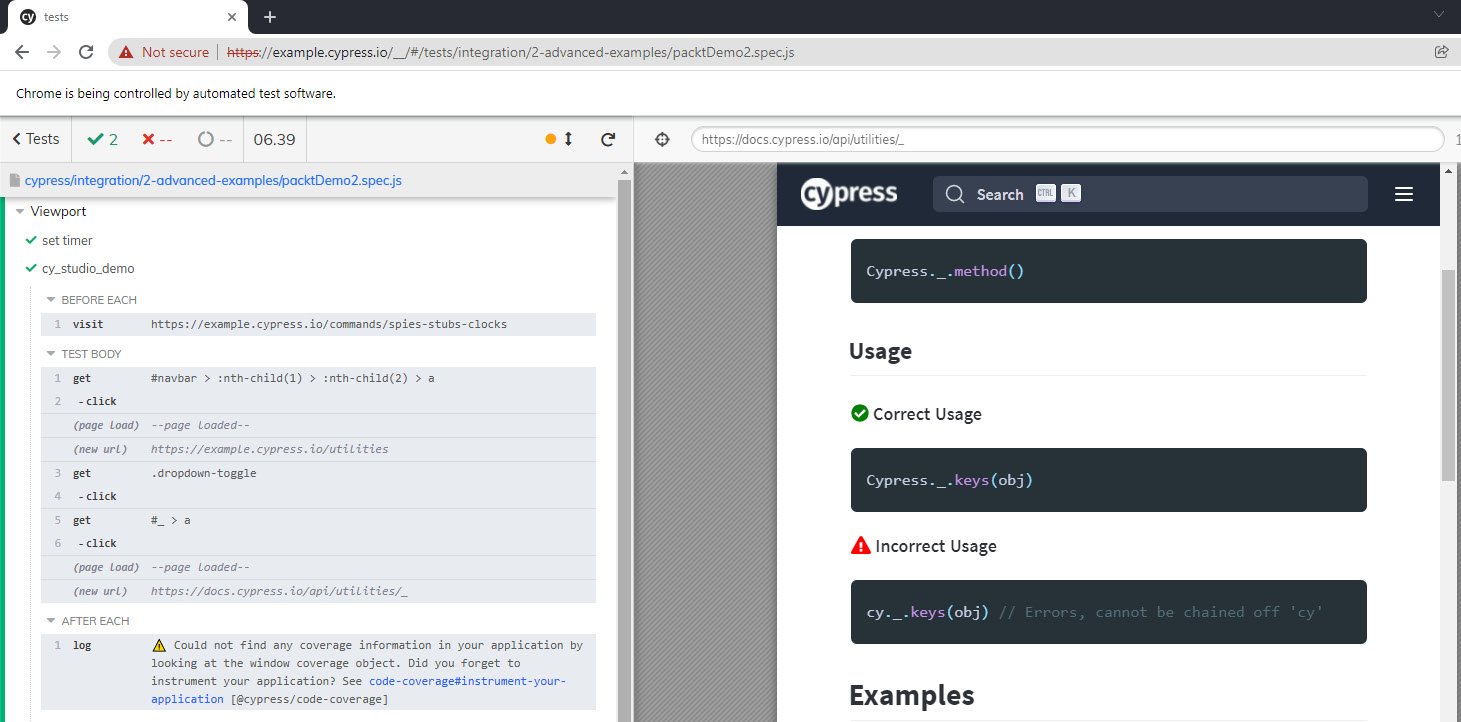
Figure 10.10 – The Cypress Studio newly generated test spec, titled cy_studio_demo
To realize what code was generated by the studio in the current test spec, here is a screenshot of the test code. You can see that the code is annotated with a message that says it was created with Cypress Studio:
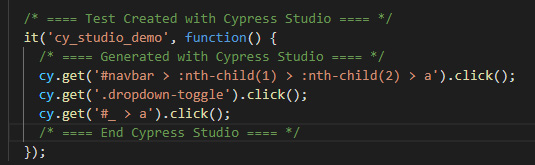
Figure 10.11 – The Cypress Studio-created code snippet example
Cypress plugins
Cypress alone is a great and powerful testing framework; however, as an open source framework, it enjoys the benefit of external contributors. Among the contributions to Cypress, there is a rich set of available plugins (https://docs.cypress.io/plugins/directory) that can extend the core capabilities of the framework towards code coverage measurements, accessibility testing using the AXE tool (https://github.com/component-driven/cypress-axe), visual testing with Applitools (https://applitools.com/tutorials/cypress.html), code analysis using ESLint (https://github.com/chinchiheather/cypress-eslint-preprocessor), webpack for component testing (as described earlier in this chapter), and so on.
A very useful plugin that is also supported by Cypress is the cucumber plugin (https://github.com/TheBrainFamily/cypress-cucumber-preprocessor). It enables you to utilize BDD for test automation. As with any other Cypress plugin, with cucumber, you will need to install the relevant node package through this command:
npm install --save-dev cypress-cucumber-preprocessor
Then, you will need to declare it in the cypress/plugins/index.js file accordingly:
const cucumber = require('cypress-cucumber preprocessor').default
module.exports = (on, config) => {
on('file:preprocessor', cucumber())
}
In addition, within the cypress.json file, you will need to specify that the test files are BDD feature files, as follows:
{
"testFiles": "**/*.feature}
Lastly, and specifically for cucumber within Cypress, you will need to add this configuration to the package.json file:
"cypress-cucumber-preprocessor": {
"nonGlobalStepDefinitions": true
}
The following is a screenshot of Cypress with a cucumber BDD test spec (a feature file) that I developed while running on a web-based designer tool called Gliffy (https://www.gliffy.com/). The entire test while using underneath the feature file JavaScript step definitions is fully built using the Gherkin syntax of Given, When, and Then:

Figure 10.12 – Cypress with the cucumber BDD test execution example
Another invaluable option within Cypress is the ability to create simple but powerful plugins. A good example is a plugin that can help switch between test environments. If you are running tests and wish to control the target environment (whether it is staging, QA, production, and so on), you can use Cypress to generate a configuration plugin that will redirect your test to the right environment. Filip Hric wrote a nice blog that explains the process (https://filiphric.com/create-a-configuration-plugin-in-cypress).
That's it!
Cypress API testing
Among all the features of Cypress, there is also a built-in capability to create and execute API testing that covers the core methods of an API – GET, PUT, POST, DELETE, and so on.
Using the cy.request() commands, you can create rich API tests and perform API assertions with Cypress in JavaScript. A nice guide that was created by one of the leading CI vendors, CircleCI (https://circleci.com/blog/api-testing-with-cypress/), showcases how to not only create an API test with Cypress but also how to run it through CI.
In addition to the preceding guide, you can take this ready-to-run JavaScript Cypress test spec and, upon creating a username and a token through the Register menu item on the open source website (https://docket-test.herokuapp.com/), run these API POST test scenarios. An alternative website to use for API testing is https://jsonplaceholder.typicode.com/.
Basically, the following code sample uses the API POST method to add a few to-do items to the free web application (https://docket-test.herokuapp.com/). It consists of two test scenarios that add a to-do item with the text Walk cat and a to-do item called Packt publishing. It validates that the response status for both requests is OK (200):
/// <reference types="cypress" />
describe("Docket Post Test", () => {
it("Should create a Todo item", () => {
cy.request({
method: "POST",
url:
"https://docket-test.herokuapp.com/api/Todo/",
headers: {
token: "[YOUR TOKEN ID",
},
body: {
Body: "Walk cat",
},
})
.its("status")
.should("be.ok");
});
});
describe("Docket Post Test 2", () => {
it("Should create a Todo item", () => {
cy.request({
method: "POST",
url:
"https://docket-test.herokuapp.com/api/Todo/",
headers: {
token: "YOUR TOKEN ID",
},
body: {
Body: "Barclays Demo",
},
})
.its("status")
.should("be.ok");
});
});
});
In this section, we explored many of the advanced capabilities of the Cypress framework, including component testing, Cypress Studio, network control, code coverage measurements, BDD, running tests within CI, the rich plugin archive, API testing, and the test retries. While these are not all the features in this massive framework but it is a great list to focus on and utilize within tour test development activities.
We will now move on to explore where Cypress might be heading in the future and some of the expected directions for this framework.
The future of the Cypress framework
While Cypress has made amazing progress in a very short amount of time in this industry, it is already looking at some transformational capabilities in the shape of the studio and component testing. For Cypress to mature even further, it will need to tick a few more boxes for the expected capabilities of a test automation framework:
- Support for all browser types and versions, including Safari's WebKit on macOS.
- Support for web applications on mobile platforms.
- Potentially expand to testing more easier multiple tabs and windows as Selenium 4 does.
- There is a rise in the adoption of languages such as Python, so more language support by Cypress could expand its usage within the community.
- Better support for modern application types such as the Progressive Web Apps (PWAs) Flutter and React Native.
In addition to the preceding, if the Cypress framework can develop its low-code studio solution with more intelligent capabilities driven by Machine Learning (ML), it will stand out compared with the Selenium IDE and Selenium framework extension called Healenium, which was covered in the previous chapter, Chapter 9, Working with the Selenium Framework.
Another great opportunity for Cypress to advance through its dashboard is reporting and test analysis. The ability to identify flaky test cases, tests that take longer than others to execute, and so on is a huge productivity boost for frontend developers and SDETs. Investing in these features and making them easier to adopt would allow this framework to stand out from the alternatives.
What is also important to find within a modern frontend web application testing framework from a capability standpoint is performance testing. As we know, all the featured test frameworks in this book do not come with built-in performance testing capabilities and are either integrating and relying on open source JMeter or are staying away from such types of tests. As this framework matures, this type of non-functional testing should be given equal consideration within this framework.
The way that Cypress has partnered with cloud vendors and supported the development of SDKs to scale up and run Cypress tests in the cloud was a great initiative, which many large enterprise organizations adopted. It would be very beneficial to deepen these partnerships and see how cloud solutions can contribute to the Cypress ecosystem with features such as reporting and scale. Currently, Cypress works well with a set of reporters that includes JUnit and TeamCity (https://docs.cypress.io/guides/tooling/reporters); however, when expanding partnerships with other technology vendors, Cypress can benefit from a much more meaningful reporting solution.
Finally, investing in more security testing of web applications in the age of cyberattacks and denials of service would be a huge advantage for Cypress. Currently, Cypress users can work with Auth0 authentication features (https://docs.cypress.io/guides/testing-strategies/auth0-authentication#Auth0-Application-Setup) and other authentication solution providers such as Okta, Google, GraphQL, and Amazon; however, this is only one aspect of security, which isn't sufficient.
With these suggestions and opportunities for enhancements, we will conclude this section and provide a summary for this chapter.
Summary
In this chapter, we covered the fundamentals of the Cypress framework and learned how to get started, and run a JavaScript Cypress test in both IDE mode and from the GUI runner. We then dived deeper into the most advanced features of the Cypress framework and provided code samples, references, and insights on how to use them and for what benefits. Among the core features that we touched upon were the network control capabilities, running from CI, Cypress Studio, component testing, and API testing. We then tried to project the future of Cypress through capabilities that are currently experimental as well as the missing and greatly needed features for this framework.
The two main code examples from this chapter that show the use of the clock and the API test are in the following GitHub repository, forked from the Cypress master repository: https://github.com/PacktPublishing/A-Frontend-Web-Developer-s-Guide-to-Testing/tree/master/Cypress_examples.
That concludes this chapter! In the following chapter, we will perform the exact same analysis we did for Cypress for the Playwright test automation framework.