Industry Organization and Competition
The oil and gas industry is composed of three main categories of participants: internationally owned oil companies (IOCs), national oil companies (NOCs) that operate as corporate entities, and government-sponsored oil enterprises (GSEs) that operate as government agencies. Often, we find these groups forming strategic alliances to facilitate their mutual objectives. In addition, there may be several groups involved, such as the governments of individual countries, service companies, and independent oil companies. The largest investor-owned companies are ExxonMobil, Royal Dutch Shell, British Petroleum (BP), Total, and Chevron, more commonly known as the Big Five. Out of the top 20 oil/gas producers, 14 are NOCs. Government-sponsored enterprises often enjoy access to areas that may be denied to outside companies. Individual countries can limit access and impose production targets. Service companies saw significant growth during the oil boom from 2005 to 2008. The current shale gas boom has been profitable for many small independents.
3.1 Internationally owned oil companies
3.2 National oil companies
3.3 Alliances
3.4 Government-sponsored enterprises
3.5 Government policies of individual countries
3.6 Service companies
3.7 Independents
3.1 Internationally Owned Oil Companies (IOCs)
IOCs are entirely investor-owned and primarily seek to increase shareholder value and make investment decisions based on economic factors. These companies typically move quickly in development and production of the identified reserves and sell their output in the global market. Although these business corporations are affected by the laws of the countries in which they produce oil, all decisions are ultimately made in the interest of maximizing profit for their diversified shareholders, not for a government.
IOC shares are actively traded and they publish annual reports while abiding by the rules put forth by the Securities and Exchange Commission (SEC) and other bodies.
The distinction between IOCs and NOCs is not always clear because, over time, some NOCs such as British Petroleum (BP), Total, and Eni S.p.A. have been privatized to some degree. There are firms such as Statoil and Petrobras that, although partially privatized, still seem to operate in a manner that reflects the interests of their national governments. The largest three U.S.-based international oil companies (ExxonMobil, Chevron, and ConocoPhillips) are accountable to their shareholders, not the U.S. government.
The IOCs have competitive advantages in project- and risk-management capabilities and techniques, and in access to technology, capital, and downstream markets. IOCs have a strong potential to define markets for new products, whereas other entities do not. For example, it was the IOCs that developed the blended crude specifications for the oil going to the Mediterranean refineries from Kazakhstan and Russia.
But how did the IOCs gain global power? John D. Rockefeller in 1870 formed the largest oil conglomerate of the time and named it Standard Oil. In 1890, antitrust legislation was established, resulting in the breakup of Standard Oil in 1911, eventually resulting in the formation of four of the Seven Sisters: Exxon, Mobil, Chevron, and Texaco.
A nationalistic push in the Middle East to control more of the hydrocarbon production, distribution, and price resulted in the formation of the Organization of Petroleum Exporting Companies (OPEC) on September 14, 1960. OPEC was designed to fight price cuts by Standard Oil of New Jersey, later renamed as Exxon, and to diminish the increasing power of the seven sisters. OPEC along with many others, considered the seven sisters to be the world’s most powerful oil cartel at that time. OPEC is discussed in more detail in Chapter 4. Some of the countries during that same time that had a significant amount of production by foreign IOCs included Saudi Arabia, Iran, Iraq, Kuwait, Qatar, United Arab Emirates, Nigeria, Libya, Algeria, Angola, Venezuela, Ecuador, Mexico, Philippines, and Indonesia.
Throughout the recent history of the IOCs, mergers have resulted in fewer but much larger oil conglomerates. Starting in the mid-1980s, the industry structure was evolving in the direction of consolidations and mergers of companies. For example, in 1984, Chevron acquired Gulf and Mobil Oil acquired Superior Oil. During the period from 1987 to 1998, BP, Sohio, and Amoco were merged into one entity. In response to the Asian financial crisis and increased supply primarily from the Soviet Union, Ashland and Marathon merged in 1997. BP Amoco acquired the Atlantic Richfield Company (ARCO) in 1999 and Chevron merged with Texaco in 2001. Overseas, Total acquired Petrofina and Elf Aquitaine in 1999 through 2000. The Spanish company Repsol acquired the Argentinian oil company YPF in 1998. The following year, Exxon merged with Mobil Oil. The original seven sisters were decreased to only four sisters to include ExxonMobil, Chevron, BP, and Royal Dutch Shell. Other consolidations included BP acquiring the refineries and distribution system of ARCO, Chevron acquiring Unocal, and Shell acquiring Pennzoil. In 2002, ConocoPhillips was formed through the consolidation of Conoco, Phillips, and Tosco with the Alaskan resources of ARCO. Recently, as a result of the downturn in the market, some of the bigger players are acquiring smaller companies that suffer more with a slow economic state. For example, Shell acquired BG Group PLC in February 2016. Marathon Oil Corp, bought PayRock Energy Holdings in 2016 as well in an effort to boost its assets. In 2015, there were $323 billion in announced or proposed oil and gas mergers.
Exhibit 3.1 lists some of the larger non-OPEC IOCs. IOCs are only accountable to their shareholders, not the government, but they still must abide by the applicable regulations including those of an environmental nature within the country they are operating.
Exhibit 3.1 Large upstream non-OPEC companies
|
Company name |
Home country |
Ticker (NYSE) |
|
ExxonMobil |
U.S. |
XOM |
|
BP |
UK |
BP |
|
Lukoil |
Russia |
LUKO.PK |
|
Royal Dutch Shell |
UK and Netherlands |
RDS-A |
|
Total |
France |
TOT |
|
TNK-BP |
Russia |
|
|
Chevron |
U.S. |
CVX |
|
Surgutneftegaz |
Russia |
|
|
ConocoPhillips |
U.S. |
COP |
|
Tatneft |
Russia |
|
|
Repsol-YPF |
Spain |
REP |
|
Occidental |
U.S. |
OXY |
|
Gazprom |
Russia |
|
|
Petro-Canada |
Canada |
|
|
Hess Corporation |
U.S. |
HES |
|
Suncor Energy |
Canada |
SU |
|
Devon Energy Corporation |
U.S. |
DVN |
|
Apache Corporation |
U.S. |
APA |
|
Bashneft |
Russia |
|
|
Anadarko Petroleum |
U.S. |
APC |
|
Marathon Petroleum Corporation |
U.S. |
MRO |
|
BHP Billiton |
Australia |
BBL |
|
EnCana Corporation |
Canada |
ECA |
Abbreviations: BP, British Petroleum; UK, United Kingdom; U.S., United States of America.
3.2 National Oil Companies (NOCs)
The NOCs are a hard group to define and in fact some companies, such as Statoil, have shifted between the NOC and IOC definitions over time. NOCs have close relationships with the government of the country in which they are based, but that relationship can range from complete alignment with the government to an arm’s-length relationship that is minimally impacted by any change in the ruling party. NOCs can be further defined as oil companies predominantly owned or controlled or both by a single national government. The government role can range from 100% state control to more of a stakeholder role, in which a minority “golden share” is retained by the government. This share usually has associated approval/veto powers. Both Eni and Petrobras are examples of the latter relationship.
The Arab oil embargo in 1973 awakened oil-consuming nations to have better control over their energy supplies, and hence many NOCs were created. These first NOCs included British National Oil Company (BNOC), Japanese National Oil Company (JNOC), Petro-Canada (Canadian ownership), and StatOil (Norwegian ownership). But as the industry continued to evolve, JNOC was disbanded and Petro-Canada was privatized.
As described in earlier chapters, a majority of the largest oil companies are state-owned NOCs, not IOCs. Outside oil companies have limited or no access to most of the world’s proven oil reserves as evidenced by the fact that it is NOCs that control the majority of proven reserves (90% in 2011) and current production (75% in 2011).1
NOCs operate as an extension of a government or a government agency. NOCs have exclusive rights to explore and develop petroleum resources within the home country. They decide on the degree to which they require participation by private companies.
It is important to note that NOCs do not typically operate on the basis of market principles. Their objectives might include creation of jobs, economic growth, and energy security. NOCs can also be a conduit for the government to achieve its foreign policy goals, often through IOC–NOC or NOC–NOC alliances. They can add to the overall economic development through technology transfers into other industry sectors and through fuel subsidies to targeted industries. A number of auxiliary businesses are often associated with NOCs, including electric power generation, chemicals, minerals, and all manner of infrastructure. Some interests are in nonenergy retail and commercial assets. These objectives may be critical to the national government but may not allow for maximization of shareholder value. To understand the motivations of NOCs, one must therefore look beyond the oil fields and refineries.
In terms of energy security goals, NOCs often think beyond security of supply to also include security of demand, which means avoiding having one consumer becoming of critical importance and influence to the NOC.
NOCs may use similar investment-funding mechanisms to those used by the IOCs. These include, but are not limited to, equity and debt securities in public capital markets. For example, several NOCs in the Middle East have established retained earning funds to tap into when their oil revenues may be running low. NOCs may also follow the model where they remit all net proceeds to their governments. This approach necessitates that the NOC compete for government funds on an ongoing basis. This model makes it difficult at best to sustain and achieve long-term development objectives.
Many NOCs follow the vertical integration model for the same reasons IOCs do. There is added value in producing and selling petroleum products in addition to the core products of oil and gas. The diversification leads to lower levels of risk, and vertical integration supports a greater degree of diversification.
According to Bloomberg,2 PetroChina (PTR) still ranks first in market capitalization when compared to some of the other large NOCs (Exhibit 3.2). Many NOCs are not publically traded and thus cannot be easily valued.
Exhibit 3.2 NOC market capitalization 2013
|
Company |
Country |
Market cap (billions USD/2013) |
|
Petrobras (PBR) |
Brazil |
79.9 |
|
StatOil (STO) |
Norway |
65.14 |
|
Ecopetrol (EC) |
Columbia |
86.11 |
|
PetroChina (PTR) |
China |
216.16 |
|
CNOOC Ltd (CEO) |
China |
74.3 |
Abbreviations: CNOOC, China National Offshore Oil Corporation; USD, U.S. dollars.
In NOCs, measures of profitability are not so accurate because there may be hidden subsidies—perhaps in the form of access to the oil/gas or government-sponsored marketing. Many NOCs are considered to be inefficient organizations with relatively low investment rates. There often is more of an exploitation mentality in an attempt to create short-term gains for the economy or for the rulers of the nation or both. Some argue that inefficient operations of the NOCs can be a destabilizing factor in the world oil market. The objectives of NOCs may not include using global best practices in managing production, exploration, and development. There is particular concern with the best practices of transparency and accountability.
In some cases, as with Norway’s StatOil, transparency and accountability are very high. The performance metrics of StatOil are accurately reported and audited, but perhaps the most visible metric is the substantial growth in its autonomous surplus fund. It has grown to $557 billion in 2010 from its inception in 1990 and is completely disclosed in their annual reporting. It has not become a secret fund of the Norwegian government. Likewise Ecopetrol’s transparency and accountability were required to achieve its recent listing on the New York Stock Exchange in 2008. Its increasing reserves and production numbers have been openly disclosed to its investors.
On the other hand, NOCs in the OPEC countries may not have the same rigorous level of transparency and accountability, especially to the outside world. But as evidenced by their profit margins and energy diversification programs, other best management practices are in place. The annual OPEC World Oil Outlook Report3 is a very thorough and well-organized statistical report that is openly shared with the outside world via the web.
Chinese NOCs struggle with transparency and accountability. However, as PTR continues to expand operations globally, companies and governments need to take into account the difference in the standards of reporting and subsequent auditing that may be at play. PTR by far is a significant player in the global oil industry as evidenced by their market cap of $216 billion dollars (Exhibit 3.2). In China, there was a move from total government ownership of the energy companies to more of a mixed model with public and government ownership. This resulted in the formation of China National Offshore Oil Corporation (CNOOC), Sinopec (SNP), and PTR.
In many OPEC countries, oil revenues are often considered the personal property of the inner circle of power players surrounding the government ruler. Transparency and accountability remain very low with the NOCs in these countries. However, the IOCs operating in these nations provide full disclosure reporting to their shareholders, which can often shed a more accurate light on the NOC reserves.
In recent years, the governments of Mexico, Kazakhstan, and Russia have been opening up their oil industry to private investment. To do that successfully requires a high level of both transparency and accountability. Additionally, some of the newly formed smaller oil companies consolidated into Lukoil, Tatneft, and Surgutneftegaz. The Russian Federation started Rosneft, which became open to outside stock ownership in 2000.
In the Mexican oil company Pemex, management practices are still developing into best practices. When the former Union of Soviet Socialist Republics (USSR) restructured in 1989, the Soviet government formed Gazprom, which allowed private stock ownership. There has been a trend of new IPOS in the Middle East in response to prolonged low oil prices. Saudi Arabia, Abu Dhabi, and Oman have plans to launch IPOS in association with their state-owned energy companies in an attempt to boost profitability and gain access to new markets.
Not all of the NOCs are 100% owned by the national governments. Some of the main NOCs are listed as follows, with only those ownerships that are less than 100% indicated.
- ADNOC: United Arab Emirates
- CNOOC 71%: China
- INOC: Iraq
- KPC: Kuwait
- NOC: Libya
- Sonangol: Angola
- NIOC: Iran
- NNPC: Nigeria
- ONGC 71.4%: India
- PDVSA: Venezuela
- Pemex: Mexico
- Pertamina: Indonesia
- PetroChina 90%: China
- Petronas: Malaysia
- QP: Qatar
- Rosneft 75.16%: Russia
- Saudi Aramco: Saudi Arabia
- Sonatrach: Algeria
- Statoil 70.9%: Norway
By purchasing Aramco, the Saudi government finalized the complete break between the interests of OPEC and that of the major oil companies.
In South America, Petrobras acquired the Argentinian company Perez Compania Energia in 2003. A year later, OMV acquired Petrom SA. In early 2012, the Argentine government seized a majority stake in YPF, the nation’s largest oil company, thereby nationalizing their oil industry.
The Norwegian government decided to support the consolidation of its two North Sea operators Statoil with Norsk-Hydro in 2007.
More than half of the world’s top energy firms, 28 out of 50, are fully state-owned. The largest non-OPEC-integrated NOCs are in Mexico, Brazil, Russia, China, Malaysia, Norway, India, and Indonesia.
Recognition of the NOCs’ growing investment beyond their national borders is viewed by some as an energy security issue. China National Petroleum Company (CNPC) announced that it had begun operations in Iraq’s Al Ahdab oil field. The project marks “the realization of the Chinese oil industry’s goal to develop the high end oil market in the Middle East,” CNPC said.4 “NOCs... are increasingly active in cross-border partnerships or other strategic deals,” said UBS bank analyst Philip Wolfe.5 Boris Zilbermints, a senior executive at Russian energy giant Gazprom said his company sees itself as an “international NOC.”6
3.3 Alliances
The principal disadvantage of an alliance for many NOCs and governments is that alliances may confer equity interests to a foreign entity. The advantages for the NOC or government are immense, however. It’s quite common for an IOC to get an exploration license, take all of the exploration risk, and then be required to allow an NOC to acquire a large stake if exploration succeeds.
The greatest challenge in an IOC–NOC alliance is how to effectively exercise the NOC privileges into the terms of the joint venture. An IOC might enter into a venture with an NOC to gain access in an NOC-favored location or an NOC may enter an alliance with an IOC to gain access to a process or technology with which the IOC has significant experience. The NOC might be the majority partner and be legally and contractually vested with formal controls but lack the in-country experience and internal capability and resources to exercise those rights in practice. The key reason for an IOC–NOC alliance is to maximize profitability; to a lesser extent, it may be to strengthen strategic political relationships.
IOC–NOC alliances obviously expose the national resources to outside entities. The trade-off is often a competitive return on revenue (ROR) versus access to expertise and best practices. Additionally, there could be a reduction of political risk faced by the IOC, at least while both sides’ interests remain aligned. Some examples of IOC–NOC alliances include:
- BP and Statoil created (and then dissolved 10 years later) a joint venture for international exploration and production activities.
- Texaco set up downstream U.S. joint ventures with Saudi Aramco, first the Star Enterprise venture and then (along with Shell) the Motiva venture.
- Abu Dhabi National Oil Company (ADNOC) entered into an agreement with Occidental Petroleum whereby ADNOC will hold a 60% interest and Occidental will hold a 40% interest in a 30-year deal to develop reservoirs in the Shah Field, southwest of Abu Dhabi city.7
- Eni and PTR entered into a memorandum of understanding to develop unconventional resources (such as shale gas) in China and Mozambique.8
- Sinopec agreed with Australia Pacific (AP) LNG to purchase a 15% stake in the AP LNG project from ConocoPhillips and Origin Energy Limited.
An additional category of alliance includes the NOC–NOC arrangement. Some examples of this type of alliance include:
- CNPC and Cuba’s NOC, Cupet, signed an agreement to allow Cupet to leverage CNPC’s technological capabilities and increase output while decreasing operational costs.
- Petroleos de Venezuela (PDVSA) and Ecuador’s NOC, Petroecuador entered into oil and gas cooperation deals to develop blocks in Ecuador and explore blocks in Venezuela.
- ADNOC and the Korea National Oil Corporation (KNOC) created a joint venture for the exploration and development of three blocks with estimated reserves of 340 to 570 million barrels of oil in Abu Dhabi.
- Korea Gas Corporation (KOGAS) and Uzbekneftegaz formed an alliance to build a network of compressed natural gas stations in Uzbekistan.
3.4 Government-Sponsored Enterprises
GSEs are government-sponsored enterprises that some argue began proliferating in response to the 1998 rise in oil prices. A GSE has a government majority owner but allows private investors to participate. An example of this structure is PTR. Likewise PetroCanada replaced previous government ownership with a blend of government and private ownership. For the first time, a state-controlled Russian oil company, Rosneft, has acquired ownership in private U.S. oil and gas assets via a deal with ExxonMobil in 2012 and agreed in early 2013 to broaden their joint venture by adding seven more licenses to develop oil and gas resources on Russia’s Arctic shelf.9 Similar to IOCs, these organizations also actively seek investment funds and are based on a structure that allows them to access the major capital markets. In other words, profitability is a key driver.
GSEs are particularly important for countries transitioning to a market-based economy. Because GSEs also serve the national interest, they have a broader agenda than just profitability, which can be an asset or a liability. One of the main goals is to secure reliable hydrocarbon resources within their boundaries to better secure their economic future. Exhibit 3.3 provides a list of the some of the larger global GSEs.
Exhibit 3.3 GSEs
|
Company |
Country |
Government ownership (%) |
|
CNOOC |
China |
71.0 |
|
Eni |
Italy |
30.3 |
|
PetroChina |
China |
90.0 |
|
Statoil-Hydro (formerly Statoil) |
Norway |
70.9 |
|
Petrobras |
Brazil |
64.0 |
|
Gazprom |
Russia |
50.0 |
|
PTT |
Thailand |
51.0 |
|
Rosneft |
Russia |
75.16 |
|
ONGC |
India |
71.4 |
Abbreviations: CNOOC, China National Offshore Oil Corporation; ONGC, Oil and Natural Gas Corporation.
In most of these GSEs, governments are the majority owners. Over time, these relationships may vary depending on politics and the price of oil.
In fact, in some cases, GSEs may transform into IOCs if markets and economics drastically change. These transformations are not without huge political consequences.
3.5 Government Policies of Individual Countries
When we consider the organizational structure of the oil industry and the key players, we also need to address the fact that individual countries and their associated governments are also major players in the world oil market.
In addition to influencing the operation of NOCs, governments can also dictate the terms by which outside oil companies must abide in their country. Access to a country’s reserves may fall into four categories (Exhibit 3.4):
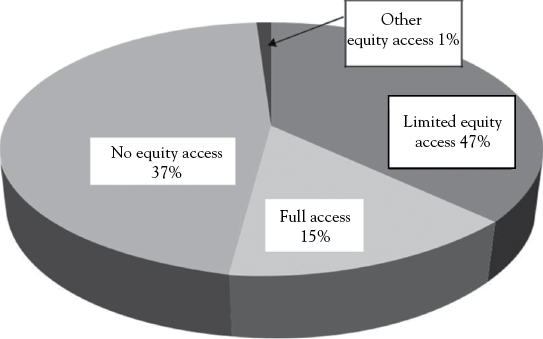
Exhibit 3.4 Access categories
- Equity access (1% of world reserves): NOC exists, but does not get preferential treatment over outside oil companies. Examples include Colombia, Indonesia, and Denmark.
- Full access (15% of world reserves): All companies must abide by the laws of the government, but no domestic company is given preferential treatment. Examples include United States, United Kingdom, and Canada.
- Limited equity access (37% of world reserves): The NOC is given priority access to reserves, whereas outside oil companies’ access may be limited through minimum domestic ownership requirements, shared production with the NOC, or other methods. Examples include China, Angola, and Russia.
- No equity access (47% of world reserves): The NOC has sole access to reserves. No foreign ownership of oil fields is permitted in these countries, and any outside participation is limited to operations through a domestic affiliate. Examples include Iran, Iraq, and Saudi Arabia.
Governments of oil-rich countries directly affect world oil supplies by limiting access and imposing production targets. Limited access to oil can force companies to form strategic alliances with NOCs as discussed in Section 3.3.
When developing nations are faced with their initial oil/gas discoveries, many are not equipped to handle the outcomes in a socially responsible manner. For example, current concerns are focused on how the governments of Uganda and Zanzibar will manage the development of their recent hydrocarbon discoveries.
3.6 Service Companies
The IOCs have competitive advantages in project and risk management, access to technology, capital, and downstream markets. They can absorb and transfer risk to a greater degree better than many other market players. These capabilities are what they have historically offered to NOCs and host governments on a contractual basis. But some of the other industry players who can provide many of the same services include oilfield service companies, project management companies, and oil companies operating exclusively in the downstream sector. Service companies also include accounting and information management firms, financial institutions, and law firms. These entities are in direct competition with IOCs to work with the NOCs.
The number of service companies started rapidly increasing between 2005 and 2008 as the number of IOCs started decreasing. Exhibit 3.5 provides a list of some of the larger upstream service/support companies. Exhibit 3.6 lists service companies in the midstream sector focused on transportation, and finally Exhibit 3.7 lists some of the downstream service providers focused on equipment and refining.
Exhibit 3.5 Upstream service/support companies
|
Company |
Ticker (NYSE) |
Specialization |
|
Schlumberger Ltd. |
SLB |
Oil Services |
|
CGG Veritas |
CGV |
Oil Services |
|
Petroleum Geo-Services (PGS) |
PGEJF |
Oil Services |
|
Diamond Offshore Drilling, Inc. |
DO |
Drilling |
|
Nabors Industries, Inc. |
NBR |
Drilling, equipment, and services |
|
Noble Corp. |
NE |
Drilling, equipment, and services |
|
Transocean Inc. |
RIG |
Drilling |
|
ENSCO Intl |
ESV |
Drilling |
|
Rowan |
RDC |
Drilling |
|
TODCO |
THE |
Drilling |
|
Baker Hughes, Inc. |
BHI |
Drilling |
|
Halliburton Company |
HAL |
Oil equipment and services |
|
National Oilwell Varco, Inc. |
NOV |
Oil equipment and services |
|
Weatherford Intt’l, Inc. |
WFT |
Oil equipment and services |
|
Cooper Cameron Corp. |
CAM |
Oil equipment and services |
|
Keppel Corp (Singapore) |
— |
Rig builder |
|
SembCorp (Singapore) |
— |
Rig builder |
|
Daewoo Shipbuilding (Korea) |
— |
Rig builder |
|
Samsung Heavy Industries (Korea) |
— |
Rig builder |
Exhibit 3.6 Midstream service/support companies in transportation
|
Company |
Ticker (NYSE) |
Specialization |
|
Teekay Shipping Corp. |
TK |
Ship tankers |
|
Frontline Ltd. (USA) |
FRO |
Ship tankers |
|
Overseas Shipholding Group |
OSG |
Ship tankers |
|
A/S Steamship Company Torm |
TRMD |
Ship tankers |
|
General Maritime Corp. |
GMR |
Ship tankers |
|
Ship Finance International Ltd. |
SFL |
Ship tankers |
|
Seacor Holdings Inc. |
CKH |
Ship tankers |
|
Kirby Corp. |
KEX |
Ship tankers |
|
Colonial Pipeline Company |
n/a-private |
Pipelines |
|
Enbridge Inc. |
ENB |
Pipelines |
|
Kinder Morgan Energy Partners LP |
KMP |
Pipelines |
|
Plains All American Pipeline LP |
PAA |
Pipelines |
|
Buckeye Partners LP |
BPL |
Pipelines |
Exhibit 3.7 Downstream service/support companies in equipment and refining
|
Company |
Specialization |
|
Hanover Company |
Oilfield equipment |
|
Varco International |
Oilfield equipment |
|
Tuboscope Inc. |
Oilfield equipment |
|
Carbo Ceramics |
Oilfield equipment |
|
Maverick Tube Corp. |
Oilfield equipment |
|
Friede & Goldman |
Oilfield equipment |
|
TETRA Technologies |
Oilfield equipment |
|
Refining Process Services Inc. |
Refining |
|
Intertek |
Refining |
Service companies play a key role in the oil and gas industry, especially as the industry continues to require very specialized services that IOCs and NOCs do not have the time and energy to develop within their own frameworks. A niche service company with a strong research department can provide several client companies with high-quality services at a lower cost than if the companies developed the same research outcomes on their own. It is often much less expensive for a large corporation to purchase the required technology from a service company, rather than developing the technology from scratch by themselves. As with oil companies, service companies also try to make changes in times of economic stress. Larger service companies acquire rival pipeline operators and oil field service companies where it is strategically merited.
3.7 Independents
The basic definition of an independent oil and gas company is a nonintegrated company that receives nearly all of its revenues from production at the wellhead. This group of companies only participates in the exploration and production of crude oil and natural gas. Independents are usually more willing to take on risk with the hope of a higher rate of return. Often independents acquire properties that the larger IOCs and NOCs have walked away from. These companies are usually quite small, typically ranging in size from 25 to 1,000 employees. Within the United States, the tax definition for an independent downstream company published by the Internal Revenue Service (IRS) states that a firm is an Independent if its refining capacity is less than 50,000 barrels per day on any given day or their retail sales are less than $5 million for the year10.
The Independent Petroleum Association of America11 has over 8,000 independent oil and gas company members. A sample list of some independent oil and gas companies is given in Exhibit 3.8.
Exhibit 3.8 Independent exploration and production companies
|
Company |
Country |
|
Apache |
U.S. |
|
Anadarko |
U.S. |
|
Canadian Natural |
Canada |
|
Murphy |
U.S. |
|
Talisman |
Canada |
|
Nexen |
Canadian |
|
EOG Resources |
U.S. |
|
Woodside |
Australia |
|
EnCana |
Canada |
|
Pioneer Natural Resources |
U.S. |
Abbreviation: U.S., United States.