There may be no other industry in the world that requires a more diverse set of competencies and skills: human, political, technical, mechanical, and financial. This is an industry that is intimately entangled with national strategies and global power. This chapter will provide an overview of the evolution of hydrocarbon demands and the industry that has subsequently developed to cope with those demands.
1.1 Early History
1.2 Seven Sisters
1.3 The Basics
1.1 Early History
This is an industry with a long and complex history, starting as far back as 4000 BC people used oil obtained from ground seeps to waterproof boats and to act as an adhesive in the construction of buildings. We know that crude oil was refined in minor quantities for lamp and heating oil in China around 1000 BC and in 600 AD, the Byzantines used crude oil to produce flame weapons. In North America, Seneca Indians used oil as a medicine for skin ailments.
From the 16th century through the 19th century, whales provided the primary source of oil. Whale oil was used principally as lamp fuel and in the production of soap. But as the scarcity of whales became a reality, the modern hydrocarbon energy was born. Samuel Kier is credited with being the first person in the United States to refine crude oil into lamp oil or kerosene, as a replacement for whale oil around 1861. Pennsylvania Rock Company, later called Seneca Oil, completed their first successful drilling for oil in 1855 at Oil Creek, Pennsylvania in the United States. International drilling operations were also becoming active in areas such as Bóbrka, Poland in 1854; Wietze, Germany in 1857; and Oil Springs, Ontario, Canada in 1858. This was the era when crude oil became affectionately known as “black gold” for obvious reasons.
This new industry in the United States was consolidated and monopolized by John D. Rockefeller. He formed the Standard Oil Company in 1870, and by 1890, his company had 90% of the U.S. oil market. In response to concern over this monopolistic position, the Sherman Antitrust Act (1890)1 was used in 1911 to split Standard Oil into 34 competing firms. This included the formation of Exxon, Chevron, Texaco, Mobil, Amoco, and Conoco.
While the antitrust movement was percolating, the first large U.S. oilfield was discovered by Gulf Oil in 1901 at Spindletop, Texas, producing over 50,000 barrels per day (Exhibit 1.1). It contributed 20% of the daily U.S. production at the time and led to a collapse in the price of oil.
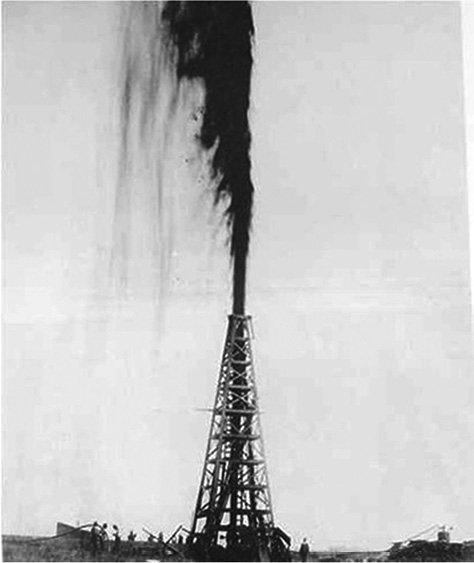
Exhibit 1.1 Lucas Gusher at Spindletop Hill, 1901
Source: John Trost, Wikimedia Commons.
But outside the United States, other fields of this same magnitude were also being developed in countries such as Indonesia (1890s) and Persia (1908). In Azerbaijan in 1890s, the Nobel Brothers, John D. Rockefeller, and the Rothchilds fought for world oil dominance.
The history of crude oil started with lamp oil, but it was soon followed by its use as transportation fuel. Some of the market developments that pushed the expansion of this industry included the Wright Flyer’s need for fuel in 1903 and the Model T’s need for fuel in 1908. World War I certainly created market demand for oil as a fuel source for military ships. The advent of the centrifugal gas turbine for jet propulsion in 1930 also added market demand.
Petroleum gas oil was one of the early generic names given to automotive engine fuels by scientists. Everyday use meant the name quickly got shortened; in Europe, the British and Irish adopted the petroleum part of “petroleum gas-oil,” which later was shortened to just petrol, whereas in Canada and the United States, they adopted the gas oil part, initially naming the fuel gasoline because of its tendency to vaporize and easily become a gas.
1.2 Seven Sisters
In 1960, the Organization of Petroleum Exporting Countries (OPEC)2 was formed in Baghdad and was based in Vienna. The original members included Iraq, Kuwait, Iran, Saudi Arabia, and Venezuela. Later they were joined by nine more governments: Libya, United Arab Emirates, Qatar, Indonesia, Algeria, Nigeria, Ecuador, Angola, and Gabon. Declining U.S. oil production and the rise of OPEC had a major impact on the U.S. industry.
Smaller fields with lower costs gave advantage to independents, ending many of the advantages of market concentration. The top seven oil companies (the Seven Sisters) subsequently started to reorganize. These oil companies included Standard Oil of New Jersey, Standard Oil of California, Standard Oil of New York, Royal Dutch Shell, Anglo Persian Oil Company, Gulf Oil, and Texas Company. Some of the key mergers/acquisitions among the Seven Sisters are provided in Exhibit 1.2.
Exhibit 1.2 Major reorganization of the Seven Sisters
|
Original entity |
Became |
Plus |
Plus |
Plus |
Resulting entity |
|
1. Standard Oil of New Jersey |
Esso/Exxon |
Mobil |
ExxonMobil |
||
|
2. Standard Oil of California |
Texas Company |
Gulf Oil |
Texaco |
Chevron |
|
|
3. Standard Oil of New York |
Mobil |
ExxonMobil |
|||
|
4. Royal Dutch Shell |
Royal Dutch Shell |
||||
|
5. Anglo Persian Oil Company |
Standard Oil of Indiana (Amoco) |
BP |
|||
|
6. Gulf Oil |
Chevron |
||||
|
7. Texas Co |
Texaco |
Chevron |
Abbreviation: BP: British Petroleum.
In 2010, the top three international oil companies by share of world production were ExxonMobil (3%), British Petroleum (3%), Royal Dutch Shell (2%), and Chevron (2%).3 The remnants of the Seven Sisters obviously still play an influential role in the current oil industry.
1.3 The Basics
Why Is Petroleum So Important?
Why has “black gold” been so important to us? To start with, it is recognized as the major facilitator of international trade. One could argue that energy is pervasive through the whole economy and is the main building block of economic growth. Because of this role as a major facilitator of international trade and economic growth, petroleum has contributed to human mobility around the world.
It is flexible and can be moved in both small and large quantities. Although crude oil has little direct value, and it must be refined into petroleum products, it still remains the easiest of energy commodities to produce and subsequently use. It converts easily to gasoline for powering engines of all sorts and releases a large amount of energy when combined with oxygen (combustion). It has the greatest energy density of all fossil fuels.
Hydrocarbons
Crude oil and natural gas are referred to as hydrocarbons because they are mixtures of molecules formed by carbon and hydrogen atoms. The term petroleum really includes only crude oil but can include both crude oil and natural gas in some contexts. The difference between crude oil and natural gas is the size of the hydrocarbon molecules. Smaller chain molecules form gas, and larger chain molecules form crude oil.
Crude oil is a naturally occurring substance found in certain rock formations in the earth. It is a dark, sticky liquid with or without nonmetallic elements such as oxygen and sulfur. Crude oil is flammable and can be burned to create energy.
To get commercial deposits of hydrocarbons, you need deeply buried carbon-rich source rock (generates oil/gas), porous reservoir rock (holds oil/gas), and impermeable cap rock (traps the oil/gas). Conventional crude oil deposits lie mainly in sedimentary basins where the hydrocarbons migrate from the source and accumulate in reservoirs capped by impenetrable cap rock material such as shale. Exhibit 1.3 depicts a typical petroleum trap.

Exhibit 1.3 Geologic petroleum traps
Source: Mudslideexpert, Wikimedia Commons.
The source rock needs to have been buried for the right amount of time at a high enough temperature (150°F/65°C) to generate oil/gas from the organic matter that is preserved in the sediments. Natural gas forms faster than oil, but the higher the temperature, the less time required for the oil to form. If the temperature gets too hot (>300°F/150°C), then the oil is irreversibly transformed into graphite (carbon and carbon dioxide).
Because hydrocarbons are under considerable pressure, some of the crude oil may be forced upward and seep to the earth’s surface; the direct observation of these seeps can be a possible clue that an oil field exists. But nearly all of the time, we need to employ more sophisticated techniques to understand and map the subsurface. Seismic methods (sound energy) are among the most commonly used techniques to image the subsurface and locate the hydrocarbon traps. Satellite imagery, along with gravity and magnetic data, are often used to map possible fields in more remote areas. But the only way to know for sure if a field has commercial amounts of gas and oil is to drill a well. Onshore wells are typically less expensive than offshore wells, which require production platforms to both drill and produce the oil/gas.
When crude oil is found, it is compared and described by gravity, using a standard scale such as the American Petroleum Institute (API) scale.4 The scale measurement of the API gravity is based on the formula:
[(141.5/specific gravity at 60°C) − 131.5]
The API gravity is a measure of how heavy or light a petroleum liquid is, compared to water. If its API gravity is greater than 10, it is lighter and floats on water; if less than 10, it is heavier and sinks. API gravity is thus an inverse measure of the relative density of a petroleum liquid and the density of water, but it is used to compare the relative densities of petroleum liquids. Although mathematically, API gravity has no units, it is referred to as being in “degrees.” The API scale was designed so that most values would fall between 10 and 70 API gravity degrees. Light crudes fall between 35 and 45 API° and heavy crudes fall below 25 API°. Heavy crudes usually contain a significant amount of asphalt and are less valuable on the market.
The amount of sulfur present in crude oil is an important factor in determining its value. Sour crude oil contains sulfur, whereas sour natural gas contains hydrogen sulfide. Sweet crudes have less than 1% sulfur by weight, whereas sour crudes have greater than 1% by weight. In general, heavy oils are sour and light oils are sweet. Refineries usually pay $1 to $3 premium per barrel for sweet oils. Waxy crude oil contains a significant amount of wax formed by paraffin molecules. Because these crudes clog up the well and the pipelines, they are less desirable and command a lower price.
Uses of Crude Oil
Unless crude oil is refined into a by-product, it is of limited use in its natural state. The best-known product of these is of course gasoline. But the refining process provides many other important petroleum products such as liquid petroleum gas (LPG), naphtha, kerosene, gas oil, and fuel oil.
Additionally, several nonfuel products are also derived from crude oil by separating the oil and treating the resulting fractions to remove impurities. Then, different fractions are blended together to make various products including feedstocks. Petroleum feedstocks are the basic building blocks used for making many nonfuel products. The feedstocks and other products produced in the refinery are shipped to manufacturers, who turn the chemicals into many familiar products. Some of these products include liquids used in paints and printing inks; oils and greases used to keep car engines and other machines running smoothly; waxes used in making candles, packages, matches, polishes, crayons, and candy; petroleum jelly used in medical products, skincare products, and makeup; asphalt used for paving roads; synthetic rubber used in hoses; synthetic fibers used in carpets, clothing, and shoes; medicine such as aspirin and antihistamines; life-saving medical supplies such as artificial hearts, heart valve replacements, and pacemakers; chemicals such as pesticides; and detergents such as laundry detergent and dishwashing liquid. There are more than 4,000 different petrochemical products, but those that are considered as basic products include ethylene, propylene, butadiene, benzene, ammonia, and methanol.
How Long Does It Take to Discover Oil and Bring It to the Market?
This is a difficult question to answer at best but the general consensus is somewhere between 3 and 10 years from discovery to production if all goes well. Some of the key factors in determining the required time include field location, geologic complexity, politics, environmental concerns, land/mineral rights, access to pipelines, and the projected price of the oil. Some of the recent deep water offshore oil fields take longer to discover and present more technical challenges. Rigorous environmental impact plans are now standard operating procedure in most of these areas. These types of reports are time intensive, usually requiring various government entities/departments to provide approvals, which adds significantly to the development time for petroleum field development. Sometimes, the supply of trained oil field personnel cannot keep up with the demands, which also adds to the time required.
Production
Oil well production is measured in barrels of oil/day (barrels of oil per day [bopd] or barrels per day [b/d]). A barrel of oil contains 42 U.S. gallons. Primary production is oil produced by the original pressure of the reservoir. Improved (enhanced) oil recovery involves engineering techniques to get the oil out after the natural pressures have been depleted, that is, waterflood and gasflood.
One of the classifications of reserves is based on the probability of the field being developed. Probable reserves suggest that production is more likely than not (50%–89%). Possible reserves suggest that production is less likely than probable (10%–49%) with a <50% chance of being economically and technically feasible. Proven reserves have a 90% certainty of being developed using existing technology at current prices. The term maximum reserves combines those reserves that are proven, those that are profitable, and those that are possible.
Size and Location
Most of the better quality U.S. oil fields discovered in the 19th century have declined in production, but in Canada some of the original oil wells from the 1890s are still strong producers. Following World War II, production focused on the Middle East. Out of 24 of the largest oil fields (>10 billion barrels of proven reserves), 16 are around the Persian Gulf. Saudi Arabia’s Ghawar field was discovered in 1948 and is classified as the world’s largest field. The Middle East has approximately one-third of the world’s oil reserves. The OPEC nations produce approximately 41% of the world’s total daily oil production. OPEC’s oil exports represent about 60% of the total petroleum traded internationally.5
To categorize the fields by size, the industry uses the following terms:
| Giant | >500 mm barrels |
| Super giants | >5 billion barrels |
| Elephants | >120 billion barrels |
It is estimated that 47% of all current global oil production is from the largest 120 fields.6 All but three of the super giants were discovered between 1948 and 1968. Since 1980, the three new super giants include two in Kazakhstan and one in Brazil. Eighteen out of the top 24 oil fields are in the OPEC countries (Iran, Iraq, Kuwait, Saudi Arabia, Venezuela, Qatar, Libya, United Arab Emirates, Algeria, Nigeria, Angola, and Ecuador).
Many of the prolific oil-producing regions are out of bounds for western companies. The new areas for western exploration include the High Arctic and deep water areas around the world.
Crude Oil Units
The global standard for measuring crude oil is barrels. Wooden barrels were the common type of storage used in the United States in the 19th century, when crude oil first came into large-scale commercial use. Modern barrels or drums are made out of steel (Exhibit 1.4). One barrel equals 42 U.S. gallons (or 159 liters).

Exhibit 1.4 Modern steel oil drum
Source: L. Herkenhoff.
In some nations, crude oil is also measured in tons. The number of barrels contained in each ton varies, depending on the type and specific gravity of each crude blend. However, the average number is considered to be around 7.33 barrels per ton.
In the retail market, oil is sold in gallons or liters, whereas in wholesale it trades as barrels (bbls), gallons (gals), and metric tons.
Unconventional Hydrocarbon Products
Gas to Liquid (GTL)
In the GTL process, natural gas is converted to low-sulfur diesel fuel. The diesel product is affected by the price of the hydrocarbon feedstock used in the conversion process.7 One of the common methods is the Fischer–Tropsch process (FT-GTL)8 as shown in Exhibit 1.5. Typical conversion costs of gas to oil are about $20 per barrel.9
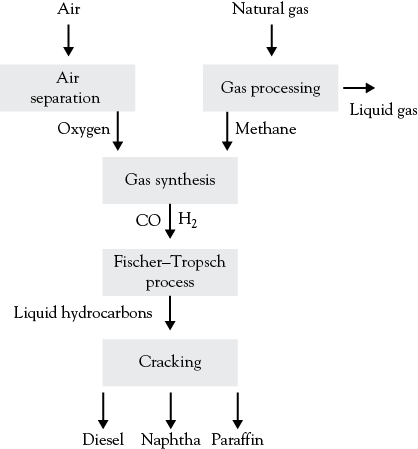
Exhibit 1.5 Fisher–Tropsch process
Source: Wikimedia Commons.
This method starts with partial oxidation of methane (natural gas) to carbon dioxide, carbon monoxide, hydrogen, and water. The excess carbon dioxide and water are removed, yielding synthesis gas (syngas) that is chemically reacted over an iron or cobalt catalyst (cracking) to produce liquid hydrocarbons and other by-products.
Liquefied Natural Gas (LNG)
LNG and GTL are two competing techniques for natural gas transportation. LNG is produced by cooling natural gas (methane) to a temperature (−269°F/−167°C) that allows the methane to condense to a liquid. The liquid occupies 1/645th the volume of natural gas. With production costs of $4.96/GJ (gigajoule) for GTL and $4.64/GJ for LNG, there is little difference between production costs for LNG and GTL. However, as GTL is in liquid form at room temperature and LNG needs to stay cooled at approximately −269°F/−167°C, transporting LNG is much more expensive. The transport costs of GTL are $1.3/km compared to $2.0/km for LNG.10
LNG technology has been available and proved commercial as early as the 1940s,11 but this petroleum product requires special ocean tankers to transport it. The first shipment by LNG tanker over a long distance was from Louisiana to the United Kingdom in 1959. By the end of 2011, there were 359 LNG ships engaged in the deep-sea movement of LNG12 (Exhibit 1.6). One major disadvantage of LNG is that an entirely new infrastructure has to be built for distributing the fuel. GTL can be distributed through existing diesel infrastructure.

Exhibit 1.6 LNG tanker
Source: Plines, Wikimedia Commons.
Global supply of LNG is expected to increase over the next few years, from 247 metric tons (mt) in 2015 to as much as 356 mt in 2020, with much of the supply coming from Qatar, Australia, and the United States.
Compressed Natural Gas (CNG)
CNG is odorless, colorless, and tasteless. It consists mostly of methane and is collected from gas wells or in conjunction with crude oil production.
Natural gas gets compressed into storage tanks for use as a transportation fuel. The gas is not compressed enough to turn it to liquid, but just enough so that a higher volume of gas can be stored in a smaller volume. CNG vehicles store natural gas in high-pressure fuel cylinders at 3,000 to 3,600 pounds per square inch.13 An odorant is normally added to CNG for safety reasons. CNG is often used in city buses; as early as 2002, one of every five new transit buses in the United States was powered by natural gas.14
The main challenge with CNG vehicles is the large amount of space required for fuel storage.15 The CNG tanks are often built into the trunk of the vehicle. Some automobile manufacturers install the tanks under the body of the vehicle, leaving the trunk free (e.g., Fiat Multipla, Fiat Panda, and Volkswagen Touran Ecofuel). One of the consumer trade-offs seems to be less space with bulky tanks but improved safety over gasoline-powered vehicles.16
Coalbed Methane (CBM)
Methane (CH4) is found in association with coal, and is well known in underground coal mining, where it presents a serious safety risk. Only recently, methane has begun to be extracted commercially from coal beds. In Australia it is known as coal seam gas (CSG).
The extraction of CBM typically involves pumping the water from the coal seam to reduce the water pressure that holds the gas in the seam. It is important to avoid removing all of the water, but rather to remove just enough to decrease pressure to a level suitable for gas migration. Environmentalists worry about the quality of the extracted CBM water on plants and soils.
Some groups consider CBM as a nonrenewable resource, whereas others such as the Alberta Research Council and the Alberta Geological Survey consider CBM as a renewable resource, because the bacterial action that formed the methane is ongoing17 Opponents to this hypothesis argue that the dewatering in the CBM production destroys the conditions needed for the bacteria to produce methane, and the rate of formation of additional methane is undetermined. This debate is currently causing a right of ownership issue in the Canadian province of Alberta, as only nonrenewable resources can be legally owned by the province.
Oil Sands
The oil sands are a mixture of clay, sand, water, and bitumen. The terms asphalt and bitumen are used interchangeably to mean both natural and manufactured forms of the substance. Bitumen is a sticky, black, and highly viscous liquid or semisolid form of petroleum. Its main use around the world is in road construction, where it is used as the binder mixed with aggregate particles to create asphalt concrete.
The largest fields are in Canada and Venezuela, but smaller fields exist in Siberia and Turkey. Oil sands are the most common source of unconventional oil. The high cost of development prevented aggressive exploration until recently. The total established reserve figure in the Alberta oil sands is estimated by Canada’s National Energy Board as 178 billion barrels.18 With this type of oil source, there is little exploration risk as you can see the hydrocarbon resource, but it is capital intensive with many possible environmental side effects. The oil is recovered using strip mining or in situ mining methods such as steam-assisted gravity drainage (SAGD). The final product is a low-sulfur diesel.
Oil Shale
Oil shale is a fine-grained sedimentary rock rich in organic material, which is referred to as kerogen. The organic precursor to crude oil, kerogen laden shale, is typically strip mined, and the extract is processed by heating. As the oil does not flow at room temperature, a heating process is required to separate the oil from the sediment. This process of producing shale oil has been going on since the 1850s, but it is more expensive and energy intensive than producing liquid oil conventionally. Shale oil in its naturally occurring form can be immediately burnt as a fuel oil, but many of its applications require that it be upgraded.
The economics of shale oil production have been hindered because of technical challenges. In March 2011, the United States Bureau of Land Management went on record as stating: “There are no economically viable ways yet known to extract and process oil shale for commercial purposes.”19 Some of the larger reserves are located in China, Estonia, Russia, South Africa, Australia, Brazil, and France. The United States contains more known deposits of oil shale than any other nation in the world.
Shale Gas
Methane gas or shale gas is found in fine-grained shale source rocks. Fracturing of the reservoir is required to remove the gas. Shale gas has been produced for years from shales with natural fractures; the current shale gas boom is primarily due to modern technology in hydraulic fracturing (fracking) to create extensive artificial fractures around well bores. Additionally, horizontal drilling is now used with shale gas wells, allowing for lateral distances of up to 10,000 feet (3,000 m) within the shale, to create maximum borehole surface area in contact with the shale. These two technology advancements, pioneered by Mitchell Energy, have helped producers to develop shale gas plays that were not considered economic in the past.
Shale gas areas are often known as resource plays, as opposed to exploration plays. The geological risk of not finding gas is low in resource plays, and the potential profits per successful well can be quite high.
The U.S. Energy Information Administration’s Annual Energy Outlook 2013 projects U.S. natural gas production to increase from 23.0 trillion cubic feet in 2011 to 33.1 trillion cubic feet in 2040, a 44% increase (Exhibit 1.7). Most of this increase is attributed to projected growth in shale gas production, which grows from 7.8 trillion cubic feet in 2011 to 16.7 trillion cubic feet in 2040.20
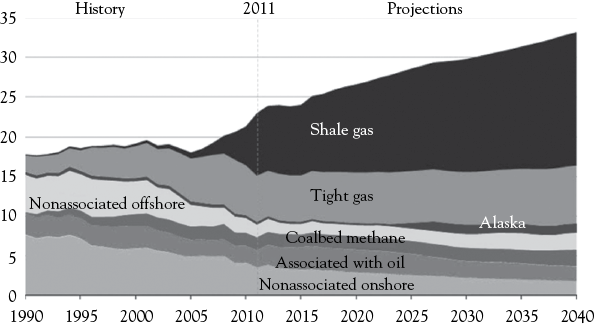
Exhibit 1.7 U.S. natural gas production projections
Source: y-axis figures in trillion cubic feet.
The world’s supply of shale gas is summarized in Exhibit 1.8,21 which shows the United States with the largest proven reserves, but China far exceeds the other countries in estimated recoverable reserves.
Exhibit 1.8 Global gas reserves by region 2016
|
% Global proven reserves |
|
|
Region |
(Trillion cubic feet) |
|
Middle East |
42.5 |
|
Europe and Eurasia |
30.4 |
|
Asia Pacific |
9.4 |
|
Africa |
7.6 |
|
North America |
6.0 |
|
South/Central America |
4.1 |
Renewable Fuels
Renewable fuels are fuels produced from renewable resources such as biofuels and hydrogen that is produced with renewable processes. The greatest challenge with biofuels is that the large amount of input energy required to complete the conversion often exceeds the output energy. These fuels are gaining interest, especially as people become more concerned about nonrenewable energy sources such as oil, contributing to global warming. Recent technology trends are making certain renewable energy sources, like solar energy, more cost effective, and therefore more in line with fossil fuel production.
In the United States, ethanol production gets large government subsidies: a direct subsidy to corn farmers and a tax credit for ethanol content in gasoline. Critics express concern that using grain as a fuel source will drive up the grain price, which impacts access to this important food source of lower income people.
Biodiesel is another biofuel and is produced from recycled cooking oils, soybeans, corn, palm trees, or the cotton plant. However, the supply in this category is the limiting factor.
Cellulosic biofuels minimize the impact on edible plants as these fuels convert waste materials such as corn stalks, woodchips, and other discarded vegetable matter to fuel.22
Pyrolysis oil is another renewable fuel derived from the lignocellulosic fraction of biomass.23 By rapidly heating biomass in the absence of oxygen (pyrolysis), a liquid crude can be formed that can be further processed into a usable bio-oil. The positive arguments for pyrolysis oils are that there is no need for large fermentation reactors; only the nonedible fraction of biomass is used, and the conversion can occur in the order of milliseconds.
Petrochemicals
Petrochemicals are not used as fuels directly but rather are usually used to enhance certain properties of fuels. Chemicals derived from hydrocarbon molecules account for about 6% of total global crude oil use.24
Two petrochemical classes are olefins including ethylene and propylene, and aromatics including benzene, toluene, and xylene isomers. Oil refineries produce olefins and aromatics by fluid catalytic cracking of petroleum fractions. Ethane and propane are produced by steam cracking of natural gas liquids. Aromatics are produced by the catalytic reforming of naphtha. Olefins and aromatics are used in manufacturing solvents, detergents, and adhesives. Olefins are often commonly used to manufacture plastics, resins, fibers, elastomers, lubricants, and gels.25
What Investment Is Required for Oil Exploration and Production?
Oil exploration can cost from thousands of dollars to hundreds of millions of dollars. The actual costs depend on factors such as the location of possible oil reserves (i.e., on land or in deep water), the reservoir depth, how large the oil field is expected to be, the level of required detail from the exploration information, and the type and structure of the rock below the ground. Exploration requires careful mapping of the subsurface to locate suitable sites (i.e., types of geological structures), geophysical surveys (i.e., with two- or three-dimensional seismic techniques), and test drilling. It is not easy to determine a typical cost for such a variable and broad range of activities.
OPEC has the lowest average production costs in the oil industry. This is partly because some Member Countries have large amounts of oil in reasonably accessible locations.
Pricing
The price of oil for immediate delivery is the spot price or cash price. The price of oil for delivery at a specified date in the future is called a forward price. Futures contracts and over-the-counter (OTC) swap contracts are commonly used instruments in working with oil for future delivery. Demand is said to be inelastic as it is relatively invulnerable to price movements. Global demand has been highly correlated to steady population growth of around 2% per year since the beginning of the oil industry, though U.S. demand dropped about 1% during the price spike in 2008.
Oil is traded in U.S. dollars rather than other currencies because the U.S. currency is the most fully convertible and liquid currency with the lowest transaction cost; this ensures lower costs for consumers. Second, oil trading in a single currency makes it easier to compare oil prices internationally and avoids transaction costs of using multiple currencies. The price of crude oil is increasingly set by movements on the three major international petroleum exchanges: the New York Mercantile Exchange (NYMEX), the International Petroleum Exchange in London (IPE), and the Singapore International Monetary Exchange (SIMEX). Brent Futures contracts trade on the International Exchange (ICE). This subject is discussed in more detail in Chapter 4.
Movement and Storage
A good share of oil moves by marine tanker that does not have the same economies of scale as a pipeline. Most natural gas is transported with minimal compression over land via pipeline.
To deal with seasonal demand and to hedge against unforeseen supply disruptions, oil and gas are stored in various locations. Oil is typically stored in above-ground tanks, and oil tankers can be used as temporary storage facilities. Natural gas can be stored in above-ground tanks, salt caverns, and depleted reservoirs. Oil is able to be stored efficiently and safely, but natural gas storage methods are still improving. That is not to suggest that oil leaking from storage tanks is a serious pollution problem when it happens.
Future
One of the primary concerns of this industry is that you cannot have infinite growth on finite resources such as oil and gas. Since the oil crisis of the 1970s, energy demand has grown, while oil has lost market share. The use of oil in global energy consumption has decreased from 46% in 1973 to 35% in 2005, whereas natural gas has increased its usage from 20% to 24%.26
There is an ongoing effort to know how much oil we have left, but accurate estimates of oil are difficult to achieve as the actual definition of what is included in the estimate vary. For example, when major oil companies report their oil reserves, they report barrels of oil equivalent (BOE), which includes unconventional resources and natural gas. Furthermore, most of the OPEC countries have never allowed an international audit of their reserves. Oil companies whose shares are traded on U.S. markets must follow SEC rules for reporting reserves, which include technologic and economic factors. Other producers (including government entities) have great leeway in defining “reserves.”
We don’t know where all the oil is located as there are many areas in the world where exploration is yet to be started. There are thousands of known unproduced oil deposits left alone because they are in very remote regions where access is limited or because the geology is too complicated. Even when the oil is identified, the required technology may not yet exist to make it profitable to extract from the ground. Political rationale may cause foreign governments to not share accurate estimates of their oil reserves with the outside world.
Because many of the largest oil deposits are not close to population centers, the distribution logistics can be complex and therefore expensive. As more oil gets found in these remote areas, environmental concerns increase and also add to the cost of extraction. In some cases, these concerns may result in a drilling moratorium, such as the one off the west coast of Canada.
At the end of 2011, OPEC reported that its proven reserves currently stand at approximately 1.2 trillion barrels with the following distribution in billions of barrels: Venezuela 297.6 (24.8%), Saudi Arabia 265.4 (22.1%), Iran 154.6 (12.9%), Iraq 141.4 (11.8%), Kuwait 101.5 (8.5%), Unites Arab Emirates 97.8 (8.2%), Libya 48.0 (4.0%), Nigeria 37.2 (3.1%), Qatar 25.4 (2.1%), Algeria 12.2 (1.0%), Angola 10.5 (0.9%), and Ecuador 8.2 9 (0.7%).27
Exhibit 1.9 summarizes the distribution of the world supply of primary energy according to OPEC’s World Oil Outlook 2012. The table also provides predicted distributions for 2020 and 2035.28
Exhibit 1.9 World supply of primary energy
|
Updates table World supply of primary energy |
|||||
|
Fuel shares % |
Growth 2009–2035 |
||||
|
2009 |
2010 |
2020 |
2035 |
||
|
Oil |
35.0 |
34.7 |
32.1 |
27.2 |
0.8 |
|
Coal |
29.3 |
29.5 |
30.1 |
28.6 |
1.7 |
|
Gas |
22.6 |
22.8 |
23.8 |
26.0 |
2.4 |
|
Nuclear |
6.3 |
6.1 |
5.7 |
6.0 |
1.7 |
|
Hydro |
2.5 |
2.5 |
2.6 |
2.9 |
2.4 |
|
Biomass |
3.6 |
3.7 |
4.3 |
5.4 |
3.4 |
|
Other renewables |
0.7 |
0.8 |
1.4 |
3.5 |
8.1 |
|
Total |
100.0 |
100.0 |
100.0 |
100.0 |
|