3
Managing Inventory
With the right account structure in place, we can begin to work on managing Amazon Web Services (AWS) resources—those items that actually contribute to your costs. We will look at several tools that AWS provides that help you see the resources you have running within your accounts. These resources, plus your defined financial operations (FinOps) processes, make up your inventory.
We will then look at ways to manage your inventory with native AWS tools and explore the necessity of tags and how they increase visibility into your inventory. Cost optimization is not possible when you don’t know what you have. Hence, this chapter provides you with the knowledge and tools needed to better manage your inventory.
In this chapter, we’re going to cover the following main topics:
- Tracking your AWS resources
- Establishing a tagging strategy
- Grouping tags with AWS Cost Categories
Technical requirements
To complete the exercises in this chapter, you will need the same components specified in the previous chapter.
“Now that all our accounts are in one place, what should be our next step?” Ellia asks Jeremy as they discuss the next steps while eating lunch in the conference room.
Jeremy takes a bite of his sandwich and ponders to himself, “We have better control of our accounts… what should we have better control of next?” After swallowing his bite, he says out loud, “Do you know which things are running in our accounts?”
Ellia furrows her eyebrows and responds, “I don’t entirely. I have a general idea of what is running but nothing in detail.”
“Who would know? Maybe Ezra?”
“Ezra might know. But developers would definitely know since they are in those accounts almost every day. Well… at least, I hope they know. We can ask Ezra first.”
Jeremy and Ellia invite Ezra to their next meeting and ask him the same question. Ezra shrugs and tells them, “Yeah, I know in general what the accounts are using. I know costs are rising month over month and I have a spreadsheet that breaks down the cost per AWS service. I’ve been tracking this information for months because it’s easier to do it in a spreadsheet when I have so many bills to consolidate.”
Jeremy updates Ezra on all the work that they’ve done in consolidating accounts, and how it may make Ezra’s life easier by getting one bill. “Thanks. That’s good news to hear. I think that will help”, Ezra tells him.
“Ezra, do you have a way to see what each account is using? Maybe see what we’re paying based on which service they are using?” Jeremy asks.
Ezra replies, “Yeah. I use a couple of tools for that. Here, let me show you.”
Tracking your AWS resources
If you don’t know what you’re paying for, you’ll find it to be quite tough to reduce waste. All jokes aside, we can take a simple yet relatable example of managing your own personal finances.
You would very likely be unsuccessful at managing your own personal finances if you didn’t look at your monthly bill to see where you are spending your money. You may forget that you’ve been paying for a gym membership or a music subscription service that you no longer use, or the pest control service from your previous home. The same discipline of identifying wasteful spending and reducing unnecessary resource use should also apply to your AWS bill.
Fortunately, you don’t have to wait until the end of the month to analyze your bill as you do your finances. You can, and should, track the resources that you are paying for on a regular basis. This is often the first step toward optimization because you must first know what you are using before you can optimize. Better yet, you might even identify resources that you don’t need and can turn off entirely.
It’s equally important to document your processes as well as your resources. It may very well be that you do not have any FinOps processes. That’s understandable and perfectly valid when you are in the beginning stages of your FinOps journey. As you mature, by documenting processes you can iterate upon what works, what does not work, and what the cloud center of excellence (CCoE) and teams can do to improve waste reduction. The collection of your resources and these documented processes combined constitute your inventory.
A brief primer on tags
Tags are a critical part of inventory management. You can tag a resource by assigning it a key-value pair. In other words, tags are a type of metadata for your resources. For example, a tag key of owner with a value of Peter helps folks within your organization identify a resource. They may safely assume that Peter is the owner of that resource, and any questions about its use can be directed to him.
Tags are key (no pun intended) because they provide additional context to your resources. When you are managing your personal finances, sometimes you can come across a line item that you don’t recognize. If you had a way to provide context to that line item (for example, I paid for gasoline in this city when I went to visit my friend on this date, even though I don’t recognize the entity Gas For Less, Inc.), then you know that it is a legitimate charge. The same applies to your AWS resources. Tags provide you that justification for a resource’s existence to prove that it is valuable to your business.
You can reduce waste by properly tagging your resources. Assuming teams adhere to an organization-wide tagging policy and that any tagged resources have a valid business purpose, then for any resources that are untagged, you might assume they don’t bring value to your business. Then, you can work toward deprovisioning those resources in your effort to reduce waste. This is an aggressive, albeit effective, way to manage your cloud resources to maximize efficiency. Most organizations won’t be at a level of maturity that reflects 100% of all cloud resources being tagged. However, this is a worthy goal to move toward. Some organizations might set goals that are at 60% and then increase these to higher values when they become more mature. Set whichever goals make sense to your business.
You can apply tags to your AWS resources, but you must know which AWS resources you have. The next section aims to alleviate the feeling of being overwhelmed but not knowing which resources you own and to whom they belong. We’ll look at several AWS tools that can help.
Tracking inventory with AWS Cost Explorer
An easy way to track cost and usage for free on AWS is with AWS Cost Explorer. Cost Explorer provides a visual interface allowing you to see monthly, weekly, and daily spend on AWS resources. If you access Cost Explorer at the management account, you can see costs per account within your organization, providing you a single pane of glass to see usage for all your accounts.
Important note
Although Cost Explorer is free of charge, you must first enable the service before using it. Follow the instructions on AWS’ documentation (https://docs.aws.amazon.com/cost-management/latest/userguide/ce-enable.html) to enable the service. You may have to wait up to 24 hours before accessing the service.
Cost Explorer has a simple interface where you can group by and filter on various attributes. For example, you can group by account to see which accounts were the highest spenders within a given period. Then, you can apply filters to see cost and usage for just the account with the highest spend. You can drill down further by seeing which services are costing the most and then drilling down on the application programming interface (API) operation used within that service.
You can create custom reports to meet your business needs. The following screenshot shows a breakdown of costs by service for the past 7 days:

Figure 3.1 – A custom report in AWS Cost Explorer
Because Cost Explorer is free of charge, it’s a great starting point to get a better understanding of your inventory.
Important note
If you access Cost Explorer at the member account level, you will only see cost and usage data for that account. You will not be able to see other accounts’ usage. Multi-account visibility is only available through the management account.
You may realize a significant portion of your costs comes from a RunInstance API action in a Region that has no association with your company. By collaborating with the right teams, you may realize that a rogue server was left running in a remote Region that an individual forgot to turn off after doing some testing. Cost Explorer would provide you that visibility, along with the ability to see trends in usage across and within accounts, which is important in setting a spend baseline.
Using AWS Cost Explorer to Find a Rogue Instance
With access to the management account within VidyaGames’ AWS Organization, Jeremy uses Cost Explorer to gain a high-level overview of spending patterns for the company’s AWS accounts. Jeremy takes a 6-month view grouped by service and finds that Amazon Elastic Compute Cloud (EC2), Amazon Simple Storage Service (S3), and Amazon Relational Database Service (RDS) constitute the majority of monthly spend.
Jeremy notices a spike in usage in a particular month, and so he changes from a monthly to a daily view within the given month. This higher charge is coming from the Amazon EC2 service, but Jeremy is unsure of the originating AWS account with this view.
Jeremy then changes the grouping to view by linked account and adds a filter to only show charges associated with Amazon EC2 instances. Using this view, Jeremy narrows down his scope to an account within the Sandbox organizational unit (OU). He cross-references the account identifier (ID) to its associated owner and finds that Andrew is the developer that owns the account.
Jeremy schedules a quick meeting with Andrew to review the usage. He communicates to Andrew that he’s exercising cost discipline and doesn’t intend to police resource use, but rather wants to ensure teams are optimizing their use of AWS.
“Oh, that?” Andrew responds. “That was something I was using to test upload speeds to our website. I purposely used a larger instance type to run a network performance benchmark. I thought I had terminated the instance, but I guess I left it running by accident.”
“That’s okay,” Jeremy replies. “This isn’t meant to be a slap on the wrist or anything. It’s just something that I noticed when I was looking at the cost reports. Thanks for letting me know! I think it is good that we identified this. We really should be able to find these anomalies quickly and respond accordingly. This will help save on costs.”
Using Cost Explorer requires low effort at a minor cost for Cost Explorer API calls. It can be used as a tool to get a preliminary view of your resources quickly, and it’s a great starting point when you may not have complex tools or third-party tools available to manage costs.
Cost Explorer provides monthly and daily granularity at no cost. You can elect to have hourly granularity at the cost of United States dollars (USD) 0.01 per 1,000 UsageRecord instances a month. A UsageRecord instance is one line of usage. For example, an Amazon EC2 instance running for 24 hours a day will generate 24 UsageRecord instances at an hourly granularity.
Another way to obtain hourly cost and usage data is with AWS Cost and Usage Reports (CURs). We’ll learn more about this in the next section.
Tracking inventory with AWS CUR
Cost Explorer is free of charge to a certain extent, and its native integration with the AWS user interface (UI) makes it easy to get started using it as a tool to view AWS cost and usage. However, it does have its limitations. For instance, you can only see historical data up to a 12-month lookback period. Additionally, you cannot use multi-dimensional queries such as grouping by several layers or visibility such as grouping spend by account, and also by service. Hourly granularity views in Cost Explorer come at a price. Fortunately, there is another native AWS offering at your disposal.
If you have and want to explore your cost data that goes beyond 12 months with support for hourly granularity, you can use AWS CUR. AWS CUR provides hour-level granularity for all charges across all your accounts. It also provides information Cost Explorer doesn’t show, such as the unit of charge for your usage (such as gigabyte (GB) stored, network input/output (I/O) consumed), at what rates you were charged, and each line item description, all in tabular format. Perhaps the most beneficial is the fact that the tags that you apply are added to CUR. This provides you with a more customized view of your cost and usage that is contextual to your business.
As with Cost Explorer, to see aggregate account usage, you access AWS CUR through the management account. By default, accounts are limited to viewing cost and usage within their own account. Unlike Cost Explorer, however, you must set up CUR to have AWS deliver cost and usage data to a specified S3 bucket. Hence, you will be charged for the data stored in S3. We will discuss ways to optimize S3 storage costs in Part 3, Operationalizing FinOps, of the book.
You can activate CUR at an individual account level or the organization level, using the management account. The report includes using columns that help you track inventory, including account identifies, rates and cost, usage amount and unit, and any tags that you specify. CUR provides the most comprehensive way to track inventory with hour-level granularity and API-level tracking, as shown in the following screenshot. With tags appended as columns to CUR, it provides what you need to break down AWS costs by tag. Results show the start and end time of usage, service name, API action, and cost:

Figure 3.2 – Querying CUR using Amazon S3 Select
You can find the steps you need to take to activate CUR on the AWS website at https://docs.aws.amazon.com/cur/latest/userguide/cur-create.html. Because it can take up to 24 hours for AWS to start delivering CUR data to your desired bucket, it will benefit you to have CUR activated as early as possible. You can configure CUR to send data at hourly, daily, and monthly time granularities, and if you need to, you can activate the resource_id parameter in the information lines, but this has a cost. Although you can only choose a single-time granularity type at CUR creation, you are free to create multiple reports to meet your needs. For example, you might set up a monthly CUR report and a separate daily CUR report to be sent to separate buckets. These reports may serve different purposes for distinct stakeholders.
Activating CUR for Visibility
Jeremy sees that VidyaGames does not have any CUR data, and immediately takes steps to activate it in the AWS Billing console. Jeremy creates an Amazon S3 bucket in the management account with the specific purpose of hosting CUR data. Having some data analytics experience in the past, he understands that CUR data will be delivered to him in tabular format. To ensure that he can make sense of the data, he needs to use a common query language such as Structured Query Language (SQL).
Given these requirements, he chooses daily time granularity and enables report data integration for Amazon Athena. Jeremy is aware that Amazon Athena is a serverless interactive query service. After watching some introductory videos on Athena, Jeremy understands that once AWS delivers the CUR files to his specified bucket, he will be able to use Athena to query the data in S3 directly without having to move the data to another data source.
After activating CUR, he waits until the next day to find content in his S3 bucket.
CUR excels over Cost Explorer due to the amount of information it provides in a single dataset. Cost Explorer is a UI for preset queries on grouped costs, while CUR lets you create your own queries if the ones from Cost Explorer are not enough to meet your needs. With Cost Explorer, you must create separate views to see your cost data in the desired grouping. You may save a report that shows spend by service, and another report that shows spend by account. On the other hand, CUR provides all your data in tabular format, so you are free to slice and dice your data using familiar tools such as pivot tables in Microsoft Excel or SQL queries to run aggregations.
Although comprehensive, CUR is just a tabular dataset of your cost and usage. In other words, you must use another tool to visualize the CUR data. Because you can access CUR data as a comma-separated values (CSV) file, you can certainly use Microsoft Excel to create basic charts for ad hoc visualizations, but for scalability and shareability, you can use Amazon QuickSight as a business intelligence (BI) tool. With QuickSight, you can create dashboards using common visual charts such as bar graphs, line graphs, pie charts, and pivot tables. Then, you can save and publish your visuals as dashboards to share with teams. QuickSight has many more advanced capabilities, such as machine learning (ML)-based forecasting and insights.
As cost management tools, Cost Explorer and CUR can help you understand which resources you own. Another tool that helps you gain a global view on Amazon EC2-related resources is EC2 Global View. We’ll look at this in the next section.
Tracking Amazon EC2 inventory with EC2 Global View
Amazon EC2 provides virtual computing environments on AWS. With Amazon EC2, you deploy virtual servers (also called instances) in minutes to run any kind of workload by specifying the type of instance to meet your business requirements. You can attach block storage to an Amazon EC2 instance. These are called Elastic Block Store (EBS) volumes that function like a hard drive on a personal computer.
A major benefit of Amazon EC2 is its elasticity—you provision the number of servers you need and pay for what you use. When you no longer need that compute capacity, you terminate the instance and no longer pay for that instance.
Important note
Amazon EC2 is a fundamental service on AWS. Learn more about it on the service documentation (see the references at the end of this chapter). Having a basic understanding of how Amazon EC2 works will be helpful for the upcoming topics in this book.
When you deploy Amazon EC2 instances, you place them in an Amazon virtual private cloud (VPC). Much like how you would deploy physical servers in a data center, you deploy virtual Amazon EC2 instances in an Amazon VPC. A VPC is a virtual network contained within your account. You can logically separate the network with subnetworks (subnets) that define a range of Internet Protocol (IP) addresses in your VPC. Additionally, you can define firewall settings for resources such as Amazon EC2 servers using security groups.
These services are commonly used by AWS customers. Fortunately, Amazon EC2 provides a global view of an account’s instances, VPCs, subnets, security groups, and volumes. When you select EC2 Global View in the AWS Management Console, AWS provides a dashboard displaying all your Amazon EC2-related resources, as shown in the following screenshot. You can also run a global search to filter resource ID, tags, or Region, and subsequently download the report as a CSV file for further analysis. Note that these resources are limited to those listed previously. If you want a comprehensive list of AWS resources, then use AWS Cost Explorer:

Figure 3.3 – Amazon EC2 Global View
AWS assigns a resource ID for Amazon EC2 resources within a Region. You can reference these resource IDs when searching for resources in Amazon EC2. In Figure 3.3, you can see EC2 Global View showing instances, VPCs, subnets, security groups, and volumes in all enabled Regions.
Using EC2 Global View
Jeremy understands that Amazon EC2 is one of the highest-spend services for VidyaGames across all AWS accounts, and while the exercise he completed to find a rogue Amazon EC2 server worked in Cost Explorer, it was a bit more cumbersome than he would have liked it to be. Fortunately, with his knowledge of EC2 Global View, he found a much better way to identify Amazon EC2-specific resources.
With read permissions for EC2 resources within the appropriate accounts, Jeremy uses Global View to get resource counts across all Regions. This makes it easier to him to view existing resources, rather than having to set up multiple reports and repeat filtering processes in Cost Explorer, especially when he needs to focus on EC2-specific resources.
Additionally, Jeremy uses EC2 Global View to not only clean up unused instances but unused security groups and EBS volumes as well. As an exercise like spring cleaning, Jeremy gains more confidence in being able to tidy up the company’s AWS resources, which provides a renewed sense of control.
With AWS CUR set up for the organization, Jeremy, Ezra, and Ellia have increased visibility into their cloud spend. They’ve created some reports in AWS Cost Explorer that show spending by member accounts, service, and Region. These regular reports give them a general understanding of how much teams are spending on AWS resources daily.
Jeremy has also set up CUR and has found the S3 bucket being populated with cost and usage data aggregated at the daily level. With the Athena integration, Jeremy can run basic SQL queries on the CUR data to see the top 10 spenders by account, service, and other interesting facts, such as the most used instance types. Having this visibility will help use data to develop cost optimization strategies for VidyaGames.
EC2 Global View is a useful tool for viewing EC2 instances, VPCs, subnets, security groups, and EBS volumes across AWS Regions. EC2 Global View is more specific in scope compared to Cost Explorer, but it provides a single pane of glass when you need to view EC2-related resources that are commonly a top spend for many AWS customers.
EC2 Global View helps identify resources within the Amazon EC2 domain. Let’s see how AWS Resource Groups can help identify resources across all domains, especially those without tags.
Tracking tagged resources with AWS Resource Groups
You can organize your AWS resources with AWS Resource Groups. Resource groups are another way to manage inventory and catalog more resources than what EC2 Global View provides (see the previous section).
Resource groups help organize resources with similar tags. This makes it easy for you to find logically grouped resources. For example, if you tagged an Amazon EC2 instance, an Amazon S3 bucket, and a VPC with the same tag, then you can group those three resources into a resource group. You can query all EC2 instances with that tag and conduct other inventory management tasks. These resources might make up an application. So, grouping resources by a tag-like application allows you to see the total cost associated with running an application.
In the following screenshot, you will see a tag-based query to group all resources in a selected Region with the Project tag key and JupyterNotebook value. You can then see all resources with this key-value pair:
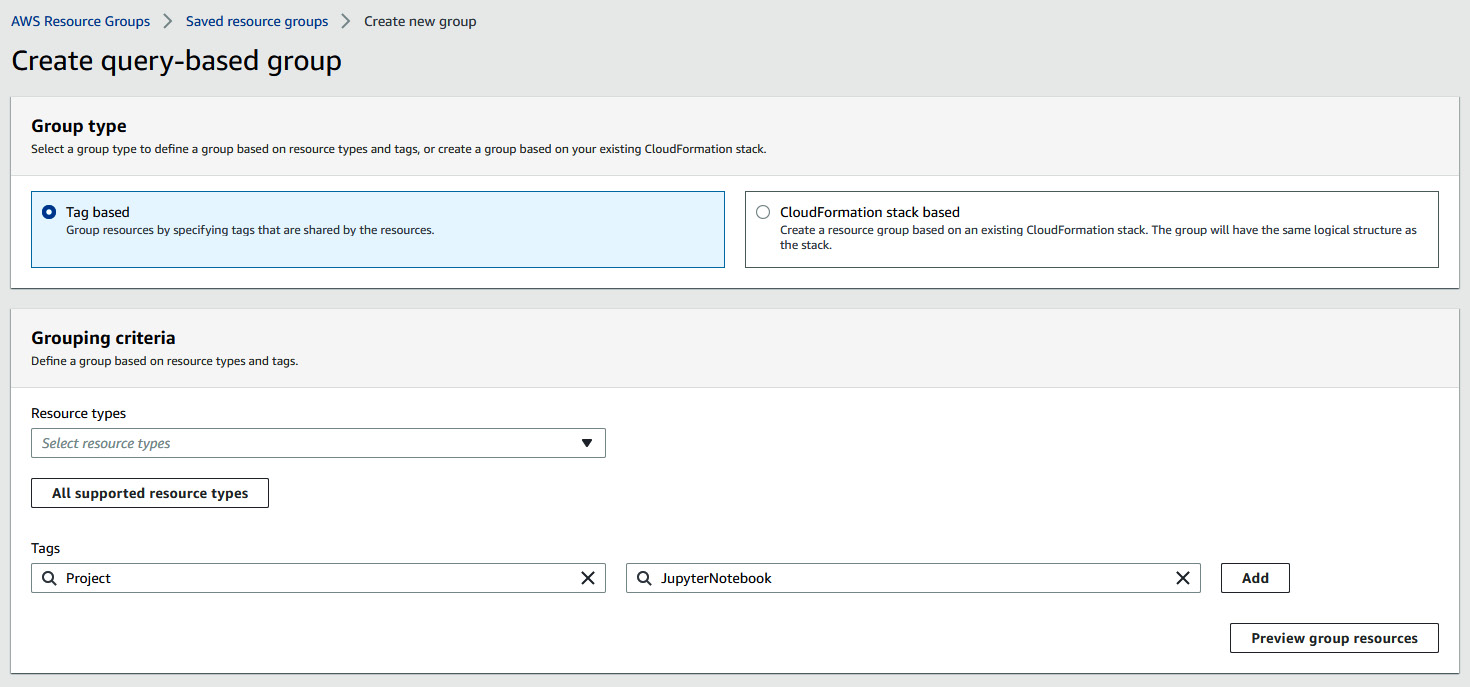
Figure 3.4 – Querying in AWS Resource Groups
Tag Editor is a capability within AWS Resource Groups that helps you find resources to tag. There may be cases where teams provisioned a group of resources pertaining to a specific business case. Perhaps these resources are all tagged by a specific application name, but developers forgot to apply an owner tag. With Tag Editor, you can find this group of resources with a similar application tag, and retroactively apply the owner tag in bulk.
Tag Editor also provides a view of resources that do not have any tags. This could be useful if you wanted a starting inventory to view untagged resources before implementing a tagging strategy. Note that you may not be able to query all resources using this method. AWS updates a list of resources you can use with Tag Editor (see the links in the references section at the end of this chapter).
To obtain a list of resources with specific tags or no tags at all, you can use Tag Editor in the management console. You can choose multiple Regions at once, specify resource types, and optionally select one or more tags (see Figure 3.5). Tag Editor will search your inventory, allowing you to export the results to a CSV file. You can also select multiple resources and manage tags directly in the AWS Management Console (see Figure 3.6).
The following screenshot shows how you can find all supported resource types to tag within the US-East (N. Virginia) Region using Tag Editor:

Figure 3.5 – Querying with Tag Editor
After obtaining results from a query, the following screenshot shows applying the owner:peter key-value pair as tags for the resulting resources. This enables you to apply tags to resources in bulk retroactively:
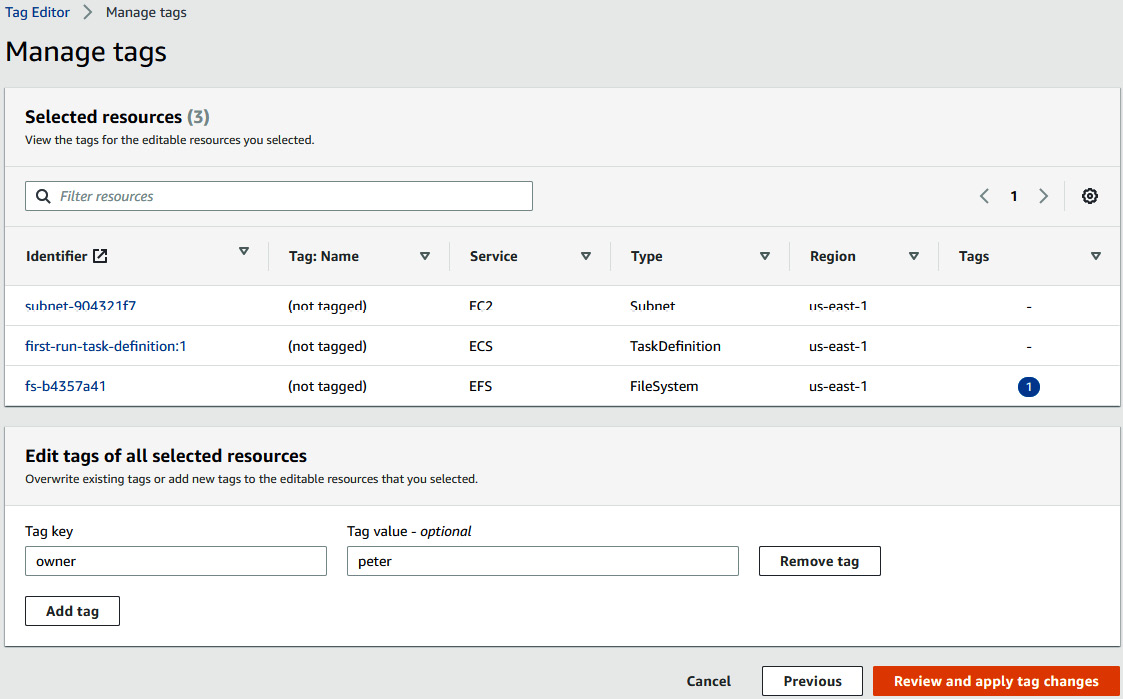
Figure 3.6 – Managing tags with Tag Editor
It’s reasonable that not all resources require tags. For example, some organizations may not find value in tagging a resource such as a Dynamic Host Configuration Protocol (DHCP) option set because that type of network protocol is expected for virtual servers in a network. Apart from that, Tag Editor is a useful tool to expose those resources without tags.
Tag Editor helps you get lists of resources with or without intended tags. You can use the service to understand which resources are running within an AWS account. Then, you can apply tags retroactively, enabling those resources to comply with your organization’s tagging strategy. However, Tag Editor cannot enforce any tagging requirements. This calls for another service, which is what we’ll look at next.
Tracking inventory with AWS Config
AWS Config is a service that helps you keep track of your inventory and any changes made to your inventory. Imagine AWS Config as a surveillance camera monitoring your AWS resources. For example, perhaps you use AWS Config to see all resources and their configurations in a given week. In the following week when you log back into the Config console, you now can see that resources decreased by a certain amount, with slight changes to their configuration. AWS Config provides this view for a single account, but also for your entire organization through the management account.
Unlike the other methods of tracking inventory that we explored in this chapter, you must initialize AWS Config with some setup, although you can set up Config in one click. The setup process involves choosing the resources you want Config to monitor and sending those results to an S3 bucket. Then, you specify which rules those resources should follow. Config will monitor your resources according to your defined rules and inform you if those resources are compliant.
For example, if you require all EC2 instances across your organization to be tagged with an owner key and the necessary value, you can specify the EC2 resource type and this rule in Config. Config will then monitor your inventory and display those resources as compliant according to the rule, as shown in the following screenshot. Here, we see an AWS Config resource inventory showing all resource types and their respective compliance statuses. For example, we see certain Amazon EC2 subnets marked as Noncompliant. We will take a closer look at governing your resources in Chapter 5, Governing Cost and Usage:

Figure 3.7 – AWS Config resource inventory view
Config is much more valuable as a management and governance tool than it is simply as an inventory management tool. Indeed, Config can help you view your inventory, but it can—and should—be used to do much more than that. We’ll take a closer look at how it can help with FinOps controls and governance in the next chapter.
In this section, we looked at Cost Explorer, CUR, Tag Editor, and AWS Config as tools that help you gain a better understanding of all resources running within your AWS accounts. You can use these tools as starting points if you’re unsure of which resources you have running. This is required for any cost-saving strategy because you must know what you own before you can optimize. To ensure all teams take ownership of the resources they deploy, it helps to have a tagging strategy, which we’ll discuss next.
Establishing a tagging strategy
A clear and clean tagging strategy aligned to the needs of your business will improve your ability to track resources, and subsequently reduce waste. Verifying a resource’s purpose will justify its existence in bringing value to the business. At the same time, justifying a resource’s termination also brings value to the business by eliminating waste.
The right tagging strategy will change depending on the organization. In fact, the right tagging strategy can change within an organization over time as teams, priorities, and business needs change. However, there are some general best practices you can include to set up a tagging strategy that works for you.
Set up tags for cost allocation. This can be in the form of business tags that help folks see the cost center, BU, or a project the resource supports. You may want to align cost allocation tags to your financial reporting practices. For example, your financial department has reports that cover several dimensions such as BU, cost center, or geographic area. Aligning cost allocation tags to existing processes will help streamline reporting.
Use a common language when naming tags. Include all necessary stakeholders when establishing your tagging strategy. If developers are tagging cost centers in a way that’s unexpected to how finance reports on those tags, then the reports may reflect inaccurate data. For instance, if developers are tagging resources using the name of cost-allocation-center but finance teams expect the tag name to be cost-center, it may lead to a misinterpretation of data. Establishing consistent language and naming standards that all teams adhere to will improve your tagging hygiene and, ultimately, better inventory visibility.
This leads to another important aspect of employing a cross-functional team to identify the right tagging requirements for your organization. Although finance teams may primarily be concerned with cost allocation tags, business teams and application teams may require other metadata associated with resources. Ensure all teams are aligned on tagging requirements and that stakeholders can refer to a source of truth (SOT) when providing tag names and values. We’ll dive deeper into tagging governance in Chapter 4, Planning and Metrics Tracking.
Create open channels of conversation, set up a regular cadence among cross-functional teams to discuss tagging hygiene, and consider pivoting on tagging strategies when needed. You may not need to change your tagging strategy, but it’s still important to communicate consistent use of tags and tag values.
Applying a Tagging Strategy at VidyaGames
Jeremy and Ellia begin scheduling regular meetings with technology teams to formulate a tagging strategy. Through these meetings, they agree on a common nomenclature to tag resources based on the application name, owner, cost center, and schedule. Through these conversations, teams realize that a tag of schedule will help inform teams of how long a resource is expected to run. Delineating between resources that need to be up 24/7 versus resources that only need to be up for a few hours allows the teams to be diligent in reducing waste. Jeremy’s mind begins percolating ideas of using automation to stop instances with a schedule tag that specifies business-day use.
Keep in mind the downstream effects of changing tags. Changing tag names may lead to inconsistencies in reporting when comparing a resource with a new tag from today to the same resource with an old tag from several weeks ago. Or, if you have policies that require a certain tag, you may need to update that policy to accommodate the new tag. Communicate changes to tagging strategies and create a change management process to minimize adverse effects.
Be aware of AWS tagging limitations. Currently, there is a limit of 50 user-created tags. Choose the appropriate number of tags that provide the most clarity. Sometimes, adding too many tags creates unnecessary noise. Using the fewest number of tags necessary can help keep your reporting clean.
We’ve seen the importance of tags toward waste reduction and inventory management, but tags can be too granular at times. If you need a coarser way to manage resources or group resources together by tag, use AWS Cost Categories.
Grouping tags with AWS Cost Categories
At this point, you are aware of the AWS tools that can help provide an inventory of resources across your accounts. You know that you can apply tags and associate resources with meaningful organizational assets such as owners, applications, cost centers, and BUs. Combining these strategies and tools can help you start to identify resources that you can terminate.
AWS Cost Categories provides an additional layer of resource management and cost visibility. There may be cases where your tagging strategy is either too granular or too coarse to provide the information you need. For example, perhaps you organize your accounts to support multiple applications. You have a structure that mimics the one shown here:

Figure 3.8 – Using AWS Cost Categories to group tags together
Applications A, B, and C are their own OU. Within each OU, there are three accounts to represent different environments. You initially assign tags to both accounts and resources within those accounts to reflect the application name. The tags for resources in application A would have a name-value pair as Application: A.
Using Cost Categories, you can group these tags to represent different levels of granularity. For example, you may group the tags for applications A, B, and C into one category that presents a full workload. Perhaps all three applications work together to support a specific product (in this case, OurProduct). You can use Cost Categories to then group these tags to show the total cost of that product.
Another way to slice and dice this environment is to create another cost category for just the test environments representing all three applications. Cost Categories allows you to create rules using different dimensions such as account ID, resource type, and tags. In this case, you could create a category that encompasses just the test environments for the application to see how much you are spending on testing in total for the product.
Your cost categories will reflect in both Cost Explorer and CUR. Use it to your advantage to help you gain visibility into resource use. Ideally, every meaningful resource should be tagged and categorized into logical groupings. This will allow you to isolate resources that don’t have tags under the assumption that tagless resources don’t provide value to your business. You can then prioritize terminating these resources to reduce waste.
Summary
In this chapter, you learned about the various ways you can create an inventory of your AWS resources. You learned that you can get started easily by enabling Cost Explorer and using the interface to view your resources. For a more detailed and granular view, you can use AWS CUR to have AWS send you monthly reports on cost and usage across your organization.
You further discovered other ways to gather inventory, including EC2 Global View for resources related to Amazon EC2 and Amazon VPC, Resource Groups and Tag Editor, enabling you to export results to a CSV file, and AWS Config for ongoing inventory management and change.
You gained an understanding of the importance of a tagging strategy that works for your organization. There are certain tagging best practices that you can apply, but it’s important to implement your strategy with cross-functional collaboration and streamlined communication.
Finally, you learned about how AWS Cost Categories provides you with ways to group tags to provide another layer of inventory visibility. By combining these concepts, you can begin to map resources to business value and prioritize cleaning up resources that cannot be mapped to a use case. This brings you a few steps closer to eliminating waste.
With a better grasp on the resources you own, you now want to better plan for future costs and usage. This implies a need for proper planning and budgeting, topics we’ll explore in the next chapter.
Further reading
Have a look at the following resources:
- Enabling Cost Explorer, 2022: https://docs.aws.amazon.com/cost-management/latest/userguide/ce-enable.html
- Filtering and retrieving data using Amazon S3 Select, 2022: https://docs.aws.amazon.com/AmazonS3/latest/userguide/selecting-content-from-objects.html
- What is Amazon EC2?, 2022: https://docs.aws.amazon.com/AWSEC2/latest/UserGuide/concepts.html
- Resource IDs, 2022: https://docs.aws.amazon.com/AWSEC2/latest/UserGuide/resource-ids.html
- Resources you can use with AWS Resource Groups and Tag Editor, 2022: https://docs.aws.amazon.com/ARG/latest/userguide/supported-resources.html
- Setting Up AWS Config with the Console, 2022: https://docs.aws.amazon.com/config/latest/developerguide/gs-console.html
- Tagging AWS resources, 2022: https://docs.aws.amazon.com/general/latest/gr/aws_tagging.html