11
Driving FinOps Autonomously
In the previous chapter, we laid the groundwork for creating and governing the right metrics for our FinOps purposes. We need data to track how well we are moving toward our FinOps goals. We used a framework to define how we will capture and manage that data through meaningful metrics. We also looked at doing this through a cross-functional, centralized team made up of various personas within our organization. We also took an introductory glance at using several AWS analytical tools to query and visualize our cost and usage data.
In this chapter, we’ll learn about more advanced techniques for leveraging these tools to help you drive FinOps for your organization. We’ll broaden our use of AWS services to incorporate messaging, application integration, and machine learning (ML) to make our FinOps efforts more robust.
In this chapter, we’re going to cover the following main topics:
- Creating a self-service FinOps portal
- Forecasting spending using ML-driven insights
- Forecasting cost and usage with Amazon Forecast
- Automating cost optimization within operations
- Integrating Trusted Advisor with other AWS services
Creating a self-service FinOps portal
We have covered much ground in using many AWS services to build the visibility you need to enable your FinOps practice. First, we looked at AWS Cost and Usage Reports (CUR) as the dataset to fuel our cost visibility. Then, we looked at AWS Glue to crawl our data and catalog our metadata. After, we looked at Athena as a tool to query our data, and QuickSight to visualize it. Putting all these pieces together does take time, and can take longer to build the processes you need to operationalize these into a FinOps practice. Wouldn’t it be nice to be able to deploy all these resources at once and start with a baseline template that you can use to iterate as your FinOps practice matures?
This is where AWS’ Enterprise Dashboard solutions can come in to help remove the complexities in building these solutions and streamline the process of making these dashboards available. AWS provides a series of out-of-the-box dashboard templates that you can use to gain insight into your cost and usage, as well as enabling your FinOps team to better understand the cost landscape of AWS environments to find opportunities to optimize.
The ability to quickly deploy these solutions requires us to better understand AWS’ infrastructure as code (IaC) offering. That is what we’ll look at next before we dive deeper into the dashboards.
Understanding AWS CloudFormation
AWS CloudFormation is an IaC service that helps you define and model your AWS resources. You define what AWS resources you want to use in a template. Then, you use that template and instruct AWS to provision the resources you defined in the template for deployment. In this way, CloudFormation is a declarative IaC tool. Using CloudFormation helps you provision resources quickly. An alternative way to provision AWS resources is to do so through the AWS Management Console via a series of point-and-click actions. This method has its advantages as users can see what resources and configurations they will use through a user interface. However, it takes time to select all the options. Additionally, doing this at scale is less efficient when you have repetitive processes.
Codifying your steps by declaring the AWS resources you want to provision through code is a much more efficient, scalable, and secure way to deploy AWS resources. Not only can you reuse the same template to deploy resources in different accounts and AWS Regions, but you can version control your templates to streamline operations as well.
There are a few reasons why deploying your AWS resources using an IaC service such as CloudFormation can help control your AWS spending:
- It helps you stay within budget. Since the AWS resources that will be deployed through CloudFormation are predefined, you can expect your costs to be as planned. For example, if you know you will be deploying 10 specific instance types to support a particular workload, you’ll know how much you’ll be spending per hour, assuming you’ve already researched to find out how much each of those instances will cost per hour. The CloudFormation template will have already specified those 10 instances, so you’ll know what you’ll be paying after deployment. On the contrary, if you expect teams to deploy resources without a controlled IaC template such as CloudFormation, then your costs will be more unexpected.
- On a related note, CloudFormation simplifies your infrastructure management, so you only deploy the resources you need. Assuming teams have clearly defined the workload needs and outlined the required resources, CloudFormation will help teams adhere to deploying only those resources they need, reducing the risks of unnecessary resources that contribute to costs.
Using the CloudFormation services doesn’t cost anything. You only pay for the resources CloudFormation deploys, as declared by your template. In that sense, CloudFormation doesn’t provide any direct cost savings over any other method of provisioning resources, but it is helpful to understand how CloudFormation works as we move into the next section of deploying Enterprise Dashboards through CloudFormation.
Getting to know AWS’ Enterprise Dashboards
AWS provides out-of-the-box solutions that your organization can use to manage cloud costs. These solutions use the AWS services we covered in the previous chapter to build dashboards that help you view and analyze your AWS cloud spending. For example, with these dashboards, you can create chargeback and showback reports to see how teams are performing when managing their cloud costs, view how teams are using Savings Plans and reserved instances, track spot instance usage, and track unit metrics based on your defined tags.
You can use the steps outlined in this section to create a Cloud Cost Intelligence Dashboard framework. You can choose to do this at the AWS Organization level to view costs across your organization. You can also provide this framework for individual teams to implement within their AWS accounts. Teams can leverage this self-service approach to create their own cost and usage portals and see how they are performing concerning organizational standards. It also reduces the need for teams to configure each required AWS resource separately. Teams can use CloudFormation to deploy the solution in a self-service manner, removing the need for members to have in-depth technical knowledge or understanding of AWS services.
These dashboards begin with AWS CUR as the most comprehensive set of cost and usage data available for AWS accounts. Starting with this data source, you can aggregate your costs across all AWS accounts within your AWS Organization, or separate your costs by accounts and/or cost allocation tags and cost categories.
Now, let’s see how we can integrate these services to build the metrics visibility we need to scale our FinOps efforts.
Setting up the dashboards
Regarding the prerequisites, you will need to enable the following services:
- Set up AWS CUR for your account
- Get started with using Amazon Athena by setting a query location in Amazon S3
- Enable Amazon QuickSight
Please refer to the previous chapter to get these set up.
Once you have set up CUR and AWS sends the CUR data to your designated Amazon S3 bucket, you will have access to the crawler-cfn.yml file within the Amazon S3 bucket. The following screenshot shows this file within Amazon S3:

Figure 11.1 – Accessing the crawler-cfn.yml file
You can typically find this file within the file path, which follows the <your-S3-bucket-name>/cur/<your-cur-report-name>/crawler-cfn.yml pattern.
You will reference this file in the next section when you deploy a CloudFormation stack. When you access the AWS CloudFormation page in the AWS Management Console, you can choose to upload a template file or reference a file by providing the Amazon S3 URL. The following screenshot shows the option to upload a template file for deploying the stack:

Figure 11.2 – Uploading a CloudFormation template
Important note
You will notice that the template that was uploaded to CloudFormation was in YML format. You can also provide the template in JSON format.
Next, you can add tags, configure rollback configurations, set up notifications, and more to set up advanced options.
On the final page before deployment, you can review your options and acknowledge that CloudFormation will create resources on your behalf, as shown in the following screenshot. Sometimes, CloudFormation templates create roles through AWS IAM resources, which make changes to your AWS environment. These roles are required to perform specific tasks and so long as you are aware of what the template intends to do with your environment, you will not see any unnecessary or unexpected changes. Keep in mind that the CloudFormation service itself does not incur costs. However, the resources that are deployed by CloudFormation may incur costs, such as if you deploy an Amazon EC2 instance through CloudFormation. In that case, you will be charged normal Amazon EC2 hourly rates. Thus, CloudFormation wants to ensure that you intend to deploy the template and all its subsequent actions for resource provisioning:

Figure 11.3 – Acknowledging CloudFormation resources
Once you create the stack, CloudFormation will deploy the resources as defined by your template. In this case, CloudFormation creates several IAM roles that provide certain AWS services with the necessary permissions to invoke and access other AWS resources. Services such as AWS Lambda assume these roles and can run tasks such as initiating an AWS Glue crawler job and sending event notifications. The CloudFormation template also creates an AWS Glue table to catalog your cost and usage data. The following screenshot shows CloudFormation’s progress as it deploys these resources:
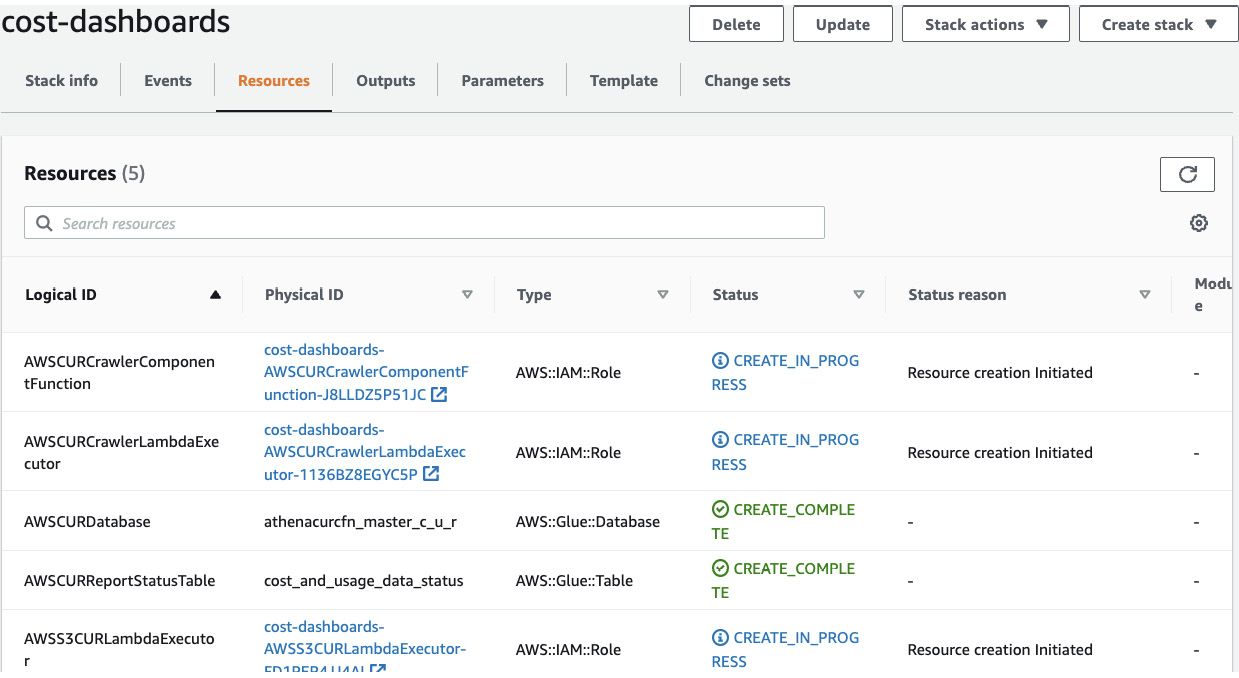
Figure 11.4 – CloudFormation provisioning resources
Once CloudFormation provisions these resources, you have everything that you need to create the dashboards necessary to report on your cost and usage data. Using CloudFormation, we’ve automated the steps of setting up the resources we need for our teams to implement these solutions on their own. In this way, teams can leverage this self-service mechanism to set up these dashboards within their accounts if necessary.
The last step is to set up the dashboards themselves in QuickSight. We already have the data integration between CUR and Amazon Athena. We did this when we activated CUR. We also learned how to create dashboards in the previous chapter using QuickSight.
Fortunately, AWS provides a command-line tool that helps us quickly and easily set up these dashboards with a few commands. All we need to do is to install the Cloud Intelligence Dashboard (CID) Python automation package and then deploy the dashboards. You can do these steps by running the CID-cmd deploy command on your local shell or in AWS CloudShell on the Management Console.
What is CloudShell?
AWS provides CloudShell, which allows you to interact with your AWS environment and resources in a browser-based shell. When you use CloudShell, you are already authenticated with the credentials you used to log into the AWS Management Console. This provides an easy way to use shell commands to interact with your AWS account.
The following screenshot shows deploying the CUDOS dashboard in CloudShell. You can use the commands shown here to deploy the solution:

Figure 11.5 – AWS CloudShell
The CID-cmd deploy command allows you to choose among several Enterprise Dashboard types. CUDOS Dashboard is a CID that provides a foundation for your cost management and optimization reporting tools. This is an interactive, customizable, and interactive dashboard that uses Amazon QuickSight to help you gain visibility into your cost and usage.
Next, let’s see this dashboard in action.
Using the Cloud Intelligence Dashboard
AWS provides a demo dashboard for your reference. We’ll use this dashboard throughout this section as it helps set a shared baseline. Since this dashboard is customizable, using the demo version will ensure there are no differences between users.
The Billing Summary dashboard (Figure 11.6) provides a snapshot of the cost and usage of your actual cloud spending. This provides teams and executives with visibility into historical and forecasted spending and how they are trending over time for both invoiced and amortized costs. This summary page is a great first step to checking the overall cloud spending. Then, you can drill down into specific cost and usage patterns:

Figure 11.6 – Billing Summary dashboard
For example, the Billing Summary dashboard provides a visual for Invoiced Spend Trend. This chart provides an overall view of invoiced spending for the whole AWS Organization (Figure 11.7). AWS categorizes invoiced spending by usage, reserved instance fees, Savings Plans fees, and others. Although the default view is aggregated for all AWS accounts, you can select the visual and control to view spending by account ID or account name. Furthermore, since these visuals are ultimately available in Amazon QuickSight, you can customize the dashboard to view cost and usage by some other dimension such as team or cost center:

Figure 11.7 – The Billing Summary dashboard zoomed into Invoiced Spend
The CUDOS dashboard provides two other executive-level views – the RI/SP Summary view and the month-over-month or MoM Trends view. The MoM Trends view (Figure 11.8) informs you of usage trends over a set period. You can see how teams’ usage of specific AWS products changes over months as well as the spend usage patterns for particular accounts within your organization:
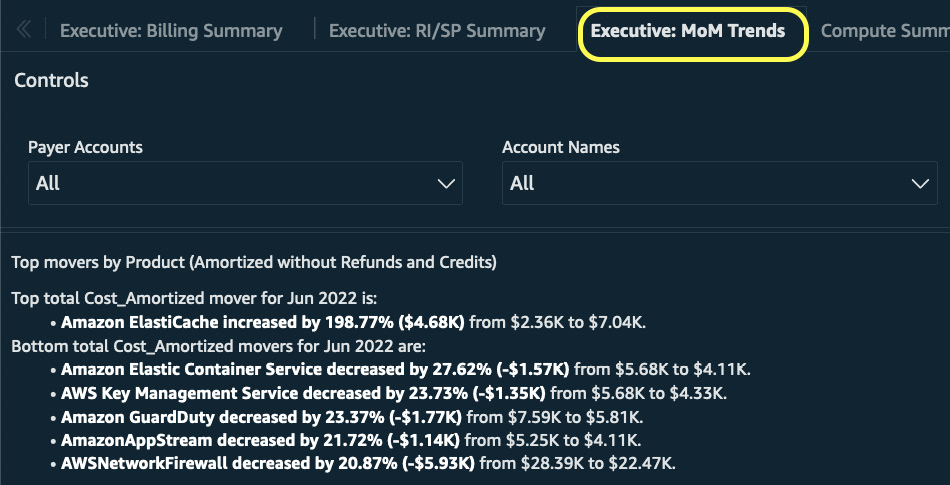
Figure 11.8 – The MoM Trends view
The RI/SP Summary view (Figure 11.9) combines your reserved instance and Savings Plans purchases in one place. For a given month, you can see how much of your commitments you’ve leveraged to experience savings. You’ll see what teams benefited from these savings in addition to the applications if you’ve been tagging your resource use properly with application tags:

Figure 11.9 – The RI/SP Summary view
You can also view amortized spending by purchase to see how well you are leveraging the on-demand, steady-state, and spot prices across your AWS accounts. By default, the view applies to all AWS accounts within your enterprise. You can filter by specific AWS accounts, or apply any custom filters via the QuickSight interface. The bottom views show potential future savings by highlighting the hourly Amazon EC2 costs by pricing model to show where your current coverage rate is at. The preceding screenshot shows the Compute Savings Plans’ eligible savings to highlight areas of opportunity to optimize.
The dashboard provides focused visibility into your compute and storage costs. The following screenshot shows the Compute Summary view, where the dashboard breaks down your compute spend by purchase option. You can see how well your enterprise has adopted Spot and Savings Plans to optimize your compute spend. The default view also provides visibility into compute spending by AWS account ID, EC2 instance type, and even AWS Lambda usage:

Figure 11.10 – Compute Summary view
The Compute Summary view contains other widgets to help you find opportunities to optimize. For example, it provides recommendations to upgrade to newer-generation instance families to take advantage of lower costs. It also presents insights toward purchasing additional Savings Plans for optimization.
In addition to compute optimizations, the dashboard provides a storage optimization view for both Amazon S3 and database solutions on AWS. The following screenshot highlights the storage optimization views for both use cases:

Figure 11.11 – Storage optimization views
The views for Amazon S3 break down your storage cost by storage tiers. You can use this information to see how teams are leveraging the various storage tiers to take advantage of lower storage costs. The view also aggregates S3 storage usage, similar to how Amazon S3 Storage Lens aggregates storage costs across your organization (see Chapter 7, Optimizing Storage).
For databases, the view provides insight into database reserved instances use to ensure you’re optimizing usage for databases, especially if their workload patterns are steady-state. There are alerts for idle databases, which will further reduce your storage costs since these will help you deprovision resources to prevent you from paying for unneeded resources. And, like compute, the view shows you opportunities to leverage the latest (and cheapest) generation of databases to optimize.
For network optimization, the dashboard has a Data Transfer Summary view that aggregates networking costs, as discussed in Chapter 8, Optimizing Networking. The following screenshot shows the different visuals available under the Data Transfer Summary view:

Figure 11.12 – The Data Transfer Summary view
You’ll see data transfer costs by account and by type, which will help you zero in on which accounts and applications are contributing most to your networking costs. You’ll also find recommendations for reducing data transfer costs as the view presents opportunities to optimize by inspecting idle load balancers and NAT gateways.
What are NAT gateways?
NAT gateways help you improve your security posture by allowing network connectivity out to the public internet within private subnets. Typically, you need resources to be placed in public subnets to obtain public internet access, but sometimes, you only want to egress traffic out to the internet from your secure Amazon VPC. NAT gateways make this possible.
Customers often struggle to demystify their data transfer costs. The Data Transfer Summary view helps you understand how data transfer costs are accumulated within your organization. Some visuals show your data transfer usage ranked by highest to lowest for each region, AWS account, and resource. These are provided out of the box so that you can easily access this information. Understanding where your highest data transfer usage is within the enterprise is the first step in finding ways to optimize that usage.
The AI/ML Summary view contains visuals and recommendations for the topics we covered in Chapter 9, Optimizing Cloud-Native Environments. First, it provides recommendations to optimize AI/ML-based workloads. It suggests using Spot for SageMaker training jobs, which can reduce your training costs by up to 90%. It suggests auto-detecting idle notebook instances to turn them off on a schedule to remove waste. This ensures these data science workstations are only incurring costs when data scientists are using them. It suggests auto-scaling for your model endpoints to adjust the scaling policy based on CloudWatch metrics so that your model endpoint deployments are optimized. Naturally, it recommends using SageMaker Savings Plans to reduce costs for folks within your organizations that regularly use SageMaker.
The following screenshot shows charts within the AI/ML view, which differentiates costs by instance type and usage type. The chart by instance type can help you identify instances that may be over-provisioned. One of SageMaker’s benefits is that you can decouple data science exploration and script development from the training and inference steps. In other words, you have the flexibility to develop training scripts and code your ML workflows on a relatively smaller (and cheaper) ML instance type but use more powerful CPU- or GPU-based instances for model training and deployment. You’re not tied to using a faster or more expensive instance type because you can leverage the elasticity of the cloud to use the compute resources you need on demand. If you identify that many data scientists are using more expensive instance types than they need, you can lower costs by right-sizing their development environments:

Figure 11.13 – The AI/ML view
You can also differentiate between the SageMaker usage types to break down what the costs are between model development, training, and inference. Generally, inference is going to cost more when you are using ML-based workloads at scale. This is because inference has a longer lifespan than training or development. You want to have a useful ML model running for years providing valuable inference opportunities. The training time to build that model will likely not have taken years to develop. You can use this data to see the cost ratio between model development and training to model endpoints and optimize your processes for both.
In this section, we looked at native AWS solutions for cost visibility and analysis using your cost and usage data. We looked at how you can easily build cost and usage dashboards for folks across your enterprise to give them the visibility they need on your AWS spending. We also learned about using CloudFormation to deploy resources quickly and efficiently through code. Everything we discussed involved looking at our cost and usage in the past to see what we can improve in the future.
Next, we will shift our time horizon to look to the future by seeing how we can leverage some native AWS tools to forecast our AWS spending using ML-driven insights.
Forecasting spending using ML-driven insights
An integral part of managing costs and spending is planning what your costs will be in the future. Thoughtful planning has the advantage of you getting ahead of yourself and making sure your AWS spending is within budget. We saw a bit of this in Chapter 4, Planning and Metrics Tracking, where we learned about budgeting and cost anomaly detection using AWS Budgets and AWS Cost Explorer, respectively. We’ll expand more into the forecasting side of things in this section.
Forecasting is the process of predicting or estimating your AWS spending based on past and present data. But it can also be based on new organizational initiatives and the workloads they entail to help launch a product or service for your enterprise. If you can plan your costs ahead of time and communicate these estimated but expected charges to the appropriate stakeholders, then you’re less likely to be surprised by a sudden spike in charges and questioned by leadership.
However, because these are just estimates, the actual values may deviate significantly from your expectations. These are called prediction intervals. If a prediction interval is high, the forecast will most likely have a wider range. Let’s say you expect your next month’s total AWS spending to be $100. An 80% prediction interval might say that 80% of the time, the actual AWS spend will be somewhere between $90 to $110. In other words, 20% of the time, your actual AWS spending will not be between $90 to $110.
Cost Explorer has a native forecasting function built into its user interface and provides an 80% prediction interval for forecasts. You can use this forecast to explore what your AWS costs will be based on your historical usage. You can see Cost Explorer’s forecasting in the following screenshot. Based on the daily costs, Cost Explorer provides an 80% prediction interval for the next 18 days:

Figure 11.14 – Cost Explorer forecast
You can observe that the prediction intervals increase farther away from the current and past data. This is because the range of the prediction interval is dependent on your historical spend volatility. If you have more consistent usage (for example, steady-state workloads), Cost Explorer will show narrower prediction ranges.
Cost Explorer’s limitation is that it cannot provide forecasts when your charts are grouped by a selected dimension. For example, you will not be able to see forecasts by account ID or AWS service name. These forecasts are only available in an aggregate view. You can, however, see forecasts for individual accounts if you access an individual account’s Cost Explorer. However, this view is unavailable at the payer or management account level.
Also, Cost Explorer only provides data for the last 12 months. That is, your historical cost and usage, as well as the forecasts, are only based on the past trailing 12 months. If you’ve been working with AWS for 2 years already, the first year of cost and usage data is not included in Cost Explorer’s features. If having the complete cost and usage historical data is important, then AWS CUR is a better alternative, assuming you activated CUR when you first started with AWS.
Let’s assume you do have cost and usage data for your entire AWS journey, and that you want to develop forecasts based on your full cost and usage data. What can you do? You can leverage Amazon Forecast, an ML service that delivers highly accurate time-series forecasts. We’ll turn our attention to this next.
Forecasting cost and usage with Amazon Forecast
Amazon Forecast is best suited for time-series data. Time-series data is data collected over a period that shows changes over time. This is well suited for CUR data since AWS collects your cost and usage data with a daily time interval. Amazon Forecast expects your data to have a timestamp field that aligns with the CUR schema since the cost and usage line-item column has this format already.
Important note
Amazon Forecast has costs associated with its usage. Strongly consider whether using an artificial intelligence (AI)-based service is worth the investment since ML-related costs tend to be more expensive than storage, compute, and networking hourly costs. I present this solution as an option but it may not be suitable for everyone.
To get started, access the Amazon Forecast console page and create a dataset group. This is the first step since you need to define what your time-series data will be for forecasting. Provide a name for the dataset group, as shown in the following screenshot:

Figure 11.15 – Creating an Amazon Forecast dataset group
You need to create a target time-series dataset by specifying the dataset name and data frequency. In the following screenshot, we are selecting a 1-day frequency since CUR was activated daily:

Figure 11.16 – Dataset name and frequency
You can also define the data schema to help Amazon Forecast become aware of our data types. The timestamp format is required. The following screenshot shows it set in the yyyy-MM-dd format. You can add other attribute names such as account ID, AWS service name, or even application tags. This allows you to specify if your forecasts reflect a certain dimension. Recall from the previous section that Cost Explorer is unable to forecast using a group-by view. To overcome this limitation, you can specify different attribute names as dimensions for your Amazon Forecast predictions to provide a more customized view:

Figure 11.17 – Dataset schema and attributes
After you go through the steps and import the dataset group, Forecast will create the dataset group and alert you when the import is active. The next step is to train a predictor with your data.
You provide your predictor a name and specify a forecast horizon. This number tells Amazon Forecast how far into the future to predict your data at the specified forecast frequency. You can also choose an algorithm for your time-series forecast. If you are unsure, choose the AutoML option when creating a predictor and let Forecast select the optimal algorithm for your datasets, which automatically trains a model, provides accuracy metrics, and generates forecasts. You can also add a forecast dimension of account_id. This will allow Forecast to predict cost by account ID. If you’d like to be able to forecast on other dimensions, you can add them here. The following screenshot documents these steps:

Figure 11.18 – Training an Amazon Forecast predictor
Amazon Forecast will begin training the optimal ML model on your dataset. This could take up to an hour to complete. You can check on the training status under Predictors. You can generate a forecast once the predictor training shows as Active.
When you generate a prediction, you must give the prediction a name. But first, you must choose the predictor that we created in the previous section. Then, you can enter up to five quantile values and specify the forecast type. Once you’re ready, you can request Amazon Forecast to create a new forecast, as shown in the following screenshot:

Figure 11.19 – Creating a forecast
The forecast will display as Active when complete. You can create a forecast lookup by specifying the generated forecast, the start/end date, and the service name. The following screenshot shows this as an example where I request a forecast for my Amazon RDS spending:

Figure 11.20 – Generating predictions
Amazon Forecast returns various prediction interval bounds, as shown in the following screenshot. Depending on your use case, you may choose narrower or broader intervals:

Figure 11.21 – Creating predictions for Amazon RDS cost
Amazon Forecast provides a way for you to create ML-based predictions without having to build complex ML workflows. You can simply point to your CUR data, specify the types of predictions for the dimensions you want, and then have AWS manage the model training and building to get the results you need.
In this section, we looked at how AWS provides native tools to easily visualize your cost and usage data. We also saw how services such as Cost Explorer and Forecast can help track your AWS spending into the future with ML-based forecasts. In the final section, you will leverage AWS Trusted Advisor to monitor your costs and optimization opportunities regularly.
Automating cost optimization within operations
AWS Trusted Advisor is a management tool that provides visibility into your AWS accounts to see how well they are adhering to best practices across five categories – cost optimization, performance, security, fault tolerance, and service limits. We will stay within the bounds of cost optimization since that is the focus of our discussion.
Important note
Trusted Advisor requires you to engage in Business- or Enterprise-level support, the latter of which can cost you $15,000 (USD) per month. However, for some organizations, the benefits of having elevated support and response times may outweigh these financial costs. Be sure to gauge what the right level of support is for your organization.
Trusted Advisor provides recommendations for ways to help reduce costs for your AWS accounts. These can be recommendations to delete unused and idle resources or to use reserved capacity. The following screenshot shows the Cost optimization dashboard view of Trusted Advisor with action and investigation recommendations, in addition to problem detection:

Figure 11.22 – Trusted Advisor Cost optimization dashboard
You can use Trusted Advisor to inform you about the numerous cost optimization strategies we covered in Part 2 of this book. For example, Trusted Advisor will recommend that you reserve additional Amazon EC2 instances or purchase additional Savings Plans to increase your coverage of discounted rates for steady-state workloads based on your usage history (see Chapter 6, Optimizing Compute). Trust Advisor will also recommend reserving database instances such as Amazon RDS or Amazon Redshift, or decreasing the size of Amazon EBS when it detects over-provisioned volumes (see Chapter 7, Optimizing Storage). But Trusted Advisor can also provide insights into topics that we haven’t covered, such as deleting Amazon Comprehend’s under-utilized endpoints or checking for Amazon Route 53 latency record sets that are configured inefficiently.
Amazon Comprehend and Amazon Route 53
Amazon Comprehend is an AI service that allows you to use natural language processing (NLP) on text documents to extract keywords, phrases, topics, and sentiments without having to manage your ML infrastructure. A Comprehend endpoint provides real-time inference abilities for NLP workloads.
Amazon Route 53 is a Domain Name System (DNS) web service that you can use to route users to both internal and external applications.
You can see a sample of the various checks that Trusted Advisor provides in the following screenshot:

Figure 11.23 – Trusted Advisor cost optimization checks
Trusted Advisor can help you get a high-level overview of cost implications for individual accounts and accounts across your entire AWS organization. This tool is well suited for centralized FinOps teams because, especially for large organizations, it’s difficult for a centralized FinOps team to have resource-level granularity within each account. It’s easier to manage costs by starting broadly using checks such as the ones Trusted Advisor provides, and then diving deeper into the specifics once you have identified a critical finding.
Trusted Advisor helps report on and directs you to cost optimization recommendations. However, you can also integrate it with other services such as AWS Systems Manager (SM). With SM, you can build and customize operations dashboards that provide an aggregated view of operations data (OpsData) for your AWS resources across your accounts and regions. You can integrate Trusted Advisor with the SM Explorer view to report on AWS Compute Optimizer, for example, to see where you can improve your efficiency in using Amazon EC2 instances. We’ll look at how to do this in the next section.
Integrating Trusted Advisor with other AWS services
Trusted Advisor is one of many tools that you can use to monitor costs across your accounts. At the beginning of this chapter, we established that tools alone aren’t enough to leverage the long-term benefits of cost optimization. You need people and processes as well. In this case, the people involved are folks that constitute a centralized FinOps team. The process that we’ll outline here involves integrating Trusted Advisor with SM to provide a comprehensive view of cost optimization checks across your AWS Organization.
The first thing you’ll want to do is enable SM Explorer. You can create a customizable operations dashboard using SM Explorer to report on information about your AWS resources. This is helpful for a centralized FinOps function that requires a pan-account resource view to find opportunities to optimize. Although SM Explorer isn’t limited to only viewing cost-related components of your cloud infrastructure, we’ll see how we can use it to specifically focus on a cost view.
You can access SM Explorer through the AWS Management Console for a dashboard view. You can enable Explorer by completing the Explorer Setup section. Once you have enabled Explorer, you can create a resource data sync by providing a data sync name and choosing which accounts and regions to sync resource use for, as shown in the following screenshot. Resource data sync centralizes OpsData from your AWS accounts to provide you with an aggregated view through SM Explorer:

Figure 11.24 – SM Explorer data sync
Once you have created a data sync, you can configure your Explorer dashboard to configure OpsData sources. In the following screenshot, we are selecting the cost savings category and enabling the three OpsData sources to embed in our SM Explorer dashboard:

Figure 11.25 – SM Explorer OpsData dashboard configuration
When the data sync is complete, you’ll be able to see Trusted Advisor checks on the Explorer page. Here, you can view a summary of all checks from different AWS accounts and regions. You can even view by AWS account ID:

Figure 11.26 – Trusted Advisor checks on SM Explorer
You can apply filters to search for specific items. For example, you can use the AWS:TrustedAdvisor.ResourceCategory: Equal: Cost Optimization filter to create a report on cost optimization, as shown in the following screenshot:
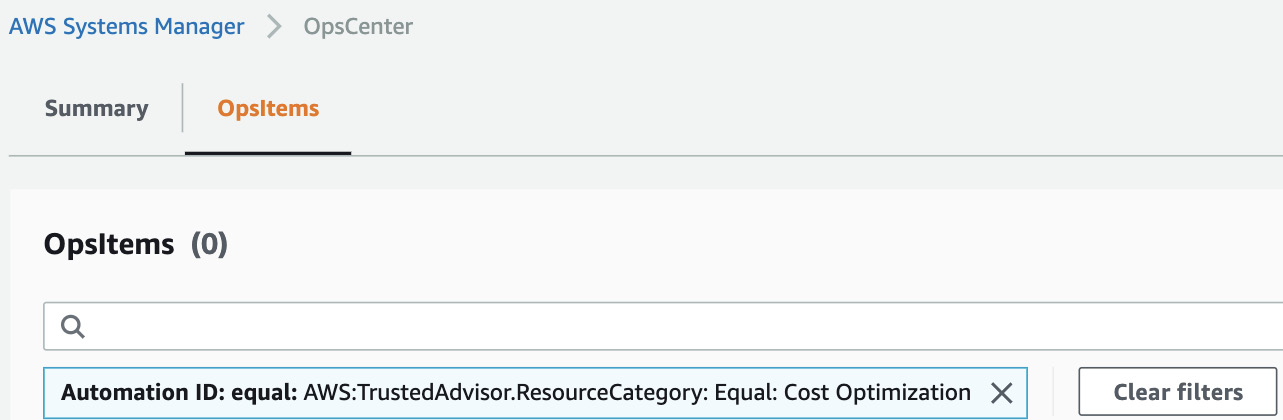
Figure 11.27 – OpsData filter showing Trusted Advisor recommendations
The filter allows you to access Trusted Advisor recommendations through the SM Explorer dashboard. This can help streamline managing OpsData as well as cost optimization findings in a single pane of glass. SM Explorer is meant to serve as a central platform for operations teams who can partner with a centralized FinOps to manage cost and resource usage across the organization.
Summary
In this chapter, we learned how to make the most out of AWS CUR by extracting insights using AWS analytics tools. We also learned about the enterprise-scale dashboards you can use as frameworks to provide cost and usage visibility for your business. You can partner analytics services such as Athena and QuickSight with CloudFormation as an IaC tool to create self-service deployments for teams to understand their costs.
We also learned about using the predictive capabilities of AWS Cost Explorer and Amazon Forecast to plan ahead. Although these estimates are subject to some prediction error, having some foresight usually bodes well compared to not knowing what the future entails at all. Planning helps to build trust within the organization and helps you prepare for unexpected cost and usage spikes.
Lastly, we saw how you can integrate Trusted Advisor with Systems Manager to operationalize your optimization efforts for your entire enterprise. This will help your central FinOps team look for optimization efforts across your organization.
In the next and final chapter, we’ll focus on the ancillary efforts of FinOps teams such as messaging, communication, and workload reviews to support cost savings efforts for your business.
Further reading
To learn more about the topics that were covered in this chapter, take a look at the following resources:
- Enterprise Dashboards: https://wellarchitectedlabs.com/Cost/200_Enterprise_Dashboards/Cost_Intelligence_Dashboard_ReadMe.pdf
- Cloud Intelligence Dashboards Workshops: https://catalog.us-east-1.prod.workshops.aws/workshops/fd889151-38aa-4fe2-a29d-d5fa557197bb/en-US
- AWS CUDOS Framework Deployment: https://github.com/aws-samples/aws-cudos-framework-deployment/
- What is AWS CloudShell?: https://docs.aws.amazon.com/cloudshell/latest/userguide/welcome.html
- Managed Spot Training: Save Up to 90% On Your Amazon SageMaker Training Jobs: https://aws.amazon.com/blogs/aws/managed-spot-training-save-up-to-90-on-your-amazon-sagemaker-training-jobs/
- Forecasting with Cost Explorer, 2022: https://docs.aws.amazon.com/cost-management/latest/userguide/ce-forecast.html