It is important to understand the nature of leases and how companies account for them, because the accounting choices related to leases can dramatically change the amounts of their long-term assets and long-term liabilities. For instance, Whole Foods Market, Inc. (ticker WFM), a retailer of natural and organic food, has substantial leases that are not included on its Balance Sheet. Had these leases been included on its Balance Sheet, the firm’s total assets would almost double and thereby dramatically lower the firm’s return on assets. It would also more than double the firm’s apparent financing from debt and make the firm appear much riskier.1 The different types of leases and how the accounting for them affects financial statements will be explained in detail in this chapter.
What is a Lease?
A lease is an agreement (contract) conveying the right to use a specified asset for a stated period of time in exchange for some form of payment (normally a specified stream of future cash payments). The owner of the property is referred to as the lessor, and the renter is the lessee. You may already be familiar with an apartment or car lease.
For corporations, there are many operational and financial reasons to lease (i.e., rent) an asset rather than own it.
From an operational viewpoint, if an asset is truly only needed for a short period of time, it may be cheaper and easier to rent the asset than it would be to purchase it and then resell it. As an extreme example, compare the cost and convenience of renting a car for a few days with purchasing the vehicle and then reselling it a few days later.
The financial advantages of a lease accrue when leases cover longer periods of time. These include lower interest rates, tax advantages, and greater flexibility in tailoring payments to match the revenues generated from the asset. Importantly, properly structured leases may be “off-Balance Sheet,” which helps the firm to avoid any debt-covenant restrictions it might have and also provides the illusion of a safer financial structure.
Leases often have lower implicit interest rates than borrowing funds. This is true if (1) the lessor is also the manufacturer or vendor of the asset being leased and (2) the lessor provides a lower borrowing rate to the lessee as an inducement to undertake the lease. Alternatively, the lessor can provide a lower rate because of a lower cost of recovering the asset in the case of default (i.e., because the lessor, while not in possession of the asset, retains legal title to the asset). In contrast, when a firm borrows funds to purchase an asset using the asset as collateral, the lender is likely to incur more costly and lengthy legal proceedings to obtain the collateral (which it does not legally own) in the case of default.
The tax advantages of a lease stem from accelerated depreciation and interest expenses. If structured properly (which normally requires the lessor and the lessee being in different tax districts—often different countries), both the lessor and the lessee can use leases to obtain greater tax deductions in the early years of the lease, which allows for a deferral of taxes. Proper tax planning, which is beyond the scope of this book, is often a major advantage of a lease.
Leases may provide both firms with greater flexibility in payment terms than is possible when assets are purchased with bank or bond financing. Banks and bond markets rarely deviate from standard contractual formulas, where interest is paid periodically over the life of the loan and where the principal is repaid at the end of the loan. Occasionally, early balloon repayments of part of the principal are included in the contracts. In contrast, the standard lease contract is structured similarly to a mortgage, with equal periodic payments over the life of the lease—and no final repayment. However, lease payments more frequently include deviations from the standard form and so provide greater flexibility to both the lessor and lessee.
Finally, firms are sometimes able to enter into long-term leases without recognizing an asset or financial liability. If its leases are properly structured, firms are only required to disclose the long-term lease in the Notes to the Financial Statements and not on the Balance Sheet itself.
How can firms have long-term leases that are “off-Balance Sheet” in this way? Assets are defined as resources that a firm owns or controls. Liabilities are defined as future sacrifices of cash or services. A short-term lease fails to fit either definition. The firm does not own the asset and, as it only has possession for a short period of time, it also does not control the asset. Furthermore, if lease payments are made over the term of the lease, and if the lease is for a short period of time, at most, a fraction of the lease payments will be owed at year-end. For this reason, it makes sense that short-term leases are never recorded as assets and liabilities. The same is not true for long-term leases: even though the firm does not own the asset, it may control the asset for much of its useful life. The question then is: where to draw the line of when a lease should be on or off the Balance Sheet?
U.S. Generally Accepted Accounting Principles (GAAP) has established a set of hard-and-fast rules as to which leases should not appear on the Balance Sheet (called “operating leases”) and which should (we will use the term “capital leases,” though some people call them “financing leases” or “financial leases”). Under Accounting Standards Codification Topic 840 (ASC 840), a lease is considered an operating lease if none of the following conditions is met and a capital lease if any one of the following conditions is met:
• There is essential transfer of ownership at the end of lease term.
• There is a bargain purchase option (BPO) with a payment well below market value after the lease term.
• The present value of lease payments (including any BPO) is at least 90 percent of the asset’s market value.
• The lease term is 75 percent or more of the asset’s remaining useful life.
Thus, to avoid listing lease-related assets and liabilities on its Balance Sheet a firm must ensure the lease:
• Does not transfer ownership at the end of the lease, whether automatically or through a BPO.
• The present value of the lease payments is less than 90 percent of the asset’s market value.
• The lease term, with any renewal periods at below market rates, is less than 75 percent of the asset’s remaining economic life at the time of the lease.
The accounting for capital leases initially includes the lease as both an asset (“Leasehold—name of the asset”) and liability (“Leasehold Obligation—name of the liability”). The value would be the net present value (NPV) of all future lease payments, discounted at the firm’s marginal cost of capital. Then the asset would be depreciated over the life of the lease using the firm’s choice of depreciation methods, and the liability would be treated as debt (with payments broken down between interest and repayment of capital as explained below).2 Thus, the asset and liability amounts have to be the same at the inception of the lease but after that are different.
A helpful feature for readers of financial reports of U.S. GAAP regarding operating and capital leases is the requirement that minimum future lease payments for both operating and capital leases be disclosed in footnotes. This allows an outside analyst to determine the extent of a firm’s operating leases and adjust the financial statements to reflect the operating leases as assets and liabilities.
The Financial Accounting Standards Board (FASB), which determines U.S. GAAP, in cooperation with the International Accounting Standards Board (IASB), which determines International Financial Reporting Standards (IFRSs), issued a revision to accounting for leases (ASC 842) in February 2016. The new rules will allow leases of 12 months or less to be treated as operating leases and not included as an asset and liability. Leases longer than 12 months will be subject to a similar evaluation as under current rules but be more of a “principles” based test (following the IFRS approach without the clear dividing lines noted above). The term “capital lease” will be changed to “finance lease” (the term currently used by IFRS). The new rules define a finance lease as one where:
• There is a transfer ownership at the end of the lease, whether automatically or through a BPO.
• The lease term, with any renewal periods at below market rates, is for a major part of the asset’s remaining economic life at the time of the lease.
• The present value of the lease payments equals or exceeds substantially all of the fair value of the asset’s underlying value.
• The asset is of a specialized nature and not expected to have any alternative use at the end of the lease term.
Under the new rules, most leases will be included as an asset and liability on the Balance Sheet. The Securities and Exchange Commission (SEC) estimates that roughly $2 trillion will be added to U.S. corporations’ Balance Sheets.
There are some additional differences, principally certain costs paid by the lessor and billed to the lessee (called pass-through costs) are to be included in the capitalized costs. The new standards apply for public firms with fiscal years beginning after December 15, 2018 (privately held firms can delay until fiscal years beginning after December 15, 2019). Firms will be required to restate comparative prior years provided in their annual reports.
We will now use the example of WFM to illustrate both the importance of understanding how leases can impact the numbers that companies report in their financial statements as well as how the concept of NPV can be used to adjust the management’s accounting choice. The “old” lease rules are being used (as opposed to the “new” rules) because these remain the required accounting treatment until January 1, 2019.
Whole Food Market, Inc. (WFM)3
WFM claims to be the world’s leading retailer of natural and organic foods and America’s first national “Certified Organic” grocer. The company’s mission is to promote the vitality and well-being of all individuals by supplying the highest quality and most wholesome foods available. The firm’s stated core mission is the promotion of organically grown foods, healthy eating, and the sustainability of its entire ecosystem. Through its growth, WFM claims to have had a significant and positive impact on the natural and organic foods movement throughout the United States, helping lead the industry to nationwide acceptance over the last 37 years.
WFM has one operating segment: natural and organic foods supermarkets. It states that it is the largest retailer of natural and organic foods in the United States and the fifth largest public food retailer overall based on 2014 sales rankings from Progressive Grocer.
As of September 27, 2015, WFM operated 431 stores (an 8 percent increase from 2014) in the United States, Canada, and the United Kingdom, with an average of 39,000 sq ft in size and 8 million weekly customer visits. WFM also operates seafood processing and distribution facilities, a specialty coffee and tea procurement and roasting operation, regional distribution centers as well as commissary kitchens and bake-house facilities.
The company’s average weekly sales and gross profit as a percentage of sales are typically highest in the second and third fiscal quarters and lowest in the fourth fiscal quarter due to seasonally slower sales during the summer months. Gross profit as a percentage of sales is also lower in the first fiscal quarter due to the product mix of holiday sales. For this reason, results in any given quarter are not necessarily indicative of the results that may be achieved in other quarters or in the full fiscal year.
The stock price of WFM soared from its initial public offering (IPO) in 1991 at just under $3.00 to a high of just under $40 at the end of 2005.4 It then plunged to a low of $4.34 on December 1, 2008 (during the financial crisis), before skyrocketing to $65.29 on October 25, 2013. The firm’s stock then fell from a high of $57.57 on February 16, 2015 to a low of $28.07 on February 3, 2016 and was $30.48 on July 29, 2016 (when this chapter was written).
Ernst & Young provided WFM with an unqualified (e.g., clean) audit report with no mention of leases or any other accounting issue. Exhibit 3.1 provides WFM’s Consolidated Income Statements for the period 2013–2015 and Balance Sheets for 2014 and 2015. As shown in the exhibit, WFM’s sales growth slowed from 9.9 percent in 2014 to 8.4 percent in 2015 but remained well above the U.S. Gross Domestic Product (GDP). However, the firm did experience a decline in gross profit margin from 35.8 percent in 2013 to 35.2 percent in 2015 and a decline in net profit margin from 4.3 percent in 2013 to 3.5 percent in 2015.
The firm’s total liabilities in 2015 represent 34.3 percent of total financing ($1.97 billion/$5.74 billion) up slightly from the 33.6 percent of total financing ($1.93 billion/$5.74 billion) level in 2014 but still a fairly low level of debt compared to other grocery companies. In addition, the firm appears to have virtually no interest-bearing debt, so would have a finance debt ratio (interest-bearing debt/(interest-bearing debt + equity)) of zero. Thus, WFM appears to be a very low-risk firm that is growing nicely with good (albeit declining) margins.


Exhibit 3.2 contains selected Notes to the Financial Statements, which reveal a substantial amount of operating leases. As will be shown, computing the NPV of these leases and adding them to the Balance Sheet dramatically changes the perceived level of WFM’s risk.
Exhibit 3.2 Whole Foods Market, Inc. Selected Financial Statements Notes
Property and Equipment
The Company provides depreciation of equipment over the estimated useful lives (generally 3–15 years) using the straight-line method, and provides amortization of leasehold improvements and real estate assets under capital leases on a straight-line basis over the shorter of the estimated useful lives of the improvements or the expected terms of the related leases. The Company provides depreciation of buildings over the estimated useful lives (generally 20–50 years) using the straight-line method.
Leases
The Company generally leases stores, nonretail facilities, and administrative offices under operating leases. We recognize rent on a straight-line basis over the expected term of the lease.
The Company is committed under certain capital leases for rental of certain buildings, land and equipment, and certain operating leases for rental of facilities and equipment. These leases expire or become subject to renewal clauses at various dates from 2015 to 2054. The Company had capital lease obligations totaling approximately $65 million and $62 million at September 27, 2015, and September 28, 2014, respectively.
Rental expense charged to operations under operating leases for fiscal years 2015, 2014, and 2013 totaled approximately $441 million, $407 million, and $374 million, respectively, which included contingent rentals totaling approximately $14 million, $13 million, and $13 million during those same periods. Sublease rental income was not material during fiscal year 2015, 2014, or 2013.
Minimum rental commitments and sublease rental income required by all noncancelable leases are approximately as follows (millions):
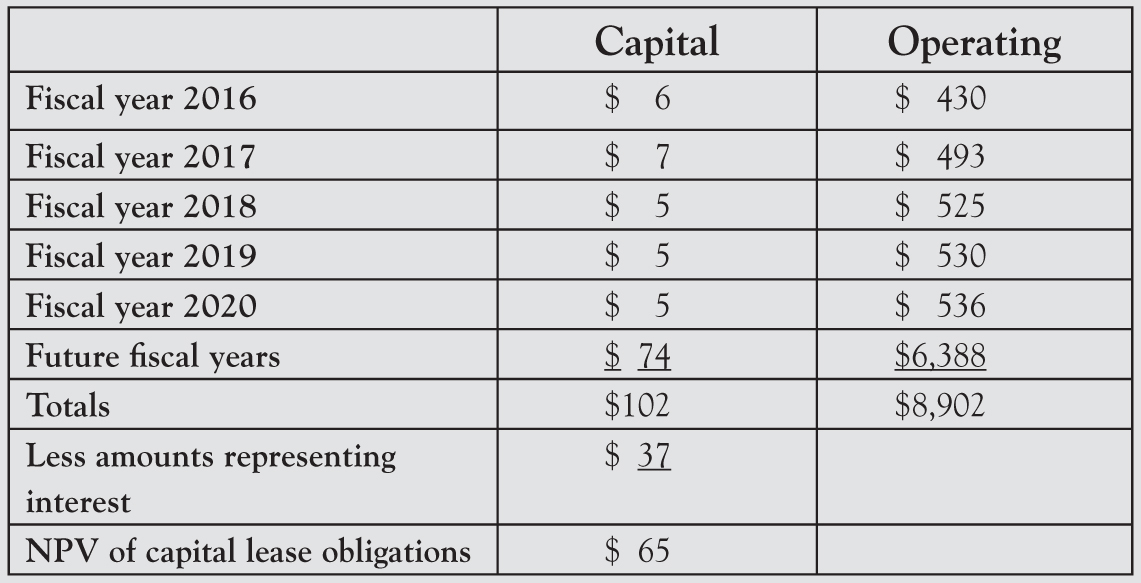
The present values of future minimum obligations for capital leases shown above are calculated based on interest rates determined at the inception of the lease or upon acquisition of the original lease [if the lease is purchased from another firm].
Converting Operating Leases to Capital Leases
The capital leases are already included in the Balance Sheet. The interesting issue is to examine the impact of including the operating leases in the Balance Sheet as well. This is done to better understand the true economic financial structure of the firm. It is done by adding the operating leases onto the Balance Sheet as if they were capital leases. There are three steps to “converting” an operating lease into a capital lease (the process is called “capitalizing operating leases”):
1. Compute the NPV of the operating leases.
2. Increase the assets (e.g., PP&E) and the liabilities (i.e., debt).
3. Adjust the Income Statement by removing the rent expense (the current year’s operating lease payment), and adding depreciation expense, and interest expense (to reflect the treatment of a capital lease).
To compute the NPV of a lease requires a set of future cash flows (the cash payments each year and when they occur during the year) and a discount rate. The Notes to the Financial Statements provide details of the annual rental payments for each of the next five years and then an aggregate amount for all years thereafter. An estimate must be made regarding the pattern of the future cash flows that will occur in the sixth year onwards. The cash flows could be constant or follow some pattern (increasing, decreasing, or changing). The estimate is up to the analyst doing the computation, who will make a decision based on his or her subjective assessment.
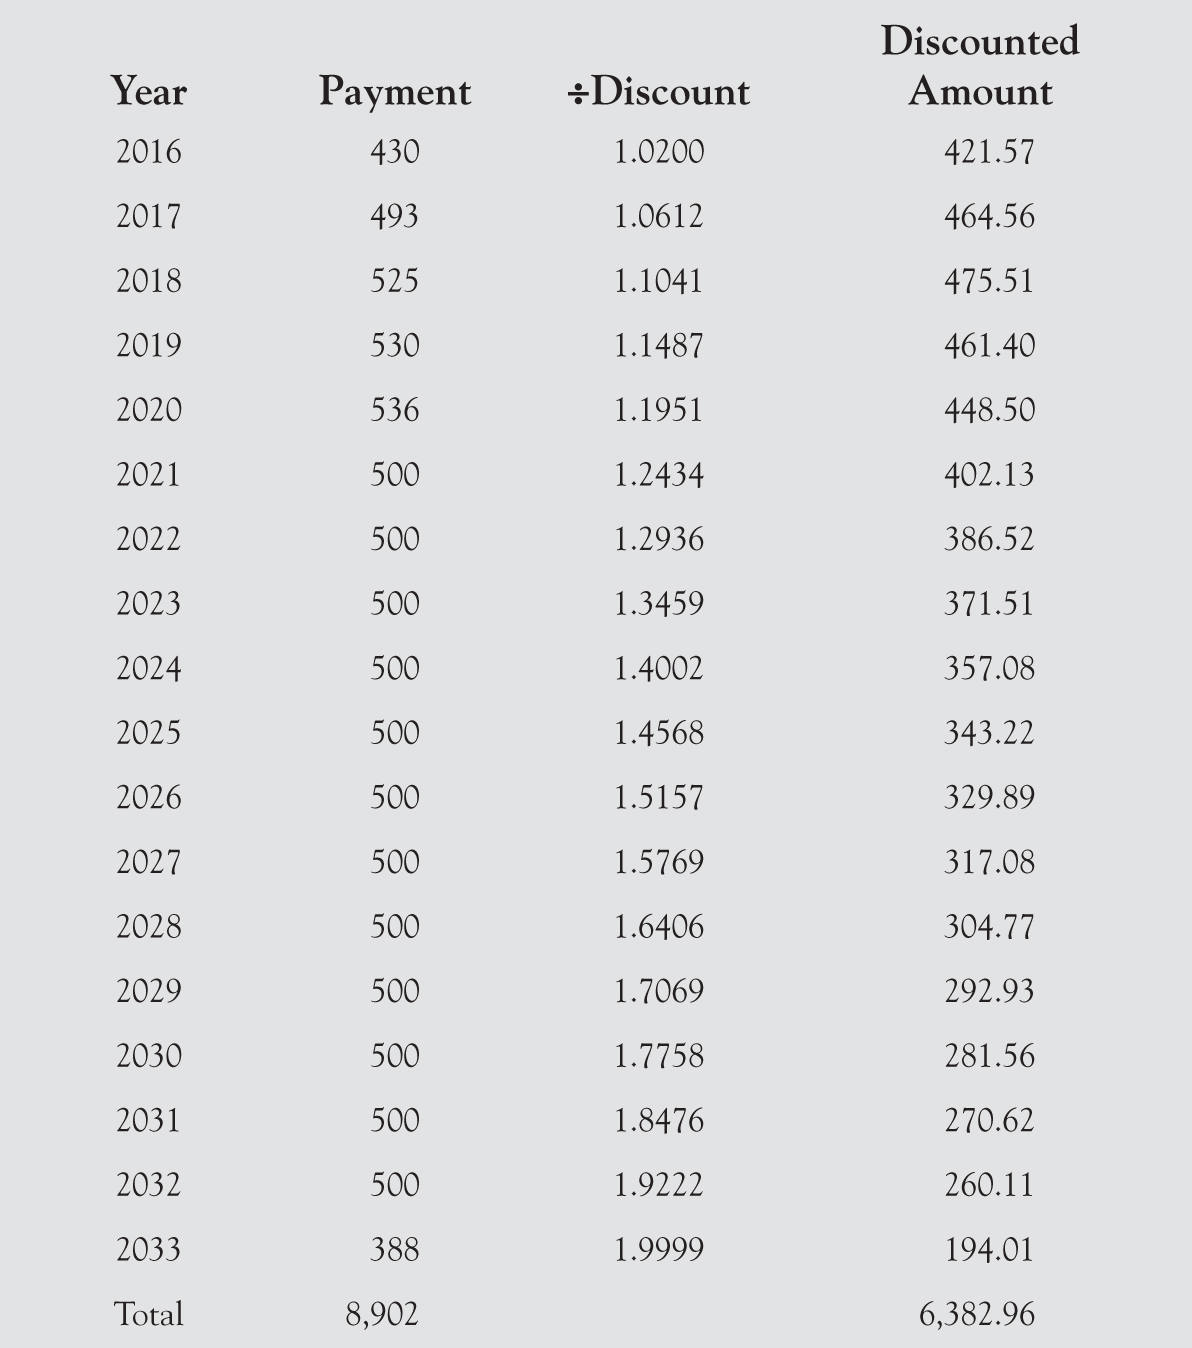
In the case of WFM, the annual cash flow amounts from 2016 to 2020 are $430 million, $493 million, $525 million, $530 million, and $536 million, with a total of $6,388 million from 2021 to 2054. There are numerous possibilities for estimating the annual cash flows after 2020. For instance, one possible solution would be to use $500 million for years 2020 to 2031, with the balance of $388 million in 2032 (12 years at $500 million plus $388 million equals the $6,388 million). Another would be to start at $536 million in 2010 and reduce the amount by say $20 million a year ($516 in 2021, $156 million in 2039, and a final payment of $4 million in 2040). There are numerous subjective possibilities. For this illustration, we will use the former.
Next, the payments could be spread monthly, made half way through the year, or (for simplicity in the analysis) done at the end of the year. In this example, our simplifying assumption is that the payment is made once a year, halfway through the year.
Finally, a discount rate is required. This should be the rate the firm would have to pay on the incremental secured debt. It is neither the rate on the current debt nor the rate on a small amount of additional debt. Why not? First, if the lease is adding a significant amount of debt, then it will be at a much higher rate than other debt. However, this is counterbalanced by the fact that a lease is actually lower risk than secured debt because the leaseholder (the lender) maintains title to the asset.
Exhibit 3.3 provides the computations for WFM using a 4 percent semiannual (4.04 percent annual percentage yield - APY) interest rate (which seems reasonable given the 10-year U.S. Treasury debt [representing the “risk-free rate”] was hovering around 2 percent in 2015 and Whole Foods had no other interest paying debt and sold food). Assuming that rental payments occur halfway through each year means the first payment is discounted for six months at 2 percent (meaning it is divided by 1.021), the second payment is discounted for 18 months (divided by 1.023), the third payment is discounted for 30 months (divided by 1.025), and so on. The NPV is approximately $6.38 billion.5 This is the amount to the end of Whole Foods fiscal year-end September 27, 2015. The unadjusted debt-to-asset ratio at the end of fiscal 2015 is 34.3 percent (using total liabilities of $1.97 billion/total assets of $5.74 billion). The adjusted debt-to-asset ratio (i.e., after including operating leases as though they were capital leases) is 68.9 percent (($1.97 billion + $6.38 billion/($5.74 billion + $6.38 billion)). This is quite a difference and is likely to cause an analyst to view the firm as significantly riskier.
Exhibit 3.3 NPV of operating leases ($ millions)
To adjust the Income Statement requires a five-step process:
1. Repeat the above computation using the numbers at the end of the prior year (i.e., 2014) to obtain an adjustment for the opening balance. This would have provided a NPV of $5.99 billion for WFM at the start of fiscal 2015.
2. Add back (increase profit before tax) by the operating rent for the year. This was $441 million for WFM in fiscal 2015.
3. Remove (reduce profit before tax) for the depreciation for the year based on the adjusted opening balance. Assuming a 10-year period for depreciation (WFM using straight-line depreciation over 3–15 years) results in added depreciation expense of $600 million.
4. Remove (reduce profit before tax) for the interest expense based on the adjusted opening balance. A 4 percent compounded semiannual interest rate on $5.99 billion is $242 million ($5.99 billion × 4.04 percent).
5. Combine items (2), (3), and (4) and adjust for taxes. The net of the items is a decrease in profits before tax of $401 million (plus $441 million in rent less $600 million in depreciation expense less $242 million in interest expense). WFM’s tax rate averages 40 percent over the last four years. Thus, tax expense would decrease by $160 million ($401 million × 40 percent) and net income would decrease by $241 million (−$401 million + $160 million) from $536 million to $295 million. Net income plus after tax interest declines from $741 million ($536 + $342 × (1 – 0.40)) to $645 million ($295 + ($342 + $242) × (1 – 0.40)).
The Balance Sheet impact on opening total assets is a $5. 99 billion increase from $5.74 billion to $11.63 billion. Opening retained earnings does not change unless a more detailed calculation is done adjusted prior year profits as well.
The impact of these changes on profitability is to reduce return on assets (net income plus after tax interest/opening total assets) from 12.9 percent ($741 million/$5.74 billion) to 5.5 percent ($645 million/$11.63 billion). Return on equity (net income/owners’ equity) will decrease, from 14.1 percent ($536 million/$3.80 billion) to 7.8 percent ($295 million/$3.80 billion).6
As can be seen from the above, making the adjustment of adding the operating leases onto the financial statements can radically change the apparent risk and profitability of a firm, as it does for WFM.
Sale and Leasebacks
A sale and leaseback is a transaction where a firm sells a long-term asset and then enters into a rental (lease) agreement to use the asset. This allows the firm to obtain cash while continuing to use an asset. The benefit to the lessor is essentially an enhanced version of a secured loan. The enhancement comes from the fact that the lender actually owns the property and so, in the event of bankruptcy, usually has an easier time repossessing the asset.
The benefit to the lessee is that the firm obtains cash and, if properly structured as an operating lease, does so without increasing debt.7 The cash can be used for operations, to purchase other assets, or to pay down debt. In the case of the latter, the sale and leaseback normally improves the firm’s leverage ratio, which makes the firm look less risky and may help the firm avoid violating a covenant. The asset is also often sold at a value above its carrying (accounting “book” value) which means the firm will record a profit on the sale.
Sale and leasebacks are often used when firms have few alternative financing options both to raise funds (lenders want the added protection of technically owning the asset) and as they help hide the true depth of a firm’s financial problems. To explain, assume a firm is facing financial difficulties and lenders are willing to only lend at rates that would make the firm’s financial distress obvious to outsiders (e.g., an interest rate of prime plus 10 percent). A sale and leaseback could be constructed with rental payments that affect the same return to the lender. However, as shown above, the operating lease payments are disclosed in a footnote as totals for all operating leases with no information on the implicit interest rate being provided. Thus, sale and leaseback transactions are used to increase liquidity, improve leverage ratios, avoid violating covenants, and obfuscate the cost of additional borrowing.
The Bottom Line
A key goal for many organizations is to keep debt off their Balance Sheets to reduce the firm’s apparent level of risk and increase the firm’s apparent return on assets. How can organizations manage this feat (e.g., keep debt off their Balance Sheets)? Operating leases allow a firm to gain assets without the appearance of increased debt and resources. As shown in the WFM example, keeping assets and debt off the Balance Sheet makes a firm look safer and more profitable (per dollar of asset). However, analysts can still properly evaluate a firm by adding the assets and debt into the Balance Sheet using the Notes to the Financial Statements.
There are many valid reasons for firms to engage in leases. Currently, the rules for when the leases must be included on a Balance Sheet are whether they meet any one of the following (in which case they are called capital leases):
• There is an essential transfer of ownership at the end of lease term.
• There is a BPO with a payment well below market value after the lease term.
• The present value of lease payments (including any BPO) is at least 90 percent of the asset’s market value.
• The lease term is 75 percent or more of the asset’s remaining useful life.
Management can usually structure leases to avoid meeting one of the above. However, the information on operating leases provided in the Notes to the Financial Statement allow an analyst to adjust the statements by estimating an asset and debt value that accounts for these leases in the financial statement numbers. The importance of this adjustment cannot be overstated, and it is one of the more straightforward adjustments an outsider can make.
The next chapter describes how firms account for deferred benefits, in particular health care and pensions.
_________________
1As explained below, including all its leases in the financial statements causes WFM’s leverage ratio (a measure or risk, the higher the ratio the greater the risk of bankruptcy) to more than double while the firm’s calculated returns (its ability to provide returns on resources) plummet. A detailed discussion of ratios is provided in Chapter 6.
2The depreciation should match that of similar purchased assets.
3The information is adapted and/or copied directly from the firm’s 2015 10K report.
4All stock prices are adjusted for the firm’s four 2/1 stock splits (November 9, 1993; June 4, 2001; December 27, 2005; and May 17, 2013).
5The NPV drops to $5.50 billion at a discount rate of 6 percent compounded semiannually.
6The ratios would change using year-end or average numbers for total assets and owners’ equity.
7This accounting benefit is lost if the transaction is classified as a capital lease.