This chapter covers five advanced accounting topics: accounting for earnings per share (EPS) and the price–earnings ratio, foreign currency translations, comprehensive income, fair value accounting, and how to adjust from last-in-first-out (LIFO) to first-in-first-out (FIFO). Although the discussion included is brief (each topic normally has at least a full chapter in an advanced accounting textbook written for accountants), it is meant to provide the reader with a basic understanding of how accountants treat each topic and how they should be interpreted.
Earnings per Share and the Price–Earnings Ratio
EPS is a very important ratio that shows the earnings per ownership unit. This number is so important that it is part of the financial statements, is usually included on the Income Statement, and is audited.1 The calculation can be somewhat complex, but conceptually it is the net income divided by the weighted-average number of shares outstanding (the number of shares held by the owners) for the year. This means the denominator is a daily average. The weighted average is used for the number of shares in order to keep the firm from manipulating EPS by buying back or issuing shares at the end of the year. For example, assume a firm earns $10 million, has 1 million shares outstanding at the start of the year, and has 600,000 shares outstanding at the end of the year after buying back 400,000 shares on the last day of the year. If the calculation was done using a simple average of the number of shares, EPS would be $12.50 ($10 million/800,000). However, if a weighted average is used as required for the financial statements, EPS would be reported as $10.01 ($10 million/998,904). To calculate the weighted average, the shares outstanding each day of the year are added up and divided by 365 (or if you prefer, the firm had 1 million shares outstanding for 364/365 days and 600,000 shares outstanding for 1/365 days for a weighted average of 998,904).
EPS is broken down into basic and diluted. Basic EPS is net income less any preferred dividends, divided by the weighted-average common shares. Diluted EPS is a pro-forma exercise showing any decrease from the potential exercise of existing options, warrants, and equivalents being converted into common shares. If shares are entitled to receive dividends (this may include partially paid for or subscribed shares), they are included on a weighted-average basis. If shares are not entitled to receive dividends, they are treated like options. Any contingent shares are included as if they were issued at start of year if their issuance is based only on passage of time; otherwise, contingent shares are included from the date the contingency is satisfied.
The calculation for diluted EPS begins by computing the impact each convertible and option would have on EPS (as described below), and ranked from the greatest to the least dilutive (i.e., by how much they would reduce EPS). Options and warrants whose conversion to shares would increase EPS (be antidilutive) are excluded from further consideration.
For convertibles, the net after-tax interest is added back to net income (included in the numerator) and the number of shares are increased (in the denominator) for the full year if the convertibles were outstanding at start of year or weighted for part of year using the issue date if issued during the current year.
For example, Pachydermus Corp. has net income of $2 million during 2016, with 1 million shares outstanding at the start of the year and at the end of the year (having neither issued nor repurchased any shares during the year). Its basic EPS is $2.00 ($2,000,000/1,000,000).
Pachydermus has only one convertible bond; a bond with $1 million face value and 6 percent interest that is convertible into 50,000 shares of common stock issued on January 1, 2016. The firm has no options or warrants. The tax rate is 35 percent. Had the bond converted (become equity) on the issue date, January 1, 2016, then the firm’s operating income would have gone up by $39,000 ($1 million × 6% × (1 – 35%)) and shares outstanding would have increased by 50,000. The EPS effect is $0.78 ($39,000/50,000) for the full year. If EPS is less than $0.78 it is not dilutive and ignored. If the EPS is more than $0.78, which it is in this example, and there are no other dilutive items then the impact of this convertible is included and diluted EPS is $1.94 (($2,000,000 + $39,000)/(1,000,000 + 50,000)). If there is more than one dilutive item, it must be ranked and included accordingly (as illustrated below).
Let us say the conversion could only be done partway through the year (e.g., the convertible was not issued until partway through the year), say on June 1 (five months into the year, with seven months left to the year). The annual amounts would be adjusted accordingly (in this case, multiply the annual amounts by 7/12). With just the one dilutive item, adjusted for seven months of the year, diluted EPS is $1.97 ($2,000,000 + $39,000 × (7/12))/(1,000,000 + 50,000 × (7/12)).
For options, the denominator is increased by the difference in the shares issued less the number of shares that could be repurchased using the proceeds at current market prices.
For example, Pachydermus Corp. issues 1 million options to purchase 1 million shares at $6 per share. There is no impact if the shares are exactly $6 or less because they will not be exercised (there is no point in paying $6.00 and using an option if the shares can be purchased for $6.00 or less without the option). If, however, the shares are at $8 and the issue date is January 1, 2016 (or in the prior year), then the impact is:
Proceeds = $6 million
New shares issued = 1 million
Assumed shares repurchased = $6 million/$8 = 750,000
Net change in denominator = 1 million – 750,000 = 250,000
Diluted EPS = $1.60 (($2 million/(1,000,000 + 250,000))
If the option date was July 1, 2016 then the denominator would be increased by 125,000 (250,000 × (6/12)) and diluted EPS would be $1.78 ($2,000,000/(1,000,000 + 125,000)).
Now, let us examine a comprehensive example. Pachydermus Corp. has net income of $2 million during 2016 with 1 million shares outstanding at the start of the year and at the end of the year (having neither issued nor repurchased any shares during the year). Its basic EPS is $2.00 ($2,000,000/1,000,000). The firm has three convertible bonds and one set of options as follows in the list below:
A) A $1 million face value 15 percent bond issued on January 1, 2007, convertible into 40,000 shares of common stock.
B) A $1 million face value 9 percent bond issued on January 1, 2015, convertible into 31,000 shares of common stock.
C) A $1 million face value 6 percent bond issued on January 1, 2016, convertible into 50,000 shares of common stock.
D) One million options issued to employees on January 1, 2016, each to purchase one share of common stock at a price of $6.00 per share and the market price is $8.00 per share.
The first step is to compute the dilutive effect of each individual items as follows (assuming the tax effect is 35 percent as above):
A) $2.44 (after-tax interest of $97,500 ($1,000,000 × 15% × 65%)/40,000 shares).
B) $1.89 (after-tax interest of $58,500 ($1,000,000 × 9% × 65%)/31,000 shares).
C) $0.78 (after-tax interest of $39,000 ($1,000,000 × 6% × 65%)/50,000 shares).
D) Fully dilutive as they only increase the denominator and do not affect the numerator (so it will always be included in the diluted computation).
Next the items are ranked by their dilutive effect (from most to least) as follows:
1. Fully dilutive (d) options.
2. $0.78 (c) 6 percent convertible bonds.
3. $1.89 (b) 9 percent convertible bonds.
The 15 percent convertible bonds are not included as they are not dilutive (including items that are not dilutive would increase EPS instead of decrease it).
Diluted EPS is now recalculated by adding the above one at a time.
Including the options gives a diluted EPS of $1.60 (($2,000,000)/(1,000,000 + 250,000)).
Including the 6 percent convertible bonds gives a diluted EPS of $1.57 (($2,000,000 + 39,000)/(1,000,000 + 250,000+ 50,000)).
The 9 percent convertible bonds are excluded because they are no long dilutive once the more dilutive items are included. Including the 9 percent convertible bonds would increase diluted EPS from $1.57 to $1.58. Thus, diluted EPS in this example is $1.57, the lowest possible EPS.
The price–earnings or P/E ratio is a firm’s stock price divided by a firm’s EPS. It is an indication of the market’s expectations for the firm’s future growth relative to the market. The higher the P/E relative to the market, the greater the firm’s expected growth.
Many analysts also include a market-to-book ratio in their analysis of a firm. This ratio divides the market capitalization (share price times number of shares outstanding) by the accounting value for owners’ equity. The ratio gives us a sense of how the market values items not included on the financial statement, such as the human capital of a firm, distribution networks, and internally generated goodwill. The greater the market-to-book ratio, the more the market is valuing the future growth of the firm.2
An important caveat: Be aware of “pro-forma” EPS (and non-GAAP or pro-forma financials in general). Many firms provide additional EPS (and other) numbers after removing items that they argue should not be considered because they do not normally occur. However, this type of argument is suspect and should be examined skeptically. There are always unusual items every year and it is perhaps unsurprising that firms will only exclude those that decrease earnings.
Foreign Currency Translation
All foreign assets, foreign liabilities, and statements of foreign operations must be converted to the primary firm’s accounting methodology and currency before being included in the primary firm’s financial statements (it would clearly make no sense to add U.S. dollars and euros). But what rate should be used for the conversion? The year-end rate? An average for the year? The rate at the time of the transaction? In the past many different methods were used, but today a foreign-denominated Balance Sheet is translated at the year-end rate while a foreign-denominated Income Statement is translated using an average rate. (The rate used should technically be the one on the date of each transaction, but an average is allowed and is normally what is used).
However, using different rates for the Balance Sheet and Income Statement, means the statements will not balance or tie into each other. This “translation” difference is an amount that is not recognized as income and that will be included in the owners’ equity section under an item called “accumulated other comprehensive income” (discussed more fully below).
In contrast, “transaction” gains and losses resulting from differences in the exchange rates on foreign transactions are generally included in net income for the period. For instance, a U.S. company can have gains or losses when it sells or buys inventory or when it borrows in a foreign currency, and these transaction-based gains or losses are included in net income. An exception is when a firm hedges the foreign currency either directly in the future markets or via a foreign subsidiary. In this case, the transaction is recorded at the exchange rate at the time of the transaction and any difference at the time of settlement is recorded as a gain or loss.
For example, if a U.S. firm buys 10,000 T-shirts for €5.00 each when the exchange rate is $1.20 per €1.00, the transaction would increase inventory and payables by $60,000. Now, assume that when the payment is actually made, the exchange rate has fallen to $1.08 per €1.00 for a total of $54,000 (€5.00 × 1.08 × 10,000). The accounting entry would remove the payable of $60,000, decrease cash by $54,000, and the balancing figure of $6,000 in foreign currency gain would be recorded on the Income Statement.3 (The inventory would not be adjusted.)
The above is true unless, at the time of the transaction (i.e., the purchase of the inventory), the firm hedged the foreign currency rate by entering into a future contract.4 For example, if the firm purchased a future contract to purchase €50,000 (€5.00 × 10,000 units) for $56,000 (i.e., at an exchange rate of $1.12 per €1.00) then the inventory and payable would be set up at $56,000 (instead of $60,000) and there would be no gain or loss at the time of payment because the firm had contractually set up what the exchange rate would be. The entries recorded would simply be cash and payable down $56,000.
Will a stronger domestic currency (e.g., if the U.S. dollar strengthens against the euro at the end of the year) cause profits to go up or down? All else equal (i.e., with no other changes in the levels of sales and expenses measured in the foreign currency) a stronger domestic currency will result in lower foreign revenues however the cost of expenses in foreign currency will also decrease. The net effect will normally cause profits to fall. If the domestic currency weakens, foreign revenues will increase and expenses will decrease, normally causing net profits to rise.
In addition, all else equal, if the domestic currency strengthens (weakens), the conversion will create a reported decrease (increase) in the value of net foreign assets. For example, assume the exchange rate goes from $1.0 for €1.0 to $1.0 for € 1.5 (i.e., the domestic currency is the U.S. dollar and it gets stronger), and assume assets are €2 million with liabilities at €500,000 for a net position of €1,500,000. Converting euros to dollars one for one results in $1.5 million of net assets. Converting at 1.5 results in $1 million of net assets (a reduction of $500,000).
An increasing number of items bypass the Income Statement (e.g., unrealized holding gains and losses on marketable securities available for sale, foreign currency translation gains and losses) and appear in aggregate in the Balance Sheet as a subsection of owners’ equity under the title “accumulated other comprehensive income.” To provide details on the elements of accumulated other comprehensive income, financial reports have been expanded to include an additional statement called “The Statement of Comprehensive Income.”
Comprehensive income is defined as “the change in equity [net assets] of a business enterprise during a period from transactions and other events and circumstances from nonowner sources. It includes all changes in equity during a period except those resulting from investments by owners and distributions to owners.”5 This means that comprehensive income includes all changes other than those in contributed capital and retained earnings.
Comprehensive income begins with net income (which can include the various classifications of: income from continuing operations, income from discontinued operations, income from extraordinary items, and the income from the cumulative effects of certain changes in accounting principles). It then includes foreign currency items, minimum pension liability adjustments, and unrealized gains and losses on certain investments in debt and equity securities.
Each year the total amount of comprehensive income increases or decreases the accumulated other comprehensive income listed in the owners’ equity section. The details of each component of accumulated other comprehensive income, using the same classifications as in comprehensive income, must be disclosed either on the face of the Balance Sheet, in a Statement of Changes in Equity, or in Notes to the Financial Statements.
Fair Value Accounting (aka Mark-to-Market Accounting)
Firms can elect to value-specific assets and liabilities using their “fair” values. However, once this election is made it cannot be changed. That is, once a particular item is valued using market values it must always be valued using market values, with the mark-to-market method creating an unrealized profit or loss each year that will be recorded in the Income Statement. Disclosure of the rationale for using fair value, the impact on earnings, and the differences between fair values and contract values must be included in the Notes to the Financial Statements.
Fair value is defined as “the price that would be received to sell an asset or paid to transfer a liability in an orderly transaction between market participants at the measurement date.”6 Thus, fair value is an exit price (using the perspective of the participant that holds the asset or owes the liability). When market prices are not available and a valuation technique (such as a pricing model) is used to determine a price for the asset or liability, the recorded value of the asset or liability should be adjusted to take into account the risk that the valuation technique gives the wrong value. In addition, the fair value measurement of a liability should include any risk of nonperformance (the cost of the failure to meet the obligation).
The accounting standard sets out a hierarchy prioritizing the inputs used to measure fair value with three broad levels. The highest level (Level 1) is given to quoted prices (unadjusted) in active markets. The middle level (Level 2) is the market price for identical assets or liabilities. The lowest level (Level 3) is when the inputs are unobservable and must be based on the best evidence available.
Essentially, a market price must be used if it exists. Where market prices do not exist, an income approach (valuing the asset or liability using estimates of discounted future cash flows) or a cost approach (the estimated current replacement cost adjusted for any obsolescence) are also allowed. In all cases, detailed quantitative disclosures are required for each major category of assets and liabilities.
FIFO to LIFO Adjustments7
It is important to have comparable numbers across firms and time. This means it is important to adjust accounting techniques so that they are comparable. One of the most common adjustments, especially when comparing U.S. and European firms, is that of inventory.
U.S. firms are currently allowed to use FIFO, average, or LIFO for reporting and tax purposes (European firms and those from many other countries, as noted below, are not allowed to use LIFO). However, prior to 1971, only FIFO and average were allowed in the United States for tax purposes while firms could use FIFO, average, or LIFO for public reporting purposes. Because most prices were rising, most firms used FIFO in their public reports in order to report higher profits to the public. After a considerable amount of lobbying, in 1972 Congress agreed to allow firms to also use LIFO for tax purposes. However, Congress inserted an important caveat: firms could use LIFO for tax purposes only if they also used LIFO their public reports.8
The above means a U.S. firm with rising inventory costs (as of 1973) could save money by switching from FIFO to LIFO, as it allows the firm to defer tax payments. However, to do so, the firm would have to report lower current accounting profits in its public reports. This is an important point: Economically, a firm could increase current cash flows by reporting lower profits (for both tax and reporting purposes) and deferring some of its tax payments, which would thereby increase the net present value of its future cash flows. However, to do so it would have to lower current reported accounting profits as well.
In 1973, eight firms listed on the Compustat database switched from FIFO to LIFO. Their stock price rose, as apparently the market understood and appreciated what they did. The next year 183 firms switched from FIFO to LIFO.9
At one point, because of this tax effect, a majority of U.S. firms used LIFO. Today the number is much less (one study of 5,000 public firms puts the number at around 8.7 percent).10 There are two issues with using LIFO. First, there is a downside risk to LIFO in periods of rising prices: liquidating inventory can increase profits but may result in unexpected tax liabilities. Second, LIFO is not allowed under International Financial Reporting Standards (IFRS), which are used by the European Union and by countries in other regions as well. This creates a problem in comparing across firms, especially between United States and European firms.
The problem is somewhat mitigated as firms using LIFO are required to disclose in the Notes to the Financial Statements the “excess of replacement cost or current cost over stated LIFO value.” This information allows an estimate for what the FIFO number would have been. For example:
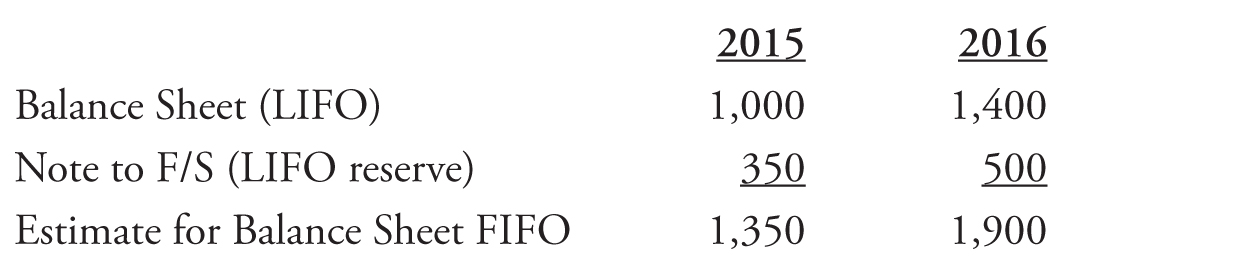

Thus an analyst can estimate a FIFO value from the LIFO information and the LIFO reserve presented in the Notes to the Financial Statements. If the LIFO reserve goes down, it may be due to the firm dipping into the LIFO layers. If the amount is material, the firm must disclose it in the notes.
The Bottom Line
This chapter briefly reviewed accounting for EPS and the price–earnings ratio, foreign currency translations, comprehensive income, fair value accounting, and how to adjust from LIFO to FIFO. The brief presentation is meant to provide the reader with an understanding of how accountants treat each topic and how they should be interpreted.
The next chapter provides a review of financial analysis with two detailed examples and is somewhat of a capstone to the first five chapters. It also includes a discussion on whether models using accounting data can successfully predict whether a firm will be able to meet its future obligations as well as determine the quality of accounting earnings.
_________________
1Note that most ratios discussed in a firm’s annual report are not audited. This is why it is critical for an analyst to prepare her own ratios; it is the only way to know what definitions are being used and to ensure consistency.
2As an aside, some analysts claim that a buying opportunity exists when the market-to-book ratio falls and approaches one. Although this may be true in some instances, it is somewhat questionable. Remember, a market-to-book ratio of one means the market believes there is no value in the firm’s human capital and distribution networks. I submit that a firm without human capital is a dubious investment.
3If the amount remained unpaid at year end, the payable would be adjusted to the year-end exchange rate and the gain or loss would be recorded on the Income Statement. (The inventory value would not be adjusted.)
4It must be a firm commitment (e.g., a future contract purchase) and designated to the specific transaction.
5Accounting Standards Codifications (ASC) 220 effective for fiscal years beginning December 15, 1997.
6Accounting Standards Codifications (ASC) 820 effective for fiscal years beginning November 15, 2007.
7This chapter assumes the reader is familiar with FIFO (inventory costed on a “first-in-first-out” basis) and LIFO (inventory costed on a “last-in-first-out” basis). If not, the reader is encouraged to review a basic accounting book (e.g., Weiss, Lawrence A., 2016, Accounting for Fun and Profit: A Guide to Understanding Financial Statements, BEP).
8This remains true today and is, to this author’s knowledge, the only case in the United States where a firm’s tax accounting choice is linked to the firm’s public reporting choice (i.e., LIFO conformity, IRS Code 472-2(e)).
9See: Gary C. Biddle and Frederick W. Lindahl (Autumn 1982). “Stock Price Reactions to LIFO Adoptions: The Association between Excess Returns and LIFO Tax Savings,” Journal of Accounting Research 20, no. 2.
10See: Kleinbard, Edward D., George A. Plesko, and Corey M. Goodman (October 16, 2006). “Is it Time to Liquidate LIFO,” Tax Notes 113, no. 3, pp. 237–253 and http://ww2.cfo.com/accounting-tax/2006/07/the-battle-to-preserve-lifo/