Chapter 7: Understanding Embedded Analytics
In this chapter, we will understand the embedded capabilities of Amazon QuickSight. We will discuss the business drivers for embedded analytics, and we will take a closer look at its architecture. Finally, throughout this chapter, we will provide hands-on examples to help you understand how to set up embedded analytics.
In this chapter, we will cover the following topics:
- Introducing QuickSight embedded analytics
- Architecture and user authentication
- Generating an embedded dashboard URL
Technical requirements
For this chapter, you will need the following:
- An AWS account with administrator permissions
- A QuickSight account with the Author and Reader users configured
- The dashboards we created in Chapter 4, Developing Visuals and Dashboards
Introducing QuickSight embedded analytics
So far in this book, we have learned how to create dashboards and work with analyses within the native QuickSight web application. For many use cases, this is sufficient. On the other hand, some organizations need to add data visualizations to an existing web portal, outside of the native QuickSight application.
Understanding the business drivers for embedding
Before embedding, organizations needed to develop their own custom Business Intelligence (BI) solutions. D3.js (https://d3js.org) is an open source JavaScript library for data visualizations on the web. D3.js requires a high level of expertise. This can be hard to find, making it challenging for many organizations to adopt this technology. While there are numerous examples on the web regarding how to build D3.js visualizations (https://observablehq.com/@d3/gallery), JavaScript can be a difficult language to learn for BI developers. At the same time, web developers might not have a deep understanding of the organization's data, which would enable them to choose the right visualizations for the questions they are trying to get answers for, as well as insights from the data. On top of this, when building embedded BI solutions, organizations need to consider other aspects, such as the following:
- How do we fetch data from the datastore?
- How frequently do we need to fetch new data?
- How many users are going to access the application?
QuickSight can directly address these challenges with dashboard embedding. Instead of developing custom visualization components, you can request data visualizations using the QuickSight API and embed them into your HTML code. QuickSight is a fully managed AWS service and will scale automatically for the number of users, enabling organizations and BI developers to focus their efforts on building dashboards rather than scaling their BI solution. For these reasons, embedded dashboards can be an efficient and simple-to-use solution when organizations need to leverage the scale of the AWS cloud for their BI solution, which is embedded into their web applications. Next, we will distinguish between the two types of embedded analytics supported by QuickSight.
Understanding embedded analytics types
There are two different embedded capabilities Amazon QuickSight supports:
- Read-only dashboard embedding
- QuickSight console embedding
Understanding read-only dashboard embedding
You can embed read-only dashboards into your web applications. This type of embedding can be used to add read-only visuals to your custom portal application and expose it to internal or external users. Users that access embedded dashboards have a similar experience to the one when accessing a QuickSight dashboard via the web application, as shown in Chapter 3, Preparing Data with Amazon QuickSight. While users can view the visuals, as well as drill down or select specific datapoints or categories, they don't have access to the authoring interface and dataset creation processes. In this mode, visual creation, dataset setup, and all the other operations that an author user can complete can only be completed using the QuickSight web app. For read-only dashboard embedding, your users can be authenticated, or you can enable anonymous access to allow unauthenticated users to view the dashboards. The latter is a good option when you don't need your users to be authenticated to access dashboards, such as when you need to embed your dashboard into a public-facing website.
Note
To enable anonymous access, your QuickSight admin needs to enable session capacity planning. With session capacity planning, you can buy several sessions, based on the traffic expected for your dashboard. Each session is a 30-minute usage block.
The embedded dashboard is in the form of a URL with an authorization code. To get the embedded dashboard URL, you will need to call the GetDashboardEmbedUrl API call. This API call returns a session URL with an authorization code that can be used to embed the dashboard into your website. The GetDashboardEmbedUrl API call needs to be initiated by the web application server, not from the user's browser. To add an embedded dashboard URL to your website, you can use the embedDashboard(options) method from the QuickSight Embedding SDK. This allows you to easily set a parameter value so that your dashboard starts with specific initial parameters. Other options include the embedded frame formatting, allow/not allow printing, scrolling behavior, and starting sheet. For more information, you can read the QuickSight Embedding SDK documentation: https://github.com/awslabs/amazon-QuickSight-embedding-sdk.
Understanding QuickSight console embedding
You can embed the full QuickSight console application into your web application. The embedded console capabilities are only available to authenticated QuickSight users. As expected, anonymous access is not an option for this type of embedding. Similar to the QuickSight web app, only authenticated users can access the QuickSight console. Console embedding will provide your users with the full QuickSight experience. You will be able to have both reader and author users using it. Authors will be able to configure datasets, perform analysis, and share dashboards, while your readers will be able to access read-only dashboards. The console session is in the form of a URL with an authorization code. To get the console embedding URL, you will need to use the QuickSight GetSessionEmbedUrl API action. Once you have the URL, you can use embedSession(options) from the QuickSight Embedding SDK to embed the QuickSight console into your web application. For more information, go to https://github.com/awslabs/amazon-QuickSight-embedding-sdk.
Now that we've discussed the two types of embedded analytics, in the next section, we will discuss the embedded analytics architecture.
Exploring the architecture and user authentication
In this section, we will focus on the architectural components of embedded analytics. To understand this end-to-end architecture, we will break it down into three layers:
- Web application layer
- BI and data layer
- Authentication and authorization layer
This is better represented with the following diagram:
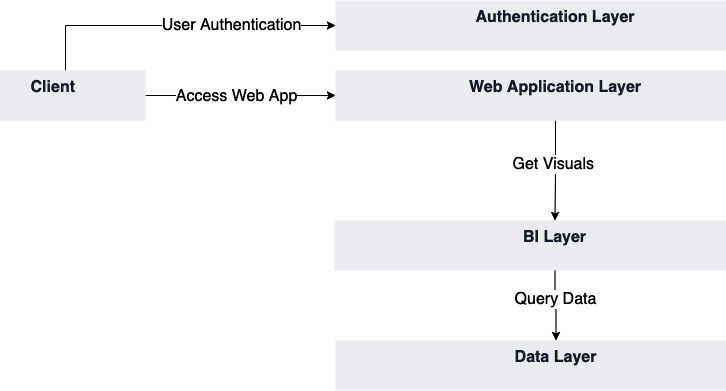
Figure 7.1 – Generic architecture for embedded analytics
Generally, a client typically accesses a web app or a web portal using their web browser. In many cases, the user will need to authenticate with the web app. The client will present user credentials (typically, a username and a password) to the authentication layer, which sends back an access code/token so that the client can communicate with the web application layer. In embedded analytics, the web application layer will be responsible for getting the embedded visuals from the BI layer, which, in turn, would be responsible for querying the data from the data sources and visualizing them (data layer).
In the next section, we will analyze each of these architectural components and identify AWS services that can be used to build them.
Overview of the web application layer
In embedded dashboarding applications, embedded dashboards are embedded within this layer. The web application layer interfaces with both the authentication layer and the dashboarding layer. A web application is typically accessed by the user's web browser. The web application layer is responsible for sending the application's content back to the browser user. Ensuring that the web application layer has enough resources to support your users is your responsibility, and you will need to make sure that there is enough capacity for your web server to accept incoming connections. For that reason, you can consider AWS serverless services such as Amazon Lambda, Amazon S3, for static content, and Amazon API Gateway to build a serverless web application that scales automatically to the incoming demand. Other options include the other compute and container services, such as Amazon EKS, ECS, Fargate, and EC2. You can also host this layer outside of AWS, which means that you don't need to move your application to the AWS cloud to make use of QuickSight's embedded analytics. For embedded analytics to work, you will need to whitelist the domain of your web application in QuickSight's settings.
To whitelist a domain in Amazon QuickSight, follow these steps:
- Log in as an admin user and select Manage QuickSight from the top right-hand corner's drop-down menu.
- Next, select Domains and Embedding to go to the menu shown in the following screenshot:

Figure 7.2 – Domains and embedding settings
- Type in the domain of your web application and click Add. Note that you have the option to include subdomains if you need to by simply checking the Include subdomains checkbox.
Now that we've discussed the web application layer, we will move on to the BI layer.
Overview of the BI layer
The dashboard layer is the component that serves embedded dashboards to the web application layer. Amazon QuickSight is the central component of this layer. This layer can be embedded too, with the full console embedding. The BI layer is responsible for the following:
- Integrating with data sources
- Enforcing access to dashboards
- Serving embedded dashboard URLs
Concerning scalability, QuickSight will scale automatically for the number of users you configure. If you have anonymous embedding, you will need to enable session capacity planning. This layer interfaces with the data stores, eliminating the need to embed code that accesses the data stores into your application, which simplifies the integration with data sources. To work with datasets, you must use the QuickSight capabilities we learned about in Chapter 3, Preparing Data with Amazon QuickSight, rather than developing custom code. Visuals and insights are developed using QuickSight's native capabilities. Finally, at this layer, we configure which users have access to which dashboards. Authorized users get a dashboard URL with an authorization code, while users who don't have access won't get the dashboard URL. Next, we will talk about the authentication layer of an embedded analytics solution within QuickSight.
Understanding the authentication layer
User authorization and authentication are important considerations when building embedded BI applications with QuickSight. The key questions to be addressed are as follows:
- How do you authenticate your users? (Authentication)
- Which users have access to which dashboards? (Authorization)
In embedded analytics, it is common that users authenticate with credentials that are stored outside of Amazon QuickSight in an identity store. You can use Amazon Cognito User Pool as an identity store for your cloud-native embedded analytics architecture. You can configure your identity provider with IAM so that you can assume IAM roles for your authenticated entities.
To configure an identity provider with IAM, follow these steps:
- Log in as an AWS administrator and open the IAM console.
- Click on the Identity providers option, as shown here:

Figure 7.3 – Configuring identity providers
- Select the type of identity provider (SAML or OIDC) and provide the required metadata for your identity provider.
Once you have set up the identity provider, you can configure trust relationships for IAM roles. Your web application will need to be able to assume an IAM role that has access to the required QuickSight APIs so that it can retrieve the embedding URLs.
An example policy that allows the caller to call the GetDashboardEmbedUrl and GetAuthCode functions for all resources is shown here:
{
"Version": "2012-10-17",
"Statement": [
{
"Sid": "VisualEditor0",
"Effect": "Allow",
"Action": [
"QuickSight:GetDashboardEmbedUrl",
"QuickSight:GetAuthCode"
],
"Resource": "*"
}
]
}
Policies can be assigned to IAM roles, which can be assumed by applications before they call AWS services. A policy will determine the level of access to AWS. The next important step is to establish a trust relationship between the IAM identity provider and the role so that authenticated entities can assume the role and generate the embedding dashboard URL. When you create an IAM role, you will need to select the type of trusted entity. The choice is between an AWS service, such as a role that can be assumed by a service, for example, AWS Lambda, another AWS account, a web identity such as Amazon Cognito or other OpenID identity providers, or SAML 2.0 Federation for corporate users. You will see the following when selecting the type of your entity when creating a role:

Figure 7.4 – IAM role trusted entity
Once you create the role, you can attach a policy with the required permissions to call the QuickSight APIs for the dashboard embedding. To get the temporary credentials, your web application layer will need to call the Amazon STS service's AssumeRole API or AssumeRoleWithSAML or AssumeRoleWithWebIdentity, depending on the identity provider. Once you have the required credentials, then your web application will be able to call the QuickSight APIs to retrieve the embed URL, which is then added to your web frontend.
Now that we have seen the main functionality of the three main architectural components, in the next section, we will describe the E2E flow of embedded analytics.
Putting everything together
Now that we have looked at the main architectural components of the architecture, we will enrich Figure 7.1 by adding more specific components (including the relevant AWS services) to each of its layers.
For the authentication layer, we can use the following AWS services:
- IAM to define your required roles
- A Cognito User Pool or another compliant IDP as the identity provider
For the web application layer, we can use the following services:
- AWS Lambda, S3, and API Gateway. There are several examples online of how to use these services to build a serverless web application using these services.
- Other options include hosting our web app using container services or using Amazon EC2 instances. You are not limited to hosting your web application on AWS; you can host your web application anywhere, including on-premises if you need to.
For the BI layer, we can use the following service:
For the data layer, we can use the following services:
- Amazon S3 as the central data lake storage.
- Amazon Athena, which allows you to perform SQL queries over data stored in S3 or other data stores (using Federated Query: https://docs.aws.amazon.com/athena/latest/ug/connect-to-a-data-source.html).
- Amazon Redshift as a data warehouse. Snowflake, another popular cloud data warehouse, is also natively supported.
- Other databases that are hosted inside or outside AWS.
After adding these components, our architecture diagram will look as follows:

Figure 7.5 – Dashboard embedding with AWS services
The flow for dashboard embedding would be as follows:
- The user uses their web browser to open the web portal application.
- The user authenticates with the identity provider and accesses the resource provider via the web application.
- The web application assumes the embedding IAM role.
- Using the IAM role, the web server calls QuickSight APIs to get the embed URL and display it to the user.
- To populate the visuals, QuickSight will fetch the data from the various data sources, abstracting this from the user and the web application.
Now that we have explored the main components of the embedded analytics architecture and the flow between components, in the next section, we will use a few simple commands to generate an embedded dashboard URL.
Generating an embedded dashboard URL
In this section, we will use the QuickSight CLI to generate an embedded dashboard URL that, for this example, we will display on a web browser. Setting up authentication and the web server is outside the scope of this book. In Chapter 2, Introduction to Amazon QuickSight, we created a reader user in our QuickSight account. First, let's verify the details of this user and get their unique resource number:
- Log in to the AWS console as a QuickSight or AWS admin and open AWS CloudShell.
- To view the details of the reader user, use the describe-user CLI command:
$aws quicksight describe-user --user-name reader --aws-account-id <aws account id> --namespace default --region us-east-1
Verify that the user has been found. The response should look similar to the following:
{
"Status": 200,
"User": {
"Arn": "arn:aws:quicksight:us-east-1:<aws account id>:user/default/reader",
"UserName": "reader",
"Email": "[email protected]",
"Role": "READER",
"IdentityType": "QUICKSIGHT",
"Active": true,
"PrincipalId": ""
},
"RequestId": "818a21fc-4146-3bf6-b5c3-a1b315cb874b"
}
Note the User Arn property as we will use it later in Step 4.
- Next, we will need to retrieve our dashboard ID. We will use the list-dashboards CLI command to do. Type in the following command. Replace <aws account id> with the 12-digit long ID from your AWS account. Ensure your dashboard is shared with the admin user so that the following command returns the expected results:
$aws quicksight list-dashboards --aws-account-id <aws account id> --region us-east-1
So far, we have only created one dashboard, so the response should look as follows:
{
"DashboardSummaryList": [
{
"Arn": "arn:aws:QuickSight:us-east-1:<aws account id>:dashboard/<dashboard id>",
"DashboardId": "<dashboard id>",
"Name": "New York Taxi Dashboard",
"CreatedTime": "2021-06-02T19:19:00.285000+00:00",
"LastUpdatedTime": "2021-07-06T22:55:04.960000+00:00",
"PublishedVersionNumber": 14,
"LastPublishedTime": "2021-06-02T19:19:00.285000+00:00"
}
],
"Status": 200,
"RequestId": ""
}
Note the dashboard ID as we will use it in the next step.
- Next, we will use the get-dashboard-embed-url CLI command to generate the embedding URL. Type the following command. Replace the AWS account ID with your 12-digit long account ID, along with the dashboard ID we captured in Step 3, and the user arn property that we captured in Step 1:
%aws quicksight get-dashboard-embed-url --aws-account-id <aws account id> --dashboard-id <dashboard id> --identity-type QUICKSIGHT --user-arn <user arn> --region us-east-1
This command will return the following output:
{
"Status": 200,
"EmbedUrl": "https://us-east-1. quicksight.aws.amazon.com/embed/xxxxxxxxxx/dashboards/xxxxx-xxxx-xxxx-xxxx-xxxxxxxx?code=xxxxxxxxxxxxxxxxxxxxxxxxxxxxxxxxxxxxxxxxxxxxxx
&identityprovider=QuickSight&xisauthcode=true",
"RequestId": "xxxxxx-xxxx-xxxxx-xxxxx-xxxxx"
}
Note the EmbedUrl value. For this example, just open a browser and paste the embed URL to view the dashboard. This will look as follows:

Figure 7.6 – Opening the embed URL on a web browser
In real-world examples, the embed URL will be generated by your application server, and the embed URL will be embedded within your web server. The domain of your web server will need to be whitelisted.
Summary
Congratulations on completing this chapter. In this chapter, we learned about the embedding capabilities of Amazon QuickSight and talked about the different types of embedded analytics. We started by focusing on its main drivers and business benefits. We learned about the main architectural components of dashboard embedding, and then we identified key AWS services that can be used to build these architectural layers. We discussed the end-to-end flow of embedded analytics. Finally, we used simple CLI commands to generate a read-only dashboard URL so that we could see the APIs in action.
In the next chapter, we will focus on managing QuickSight and learn how to automate operations using the QuickSight API.
Q&A
Answer the following questions to test your knowledge of this chapter:
- What are the main drivers for dashboard embedding?
- What are the different types of embedded analytics with Amazon QuickSight?
- What is the role of the STS service in the embedded analytics flow?
- What is session capacity planning and what type of embedded analytics is relevant to it?
- What are the different layers in the embedded analytics architecture?
Further reading
For more information on the topics that were covered in this chapter, take a look at the following resources:
- QuickSight User Guide – AWS: https://docs.aws.amazon.com/QuickSight/latest/user/amazon-QuickSight-user.pdf
- Working with Embedded Analytics – AWS: https://docs.aws.amazon.com/QuickSight/latest/user/embedded-analytics.html
- Build Your First Serverless Web Application – AWS: https://aws.amazon.com/serverless/build-a-web-app/