
When Web teams consider performance, they usually think of server-side issues such as server hardware performance, application software performance, and bandwidth considerations. The main thing that they associate with performance as it relates to client-side considerations is...a few graphics, and that’s about it.
The truth is, there are a number of client-side performance issues, many of which are quite effective in affecting the user-perceived speed of a Web site. The “time to display” in the browser and the time for the page to be ready for the user to interact with it is possibly the most important aspect of performance from a user perspective. User perspective is everything.
UI coders have to take a lot into account when creating the UI layer of a site, and they are fortunate if they have opted for a Web standards-based approach, because it is more efficient than the older methods. Modern pages are lighter weight, and there is some evidence they are rendered faster in the browser. Certainly, leveraging the browser’s cache for presentation and scripts can be beneficial because that information does not have to be downloaded every time.
The usual design rules apply about keeping file sizes to a minimum. But this applies to graphics, CSS files, JavaScript, Flash files, and anything else that a Web page has to load. However, the actual structure of the page, the way it’s put together, where it is requesting the files from, and the way artwork is cut can all have tremendous impact on the load time in a Web browser.
A number of industry experts, including the Yahoo! UI team (www.yuiblog.com) in particular, have published research on page-loading and the way browsers make requests to the server (see the links at the end of this section for more of the research). Their and others’ research is of immense value to front-end developers looking for optimizations. Of particular interest is how Web browsers request files, in what order, and what they can and cannot do in parallel.
Some interesting performance tips from Yahoo! UI and others include
Fewer files mean faster load times, even if some of those files are larger than smaller sets of smaller-sized files. This is because each HTTP request the browser makes and the server responds to is exceptionally time-intensive.
Combining images and using CSS to position and clip the graphics to show parts of them at a time can speed up load times, because of fewer HTTP requests. These images are frequently referred to as “CSS Sprites.”
Consider, either as part of a build process when deploying a Web site or in real time, merging numerous CSS and JS files into their own single file in order to reduce HTTP requests. Another way to dynamically merge files is to use server-side scripts.
A browser can load CSS files simultaneously; however, once it hits a
<script>tag, the browser suspends other load operations and loads each<script>individually in sequence. Once the scripts are completed, the browser then proceeds with loading the page. This can seriously skew load times.To help mitigate multiple
<script>tag load impacts, consider placing<script>tags just before the closing<body>tag to allow the page to load before the scripts.Execute page-building JavaScript when the document has completed loading, as opposed to when the whole page loads (also known as
window.onload). For more information, see the performance experiment section following this, and the sidebar “Execute on Page Load, or Event on DOM Document Load” in Chapter 3.Spread images or scripts out over multiple DNS names so the browser can request more files simultaneously. These can be simple DNS CNAMES, as the IP address doesn’t matter. There is a limit to this benefit, so reading the research on this technique is recommended (see notes below).
Enable gzipping or compression of HTTP served content. Almost all Web servers today and Web browsing clients can serve and accept compressed content; this can shave a lot of size off the downloaded files.
Where there are large numbers of scripts required but selectively used, authors should consider investigating a technique called “Lazy Loading” or “On-Demand” script loading, which allows only basic scripts to be loaded until extra libraries are needed, which are then loaded dynamically without a page refresh.
Modern JavaScript can get fairly bloated, so consider using one of several online tools that strip unnecessary code and white space from scripts to make the files smaller. Two examples are Douglas Crockford’s JSMin (crockford.com/javascript/jsmin.html) or Dean Edwards’ Packer (http://dean.edwards.name/packer/).
Note
For the above and more, including additional tips and further explanations, please see some of the following original research and resources online:
Performance Research, Part 1: What the 80/20 Rule Tells Us About Reducing HTTP Requests http://yuiblog.com/blog/2006/11/28/performance-research-part-1/
High Performance Web Sites: Rule 1—Make Fewer HTTP Requests developer.yahoo.net/blog/archives/2007/04/rule_1_make_few.html
Optimizing Page Load Time www.die.net/musings/page_load_time/
How do some of these techniques fare in the real world? Where can the savings actually happen? It’s important to remember that different types of sites will fare differently based on their makeup and what techniques are employed on them. For example, large news or e-commerce sites and the typical Web designer’s blog are different types of sites altogether, with diverse server needs and volumes of traffic. Additionally, a number of other variable factors also affect performance, from the quality and type of Internet connection to the speed of the computer being used.
To get real-world examples, metrics must be pulled from large sites with hundreds of assets and thousands of users. These sites can be literally hundreds of kilobytes in file size. You can also extrapolate large-site performance benefits from small-scale examples, such as blog pages, which are often 100KB or smaller. That’s the test we’re going to try here.
Using a dial-up connection and the excellent Mozilla Firefox extension Firebug (www.getfirebug.com), you can inspect the download requests of a given Web page using its networking tools. These tools display a graph of each object, its file size, and the time to download it in comparison to other objects on the page. Firebug is free, open source, and a highly recommended tool for debugging everything from CSS to JavaScript and Ajax.
Starting with a small-scale blog that features 112KB of files, Firebug shows that these files are broken down into 22 unique requests that take roughly 20.44 seconds to download over a dial-up connection.
Consider also that the JavaScript, when building advanced page effects, typically is loading a number of scripts onload—when the document has finished loading—and that will not happen until 20 seconds after the page is initially loaded.
The site features
Four CSS files: a 47-byte file, a 13KB file, a 5KB file, and a 738-byte print style sheet
Three JavaScript files in the document’s
<head>: one 18KB file, one 2KB file, and a 20KB file from an external site for statistics trackingThree other 20KB JavaScript files from external sources for small advertising promotions
Examine the initial, out-of-the-box graph from Firefox. The same graphic and list of files would be almost exponentially larger on an enterprise-scale site, and so would the download times and numbers of files (FIGURE C.1).
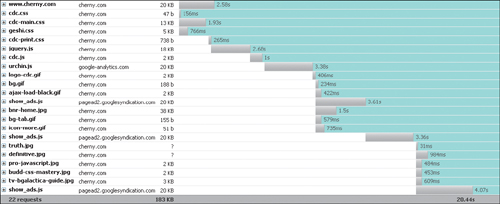
Looking at the graph, you can add up the times and see the point at which the CSS and JavaScript in the document’s <head> are loaded, the document itself, and also the point at which the artwork and other files are loaded:
The HTML document itself takes 2.5 seconds to load.
The CSS files are loaded with some overlap to the document, but with a little extra time compared to the HTML document.
As expected, the three JavaScript files in the
<head>are loaded one file at a time, in sequence, while nothing else is loaded; however, this process does not start until after 2.5 seconds or so.By the time these JavaScript files are loaded, almost six additional seconds have passed.
Roughly eight seconds pass before the first graphic is loaded, due to waiting on these other requests.
It can be safely assumed that at a certain point, the document is rendered in the user’s window, and colors and layout are applied from the CSS, at least after 2.5 seconds for the CSS to load, although no artwork is displayed in those first eight seconds.
Far from a scientific analysis, but an interesting story nonetheless, in particular the portion where the scripts are loaded one at a time and in sequence.
Now, consider for a moment that there has been some optimization already at this point. The first, 18KB JavaScript file is a white space-packed JavaScript file that was compressed from 50KB to 18KB. A 50KB file on a 56Kbps dial-up connection would take a full six seconds to download, all while nothing else is happening. This alone would push out the time to display any artwork to something like 11 seconds.
Finally, this script actually queues up several JavaScript events and actions unobtrusively and loads the scripts, not at the end of the page load as per usual, but once the HTML document’s DOM has loaded, cutting that time down from 20 seconds to eight seconds. This is a huge performance boost (read more about it in the JavaScript sidebar “Execute on Page Load, or Event on DOM Document Load” in Chapter 3).
A first pass through can easily optimize the files’ linking and placement inside the document with a couple of easy steps:
Merge the CSS files.
Merge the JavaScript files.
Move the JavaScript files to the bottom of the document just before the closing
<body>tag.
Before merging the files, the script and link tags looked like this:
<link rel="stylesheet" type="text/css" href="/-/css/cdc.css" />
<link rel="stylesheet" type="text/css" href="/-/css/cdc-print.css"
      media="print" />
<script type="text/javascript" src="/-/js/jquery.js"></script>
<script type="text/javascript" src="/-/js/cdc.js"></script>
<script src="http://www.google-analytics.com/urchin.js"
type="text/javascript">
</script>
Additionally, the cdc.css file used @import to bring in two further CSS files, cdc-main.css, and geshi.css. The @import directive is a common technique to screen out old browsers that don’t support more modern CSS commands. Combining the CSS files is a fairly straightforward process of taking the content of cdc.css, main.css, geshi.css, and cdc-print.css, and saving them off into a single linked file called cdc.css.
One immediate problem is that the CSS links to a print-specific CSS file, cdc-print.css, and if that content is pushed into cdc.css then there has to be a way to specify that its rules are print-specific. The CSS specification solves this dilemma through the use of inline media handlers. Using an @media declaration, which is wrapped around the rules that apply, means that the cdc.css file looks like this:
/* content from the other css files here */
@media print {
   /* content from the cdc-print.css file such as: */
   #nav { display: none; }
   #content { position: static; }
}
It seems odd because it’s not typical to see curly braces {} inside of other curly braces {} in CSS. Now, with a single file the media type is set to all, which, much like @import, can help screen out older, unsupported browsers:
<link rel="stylesheet" type="text/css" href="/-/css/cdc.css"
   media="all" />
Beyond this, the JavaScript files (the ones that can be combined) are combined and moved out of the document’s <head> and placed just before the closing <body> tag:
<script type="text/javascript" src="/-/js/cdc.js"></script>
<script src="http://www.google-analytics.com/urchin.js"
   type="text/javascript"></script>
</body>
</html>
So, the cdc.js file contains both jquery.js and cdc.js. Unfortunately, the last file is from another source, and can’t be combined.
Combining the CSS and JavaScript files reduces the number of HTTP requests on this page to 18 requests—down from 22. There is now one main CSS file and one main JavaScript file, which replaces the three scripts that used to be in the document’s <head>.
The results can show how these simple steps can speed up the user’s experience. First, the download time is reduced, albeit only about a second on a site as small as this. It is, however, interesting that even a small page can have a small performance boost. One can imagine the effect on a large site, with a server having to respond to thousands of users. Here, reduction to four fewer requests made for a small savings in terms of download time, however, the server itself has less work to do. The busier the site, the more that will add up (FIGURE C.2).
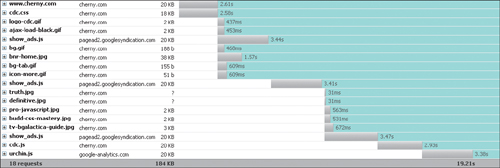
Another item worth noting is that it is now only roughly 2.5 seconds before the page is downloading the attached artwork—vividly increasing the user’s perception of how responsive and well-performing the site is. The main page’s scripts being downloaded at the end of the body document has not delayed the loading of the artwork and other assets, because (as has been noted) loading scripts prevents other files from loading. Now, this operation happens at the end of the document.
HTTP 1.1 file compression has been supported by most Web browsers for years. Unfortunately, for years common Web browsers such as Netscape 4 had exceptionally buggy implementations. With that said, Web servers had some questionable implementations as well. Today, most major Web browsers have shaken the bugs out and server technology has also caught up to some degree. With Apache there is mod_deflate, mod_gzip, and even PHP has some built-in real-time compression options. Microsoft’s Internet Information Server (IIS) also supports compression, although it is complicated to set up, and often third-party add-ons can assist or even augment its features.
For demonstration purposes, the last step in the experiment is to enable HTTP compression on the server side for the JavaScript and CSS files. Note that in this demonstration, the HTML document has not been compressed, although document compression is almost more common and can yield spectacular results as well, sometimes on the order of a 60% savings. These are all text-based files, which are easy to compress and produce wonderful savings that really pay off.
How compression can be enabled is complex and beyond the scope of this discussion; however, many resources online are available and should be read carefully.
Loading up the test page and tracking the Firebug graph shows some impressive results (FIGURE C.3):
On a dial-up connection, the page now loads in 16 seconds (a three-second gain for a user is exceptional).
20KB in CSS has been reduced to 5KB.
20KB in JS has been reduced to 10KB.

This is a benefit in terms of both server-side bandwidth costs and downloads for users, and the impact on page document weight is obvious. Note that one of the JS files could not be merged or compressed because it was hosted on an outside server.
Remember that these experiments were performed on a small-scale site with low traffic. The results on enterprise sites—with high bandwidth costs, a greater quantity of assets, larger file sizes, and more users—can provide an exceptional payoff.
Tip
Compression can be tricky for many reasons, in particular due to its sordid history and inconsistent support by browsers. Attempts to configure or implement HTTP compression should be performed carefully and with ample research, experiments, and lots and lots of testing. The tests should be tested. And then tested again. Search online for help with regard to PHP compression, Apache mod_deflate, mod_gzip, or IIS utilities.