Chapter 9
Agile Release Planning
In preparing for battle I have always found that plans are useless, but planning is indispensable.
—Dwight D. Eisenhower
Agile planning is a commonly misunderstood part of Agile project management. Many consider “Agile planning” to be an oxymoron—that Agile teams plan very little and iterate with no end in sight.
Agile planning does not call for a complete plan up front but spreads the work of planning throughout the entire project. In fact, Agile teams spend more time planning than traditional teams; it’s just not concentrated at the start of a project.
The Solutions in This Chapter
This chapter explores the practices used to avoid the typical planning pitfalls based on the following principles:
Apply a higher tier of planning than Sprints: Release planning allows for a longer planning horizon.
Create a shared vision of the game: This ensures that everyone working on the game understands what is being made and why.
Enable continuing refinement of the work estimated for each feature as the team learns more: Uncertain features can’t have precise estimates. Accuracy can grow as the feature requirements are refined.
Plan continually: Plans created at the start of a project are very good at hiding when a project is “going off the rails.” Agile planning continually fine-tunes the course of the project to avoid or immediately respond to pitfalls and to double down on valuable practices and features. Plans help teams find success.
Work with clear objectives: The ongoing communication between the team and the stakeholders enables clear objectives to be created.
Prioritize scope to control the budget and delivery date: Many projects that run into trouble first choose to add people or delay delivery dates. This is usually done because many key features are developed in parallel and need continuing development to produce any value. Sprints and releases implement features in order of value. This gives the project the option of meeting a ship date by allowing the stakeholders to draw the line and ship with a set of the highest-valued features.
Experience: Can Agile be Used for Fixed Deadlines?
A common concern with Agile is that “it cannot be used for games with a fixed ship date.” A decade-and-a-half of experience has proven otherwise. Many studios I’ve worked with publish AAA sports titles. These games can lose a large portion of sales if they miss shipping their game at the start of a season.
The Agile approach to implementing features in a value-ordered way while managing debt and risk is the best way to hit a deadline. For sports titles, ensuring that the proper team assets (uniforms, logos, rosters, stadiums) for each year are up to date is most critical and that any new features be managed in a risk-averse fashion. For example, challenging features are often undertaken more than a season in advance so as not to risk the coming season’s build.
Additionally, these teams usually have excellent test automation and defect control to manage debt.
What Is Release Planning?
Chapter 3, “Scrum,” describes releases as major goals that occur every several months, comparable to milestones or E3 or marketing demos in the level they are polished.
Planning a release is different from Sprint Planning. A release plan has more flexibility as features emerge from the Sprints.
Releases begin with a planning meeting that establishes major goals, a set of forecasted Sprint Goals, and a completion date. A release makes progress through a series of Sprints. As each Sprint implements Product Backlog Items (PBIs) and the game emerges, the release plan is updated. The release date can change as well.
Forecasting Versus Estimating
We often use the word forecast instead of estimate with release planning, because the word implies that it’s a prediction of something uncertain. A weatherperson forecasts the weather for this reason. You never hear them “estimate tomorrow’s weather.”
Release Planning Meetings
A release planning meeting uses the steps shown in Figure 9.1.
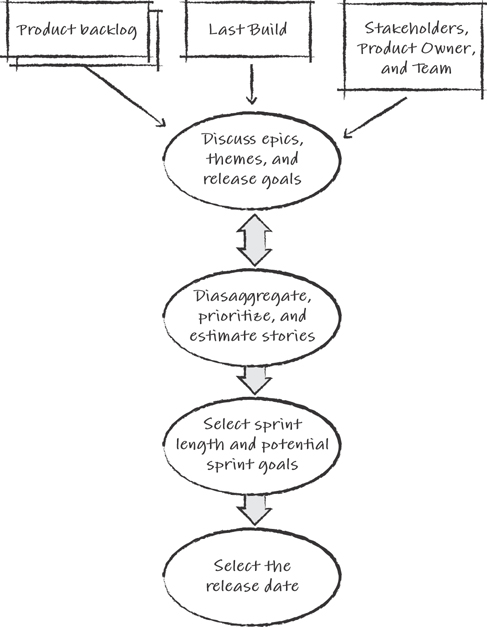
Figure 9.1 The flow of a release planning meeting
The Product Owner, stakeholders, team members, and domain experts attend the meeting. It begins with a review of the progress made in the last release and the Product Backlog. The group then deliberates on the major goals for the release. These goals, often referred to as big hairy audacious goals (BHAGs), represent a challenge for the entire team and establish a vision to aid prioritization. For example, a BHAG to “fight other players online” might raise the priority of spikes to demonstrate that the animation system works in an online setting.
Tip
A release planning meeting can take most of a day. Finding a location with minimum disruptions is useful. A conference room at a local hotel is a good option.
After BHAGs for the release are agreed upon, stories needed to implement them are identified, ordered, and estimated using techniques described in the upcoming sections. The group uses the estimations and priorities, based on the progress teams have demonstrated in past Sprints, to lay out the Sprint Goals for the release. This is called the release plan.
Chartering a Shared Vision
Having a shared vision among all game developers is vital to the success of a game. Too many times developers on big games complain that they “don’t know how their part will fit into the whole” or that they don’t honestly care about the game because they’ve only seen some high-level marketing plan. Game developers need a shared vision that will engage them meaningfully and help them make better daily micro-decisions, which determine a game’s quality.
Because Agile games “respond to change,” this vision will drift over time as features change based on how they emerge. This drift requires Product Owners to continually refresh this vision, not only in their minds but in the thoughts of every developer. A release cycle is ideal for revisiting the vision through the establishment of BHAGs.
Many useful practices have been established for doing this with a team regularly, often referred to as chartering a vision. I’ll list a few here.1
1. I’ve found a useful source of these practices in the book Innovation Games by Luke Hohmann.
Elevator Statement
The elevator statement is a one- or two-sentence statement that summarizes the game for a high-level stakeholder or any member of the team. I once worked on a game that had the elevator statement, “Halo meets GTA3, where street gangs are the heroes battling an alien invasion.” It created an image in the minds of every developer and sparked conversation and excitement around that vision.
Game Box
Every three releases we would mock up a Blu-ray box with some concept art of what the release version of the game would look like.2 The epic goals for the release, written in user story form, sound like the marketing bullet points on the back of the box:
2. Online games can mock up a website.
Execute amazing tricks jumping your skateboard over large objects.
Skateboard on places you’re not allowed to go, like the Hoover Dam.
Meet your friends online and invent contests.
Combined with concept art, a game box communicates a vision and promotes an ongoing conversation about how to get there.
Game Positioning Map
A game positioning map is a one- or two-dimensional map that positions games similar to yours on a chart whose dimensions are significant market segments. This is a standard marketing tool that game developers should use more. Figure 9.2 shows a simple example of a positioning map for a racing game based on the dimensions of the physics realism (sim versus arcade) and the realism of the environments (real versus fantasy).
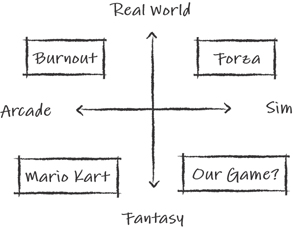
Figure 9.2 Game positioning map
We would create this map in a release planning meeting from scratch and populate the map with suggestions from the team about existing games, past and present. As we would fill the map, we would get more debate about the meaning of the dimensions. For example, while Mario Kart is more “arcadey” than other games, its wheel friction might be quite realistic. Discussing this subject with the physics programmer is beneficial.
However, the real debate begins when we ask, “Where does our game belong?” It also raises questions about our assumptions. For example, if we are making an arcade game with fantasy worlds, we might see the market flooded with such titles, but there are fewer games in the “sim in a fantasy world” area, which might identify a market opportunity.
Other Approaches
Various approaches to chartering a vision to explore include the following:
Mock magazine reviews
MVP canvases
Product presentations (Steve Jobs style)
The benefit of creating a shared vision results mostly from the discussion among developers and stakeholders. These aren’t “design by committee” meetings, and not everyone will agree with the decisions made, but it’s an opportunity to create a shared understanding of why these decisions are made.
Estimating Feature Size
As discussed in Chapter 7, “The Product Backlog,” ordering features on the Product Backlog depends on their individual value and cost. Predicting the cost of a feature is a bit tricky because it can have a feature that has never been worked on before, and it depends on who is doing the work. This section explores techniques for such estimations.
Velocity
Most estimation techniques used by Agile teams use an approach different from traditional project management. Instead of estimating the time it takes to implement work that leads to features, Agile teams estimate the size of features relative to one another and forecast the time they will take by using the average size of features implemented in past Sprints. This average is often referred to as a team’s velocity.
We’re all used to using velocity outside of work. To measure the velocity of anything (a car driving or a ship sailing), we measure the size of something changing over the passage of time (such as miles driven per hour or nautical miles per day). Similarly, for measuring velocity on an Agile project, we use the size of stories completed per Sprint.
Measuring the size of features has been a product management challenge for decades. Project managers have tried measures such as “lines of code,” which turned out to have very little to do with the actual progress made on the project.3 The Agile approach, instead, is to measure completed features, which have value to a user.
3. In fact, it only led to more lines of code.
This section describes proven methods for estimating user story sizes to be used for measuring velocity.
Note
Because most of the published material uses the phrase story points instead of PBI points, this chapter will refer to PBIs as user stories or simply stories as described in the previous chapter.
How Much Effort Should We Spend Estimating?
How much time should we spend estimating stories? We could spend anywhere from a few minutes to a few hours. In a few minutes, we could discuss a broad outline and come up with a guess. In a few hours, we could break a story down into the detailed tasks required to implement it.
We want to spend our planning time wisely. One assumption of planning is that the more time we spend planning, the more accurate our plan becomes. This is, in fact, not true. Figure 9.3 shows that beyond a certain amount of effort, our accuracy decreases (Cohn, 2006).

Figure 9.3 Accuracy versus effort for estimating
Source: Cohn, M. 2006. Agile Estimating and Planning. Upper Saddle River, NJ: Prentice Hall.
Planning provides an initial spike of accuracy with little effort spent. As more effort is spent, the accuracy of estimates actually starts to decline! This is surprising at first glance, but it makes sense. Say we spend an entire day estimating a single story. Given this time, we would eventually create very detailed tasks. These define work creating classes and functions, creating art assets, and tuning variables. As it turns out, this level of detail is too speculative. By the time we start defining functions and variables, chances are we are defining things that won’t be needed or will be changed during implementation.
Rule
It’s better to be “roughly right” than “precisely wrong.” Your range of accuracy cannot exceed your range of certainty.
The purpose of story estimation is meant to be efficient and to occupy the left side of the curve in Figure 9.3. It’s a quick, low-effort estimating practice that provides accuracy valuable enough for forecasting but not enough for a team to commit to the work.
Where Are Story Sizes Estimated?
Chapter 8, “User Stories,” described a story workshop where a hand-to-hand combat system was debated. The debate included not only my technical perspective and experience but also those of the animators and the lead designer. As a result, we had good cross-discipline agreement about the story before we estimated the work.
This is a benefit of story workshops. When teams estimate the size of stories, it drives the discussion of vision, design assumptions, and challenges of implementation. As a colleague once remarked, “It helps remove the fuzziness and hand-waving when you have to come up with a number.”
These cross-discipline discussions refine a team’s understanding of what they are trying to achieve. An estimate for a story needs to reflect this cross-discipline understanding and produce a value that everyone agrees with, regardless of the skills required to implement it. Creating a universal scale for all stories is challenging. For example, a story about a procedural physics effect and a story about animating a character are difficult to directly compare. However, over time, as a team builds a repository of estimated stories and the experience of implementing them, finding comparable stories becomes easier.
Estimating stories should be a quick process that involves the following:
Expert opinion: Inviting domain experts to story workshops helps inform the group about the issues and effort of implementing something the expert is familiar with. For example, if a story includes an online component, a network programmer would provide value to the discussion about it.
Analogy: Analogy is used to estimate story size. When stories are compared to each other, a far more accurate estimate can be achieved than estimating stories on their own. Using triangulation, a story is compared to one larger in complexity or size and one smaller to produce the best results. A story that requires significant specialization, such as a weapon creation story, is best compared to other weapon creation stories to provide the best results.
Splitting: Large stories are more difficult to accurately estimate than smaller ones, so often these stories are split into smaller ones, which are more accurately estimated. However, stories shouldn’t be broken down into a pile of tiny ones because a false sense of detail emerges, as described previously.
Story Points
Stories are often estimated using story points, which are a relative measure of a feature’s size or complexity. For example, modeling two vehicles is estimated at twice the points of modeling one vehicle and possibly the same as modeling a character. This relative measure of story points allows for a more accurate measure of size, as explained later in this chapter.
Note
Although points are not durations, keeping durations out of your mind when estimating points can be impossible. For example, I mountain bike a lot, but I take downhill sections slowly. I occasionally ride with Shonny Vanlandingham, a former U.S. mountain biking champion and neighbor. She “bombs down” the rockiest sections at twice my speed. While I might estimate two different downhill sections to myself in time and say the first will take 20 minutes and the second 40 minutes, my friend would argue that the first should be 10 minutes and the second 20. We would never agree on the times between us, but we would agree that one was half the “size” of the other. As long as we keep our personal time estimates to ourselves, we can work toward an agreement.
A story point estimate is not a commitment to when a story will be completed. There are two reasons for this. First, a story point estimate takes only a few minutes. A team’s commitment to completing a story requires a more precise and time-consuming estimation process. This happens when the team breaks a story down into individual tasks in Sprint Planning. Second, different teams have different velocities. For example, one team might implement a 10-point story twice as fast as another team based on their membership and experience.
Note
Story point estimation is a bit like estimating the price of a car to within $5,000 to $10,000. I don’t need to know the exact price of a Porsche to know that I can’t afford one, but if I know that the small truck that can carry my surfboard is around $20,000, I’ll go to the lot to learn more.
Planning Poker
A favorite technique for estimating stories is the Planning Poker game (Grenning, 2002). Planning Poker combines expert opinion, disaggregation, and analogy in a fun and efficient practice. Planning Poker should be part of release planning meetings and story workshops. It should be used whenever new stories are introduced that need an estimate.
In Planning Poker, attendees discuss stories that have not yet been estimated. After a story is discussed, each person estimates the points they think should be assigned to the story by simultaneously raising a card with their estimate on it for all to see. The first vote often reveals a wide disparity of estimates. The group discusses the range, first by asking the outlying voters to describe the reasoning behind their estimate. This exposes the uncertainties and assumptions of the story. As a result, the vision, design, and implementation details are discussed and refined. These discussions often lead to adding acceptance criteria for a story or defining new stories that were not previously considered.
This practice is repeated until everyone produces the same estimate. If a couple of people have different but close estimates, they may concede to the group’s estimated points and allow the meeting to move to the next story.
Note
Don’t average the votes. The different point estimates often hide what needs to be discussed! Assigning an average doesn’t solve potential problems with the story.
Estimating an entire release plan can take four to eight hours. Often teams won’t tackle all stories for a release in one sitting. They split and estimate the highest-priority stories and then meet once a Sprint to estimate lower-priority or new stories for upcoming Sprints.
Story Point Sizes and the Fibonacci Series
Story points provide a quick and relative estimate of size and complexity for a story. Alone they are not perfectly precise, but with a mass of stories, they average out well enough for planning.
Projects need to define a set of numbers that they use for story point estimates. The two rules of thumb for selecting a set of story points are that the entire scale be within two orders of magnitude. For example, a range of 1 to 100 or a range of 1,000 to 100,000 works. Second, the numbers used should be closely spaced out at the small end and widely spaced out at the high end of the scale. The reason is that our ability to judge the difference between stories with sizes of 20 and 21 points, for example, is not the same as our ability to tell the difference between two stories with sizes of 1 and 2 points.
A useful set of story points that follows these two rules is derived from the Fibonacci numbers. In a sequence of Fibonacci numbers, each number is the sum of the two preceding numbers. An example set of Fibonacci numbers useful for story point estimation follows:
0, 1, 2, 3, 5, 8, 13, 20, 40, 100
The numbers at the high and low ends of the set depart from the Fibonacci sequence. We use zero-point estimates for trivial stories that require very little effort, such as changing a user interface (UI) font color.4 The upper range of these numbers departs from the Fibonacci series rule, but they exist to allow a couple of rounded-out values in the high range.
4. Be careful not to accumulate too many zero-point stories...zeros add up with this math!
Tip
If Planning Poker encounters a story whose estimate exceeds the highest point value, splitting that story into smaller stories before estimating each is best.
The team members should constrain themselves to use only numbers within the set and not use values between them to create averages or compromises. This creates a false sense of precision with story point estimation and slows down a Planning Poker session!
Story Point Limits
Story point velocity is like the odometer in a car. For a long trip, an odometer is not very accurate on an hour-to-hour basis. One hour you might stop for lunch and cover very little distance. Another hour, you might be on a rural highway and cover a great deal of distance. However, an odometer can be very useful looking at a daily average and it lets you refine your plan for arriving at your destination. The same goes for story points. They’re never too accurate when looked at closely, but when used for release planning, they average out pretty well as a forecasting tool.
Ideal Days
The concept of story points is difficult to introduce. Teams accustomed to time estimates often find story points too abstract and instead use ideal days as a benchmark to begin estimating. An ideal day is the measure of work accomplished in a single day with no interruptions (phone calls, questions, broken builds, and so on). Because of this association with something real, the team more readily embraces ideal days.
Ideal days are still a measure of size alone. A story estimated to be one ideal day in size doesn’t mean it takes one day of actual work to complete. We want to avoid any translation of ideal days to actual days of effort. Ideal days, like story points, are valuable measures for quick relative forecasts of effort but not precise enough to use for making commitments.
Abusing Story Points
Used in the way they were originally intended, story points work well. During the British rule of India, officials were concerned about the number of cobras in Delhi so they offered a bounty for each dead cobra brought to them. Instead of reducing the number of cobras, the bounty incentivized people to breed them for the income.
I often see the cobra effect with story points. When they are used to drive team commitments, instead of being used to measure and forecast, they incentivize teams to inflate story point estimates to look good.
Unfortunately, because of management pressures or inertia to demand more predictability and certainty where none exist, many studios end up abusing story points, as discussed next.
Converting Points to Time Estimates
Story point estimation is a quick way to get a forecast of a release plan and of future print goals. However, a five-minute Planning Poker discussion will not give a precise estimation of the effort. Unfortunately, some studios see story points as a cheap and precise way to estimate. Teams end up being told “how many points of scope” they need to accomplish every Sprint because someone applied an hours-per-point formula. It’s always wrong.
Teams Using Large Point-Sized Stories to Commit to a Sprint
Similarly, teams commit to a Sprint Goal using the sum total of stories with large point sizes. As mentioned earlier, large point-sized stories are simply not precise enough for accurate forecasting.
I’ve seen teams successfully commit to a set of very small-sized (one- or two-point) stories, due to the detailed conversations that occur while splitting large stories into smaller ones.
Advantages and Disadvantages of Velocity
An advantage of measuring velocity is to measure the effectiveness of change. Positive changes to practices improve velocity. For example, teams that collocate often see up to a 20 percent improvement in velocity. This is mainly because of the enhancement of communication within the team. Most changes create smaller increases in velocity, but their impact accumulates and compounds over time. Without measuring velocity, many small changes might be overlooked. Quoting Peter Drucker, “You can’t manage what you can’t measure.”
Unfortunately, experience has shown velocity being “weaponized” and used against teams in ways they weren’t intended:
Used to compare teams: Teams are composed of different individuals with different skills and experience, usually working on different things. Comparing their velocity makes no sense.
Used to commit teams to future work: An example is when teams are assigned the number of story points to complete every Sprint. Velocity is an output that can be useful to forecast the future, but story point estimation is never precise enough (see the earlier odometer analogy) to predict the future.
When velocity is used as an input, then the team often adjusts for the uncertainty that emerges by varying the quality they deliver. Some have suggested using a different word, such as “capacity” to avoid these disadvantages, but it’s a cultural issue, not one of vocabulary.
Alternatives to Story Points
Teams have explored a number of alternatives to story points that have worked for them.
T-Shirt Sizing
T-shirt sizing requires a team to size items on the Backlog by using the “small,” “medium,” or “large” tag. Teams will start by rank ordering (discussed next) stories from the top of the Backlog and then divide the list into three size buckets. Once sized, teams will be able to forecast initial Sprint Goals by pulling in a certain number of t-shirt sized items. Although t-shirt sizing doesn’t rely on point sizes, teams will often create a point conversion (for example, small equals one point, medium equals two points, and large equals four points).
Variations include the following:
Teams also use outlier sizes XL, XXL, XS to expand the range of sizes.
Teams will split any story bigger than a “medium” into “small” or “medium” stories before pulling them into Sprint Planning.
Rank Ordering/Sizing
Rank ordering is a visual mapping practice that focuses on the relative amount of effort features or assets will take to get into the game, compared with other, similar assets or features. Identifying their point size comes at the end. Here is how to do it:
Features are written on cards (one per card) and are spread out in random order in front of the group so that they can be easily read as others are being written.
The cards are then collected into a deck.
A card is drawn from the top and placed in the middle of a space (table or wall).
One at a time, each member takes a feature card from the stack and places it, based on the effort needed to implement that feature relative to the other cards. Example: If feature A is easier to implement than feature B, it is placed to the left. If harder, it is place to the right, and if the same, it is placed above or below B.
Instead of placing a card, a member can swap two existing cards if they disagree with how they were previously placed.
With every action, a team member will explain their reasoning to the rest of the team.
The team then returns to step 4 until the deck is emptied.
The ranked list can then be divided into story point buckets or t-shirt sizes.
#NoEstimates
In 2012, Woody Zuill started a conversation on Twitter about the alternatives to conventional estimation techniques using the provocative hashtag #NoEstimates. This led to a useful and heated debate about the usefulness and abuse of estimating things that have an element of uncertainty. There was even a book published on the topic.5
5. NoEstimates: How to Measure Project Progress Without Estimating by Vasco Duarte
While I don’t believe that all estimation is bad, I’ve certainly seen many cases where the desire for certainty, where little or none exists, has led to very speculative and detailed estimates that somehow get transformed into solid do-or-die deadlines. When this occurs, we often see quality of the game and the life of the developer negatively impacted due to the pressures of hitting an arbitrary deadline.
Although the discussion continues to this day, the bottom line is that a continual conversation about the usefulness and the time teams spend creating estimates is a valuable part of continually improving how we spend our time.
Release Planning with Story Points
The release plan identifies potential Sprint Goals for the release. With a history of what has accomplished in the past, teams can forecast those goals using a Product Backlog that has been sized with story points.
Figure 9.4 shows a release plan based on a historical velocity of 15 story points per Sprint. The goals for Sprints 1 through 3 each contain stories that add up to 15 points. The stories for the more distant Sprints in the release are lumped together. In this example, the Product Owner has called for six Sprints in the release because the release plan and projected velocity tells him that this is how many Sprints are needed (for example, 89 points at 15 points of velocity every Sprint tells him the need for six Sprints).6
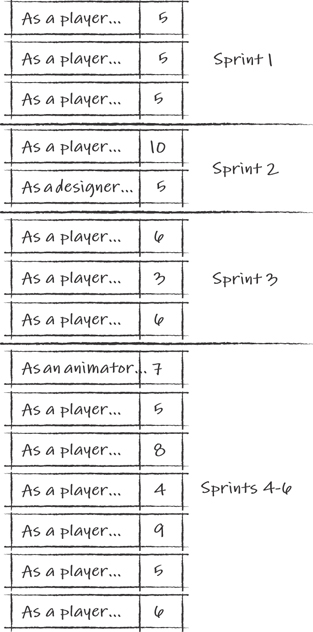
Figure 9.4 Splitting the release plan across future Sprints
6. We always round up.
As Sprints are finished, the goals and stories for the subsequent Sprints are refined. For example, after Sprint 1 is completed, the goal for Sprint 4 is identified.
It’s important to understand that the Sprint Goals identified in the meeting are a forecast of work that can potentially be accomplished by the team; they’re not a commitment. They are useful benchmarks for measuring progress.
Why Not Create a Release Backlog?
People often refer to a release backlog instead of a release plan. It’s best not to create a different backlog for the release. The release plan is a subset of the Product Backlog that changes during the release. Having separate backlogs creates a lot of extra work and confusion over what backlog we are talking about.
Updating the Release Plan
Following each Sprint review, the release plan is reexamined. Sometimes the Sprint has identified new stories to be added. These are stories that were either overlooked or not anticipated in release planning. Other times, stories are removed. These stories are considered unnecessary, or their priority was reduced enough to push them into a future release. As with the Product Backlog, the Product Owner makes the final decision on the addition, deletion, or reprioritization of any story in the release plan.
The release plan may also need refinement based on the team’s actual velocity. Figure 9.5 shows an example of an original release plan on the left, which forecasted 16 user story points of velocity per Sprint. However, the first Sprint accomplished only 13. As a result, the Product Owner updated the new release plan—shown on the right—which dropped the last two (lowest-priority) stories.

Figure 9.5 Updating the release plan based on velocity
The Product Owner also had the option of adding another Sprint to the release if he didn’t want to drop those stories.
Note
In practice, the release plan isn’t dependent on the results of a single Sprint. The velocity used to forecast the Sprint Goals for the release is usually based on the average velocity of the past several Sprints.
Marketing Demos and Hardening Sprints
Scrum describes Sprints as delivering a potentially deployable version of a product at the end of every Sprint. This allows the Product Owner to decide to ship the product on short notice. This is a challenging goal for many games that are deploying for three reasons:
Slacking off on addressing debt is easy to do when you are months or years away from deploying the game.
Many features and assets require a number of Sprints to implement (for example, production levels).
To be deployable, games must often pass rigorous tests for hardware and first-party compliance. These tests can take weeks to conduct and cannot be done every Sprint.
Nevertheless, Sprints should achieve a minimum Definition of Done (DoD) as defined by the Product Owner and Development Team (see Chapter 7, “The Product Backlog”).
A release build should approach the potentially deployable goal more closely. Its DoD should be higher than a Sprint’s. Still, a release build cannot always be expected to pass all shipping criteria unless it is the final release of the game. For all previous releases, a good example of a DoD set is the marketing demo.
A marketing demo has certain expectations:
It has no major memory leaks preventing it from being played for an hour or two.
There are no major missing assets. All stand-in assets are clearly identified as such.
The game has a clean and usable user interface.
The player has a clear objective and experiences the fun of the game.
These are typical requirements for a demo version of a game in any publication, so they are easy to communicate.
As a result of the different completion bars for releases and Sprints, release builds require additional testing beyond what is tested for every Sprint. If this testing identifies issues with the game that aren’t found in Sprint testing, the additional work created to address them creates the need for a special Sprint at the end of the release called a Hardening Sprint.
Work for the Hardening Sprint is derived from the difference between the Definition of Done for Sprint builds and release builds. If the Definition of Done is the same for both, there should be no reason for a Hardening Sprint.
Note
The need for a Hardening Sprint is often driven by testing practices considered too time-consuming to be done every Sprint. For example, testing a marketing demo requires many hours of “burn-in” testing to ensure that there are no significant memory leaks.
Hardening Sprints are often run using a list of bugs and polishing tasks that need to be worked on. They are not used to complete stories from the Product Backlog (see the sidebar “Hardening Sprint Example”).
Hardening Sprint Example
At High Moon Studios, we created simple practices for planning and managing the work for a Hardening Sprint.
A Hardening Sprint was shorter than our typical three-week Sprint; it was usually one week long. The Sprint Planning session started with a simple triage. The Sprint Backlog emerged from a play-through of the game during the meeting with the team, stakeholders, and Product Owner in attendance. During the play-through, anyone in the room could identify a potential fix for the Sprint. If the Product Owner agreed with the value of the fix, it was written down on a whiteboard.
Following the review, the Product Owner roughly prioritized the bugs. This consisted of labeling each bug with an A, B, or C. The A bugs were the most important to fix, the B bugs were medium priority, and the C bugs were not considered very important to fix. This prioritization raised much discussion; some A bugs were considered too challenging to fix in a single week and were demoted, while some C bugs were judged trivial to fix and were promoted.
The team then identified and estimated the tasks to fix all the A bugs and as many of the B bugs as they could within the coming week.
Unlike normal Sprints, changes to the Hardening Sprint priorities were allowed. It was important for the Product Owner to be involved in evaluating the daily build during the Hardening Sprint. Sometimes new bugs caused the Product Owner to change the items or priorities of the bug list. As a result, teams weren’t able to commit to a fixed set of tasks.
Not all fixes on the list were completed in the Hardening Sprint, but the prioritization helped the team accomplish work in the best order. For us, the Hardening Sprint was more like a series of one-day Sprints to improve the game.
What Good Looks Like
How teams plan and execute releases varies considerably, but consistent patterns are common to them all:
The entire team participates in the breakdown of epic stories into a release plan’s forecast continually throughout the release.
The release plan is fine-tuned as the game emerges with the stakeholders participating in the refinement of the release plan.
Story points and other story sizing practices are used only as a rough forecasting tool, not for forcing progress. Successful teams and stakeholders know the limit of estimating uncertain work and respond to the emerging reality by adjusting the plan and not blaming the team.
Summary
Agile teams plan in ways that allow iteration, transparency, and change. They adjust planning to match reality rather than trying to make reality match a plan.
Stories, measured in relative size, allow the measurement of work accomplished per Sprint, which is the velocity. Velocity is used to examine the rate of development and forecast future progress. Measuring velocity early and frequently allows the project to be steered when many options are available to it.
Release cycles allow major goals to be achieved over a longer time frame. Because of the longer time frame, releases have flexibility in planning that does not exist with Sprints. Release plans can be altered in duration or in scope. Releases also demand a more refined Definition of Done to bring an almost deployable level of polish, stability, and tuning to the game, rather than postponing it to near the end of the project.
For many projects, this is enough. The release cycle is sufficient to release versions of the product to players on a regular basis. Many video game projects don’t have this luxury. They have pre-production and production phases that have a different focus and challenges. The next chapter describes these phases and how Scrum, Agile planning, and Lean practices can be combined for planning over the entire development life cycle.
Additional Reading
Bockman, Steve. 2015. Practical Estimation: A Pocket Guide to Making Dependable Project Schedules.
Cohn, Mike. 2006. Agile Estimating and Planning. Upper Saddle River, NJ: Prentice Hall.
Duarte, Vasco, 2016. NoEstimates: How to Measure Project Progress Without Estimating. OikosofySeries.
Hohmann L. Innovation games: creating breakthrough products through collaborative play. 2007. Boston, MA: Addison-Wesley.