
1.1 How do you Set the Right Goals?
Teams without clear goals will not achieve their goals clearly!

Introduction Questions
1. What does “winning the match” mean for your teams?
2. What metric indicates that the teams are working smarter and are more successful?
3. Does this metric show that the customer impact has increased?

Traditional versus New Goals
Teams operate in a complex environment. Markets, technologies, competitors, and customers’ wishes change so quickly and so unpredictably that teams need a new type of goal to give them direction. I’ll explain why.
In static or slow-changing markets, the performance of employees and teams can be measured relatively easily by measuring what they do, on the output. An employee or team that produces more has a higher performance than others. So the more tires mounted, phone calls handled, or windows painted, the higher the performance. This is because, in these markets, there is a relatively stable correlation between what a company produces, the benefit for its customers, and the value for the company. Many companies have existing products that they want to sell to more customers. And the different departments in the organization have to produce more output with a certain customer satisfaction level and, preferably, lower costs. Setting goals for these departments and teams can be done by focusing on an internal metric, often called key performance indicators (KPIs). These metrics can be measured by just looking at the numbers of that specific department. Examples include the number of cars produced, phone calls made, first-time-right numbers, or software functionalities delivered. There is a stable and predictable correlation between what the teams do and what the company achieves.
But in complex, unpredictable, or fast-changing markets, this correlation is often unknown. It may be known today, with the current market situation, but change is almost a guarantee, and therefore this correlation could become unknown in the near future. Nokia was a successful phone company for many years. The organization got into a tough spot not because it didn’t produce enough telephones or because we customers stopped using cell phones. One of the reasons for this tough spot is because the company couldn’t pivot fast enough to smartphones.
If a sports team focuses fully on ball possession, this possession will increase. But more ball possession doesn’t automatically mean winning the game. Likewise, more handled phone calls, more functionalities in the app, or more customer visits are no guarantee for success. Objectives that define what the team has to do don’t make them more successful. Rather, objectives must indicate what the team must achieve. This means, for example, not the number of videos rented but the number of hours people watch videos—because thanks to new technologies, we rent fewer videos (in the shop) but we watch more videos than ever before.
The new way of setting goals is focused on what teams need to achieve and not anymore on what to do . These new goals make it tangible when defining what “winning the game” means. These goals therefore indicate when teams are really successful. Measurable goals that are based on what they have to achieve tend to be stable when the market changes. To put it in other words, agile leaders create an environment in which goals are clear, inspiring, and measurable on what has to be achieved ; this gives a stable direction even though the solution is uncharted and yet unknown. The goals are also stable when new technologies emerge and new possibilities have to be embraced.
![]() Agile leaders create an environment in which goals are clear, inspiring, and measurable on what has to be achieved; this gives a stable direction even though the solution is uncharted and yet unknown.
Agile leaders create an environment in which goals are clear, inspiring, and measurable on what has to be achieved; this gives a stable direction even though the solution is uncharted and yet unknown.
So how can leaders give these types of goals to teams—that provide areas to focus on but also empower them to respond to market changes and new technologies? How can leaders use the collective thinking power of the team to continuously monitor, adapt, and improve while preventing the team from setting the wrong priorities, making the wrong choices, or having the wrong focus? How can leaders give their teams a compass to go in the right direction in uncharted waters?
There is a relatively simple solution to this challenge. In order for teams to measure their success, they have to know that they have to look outside the building. Stop looking at internal KPIs and start looking at the customers. Teams can measure their success by how much impact they have delivered to their customers. When they know that they have made their users more successful or satisfied, they know they are successful themselves. Next, they can use this insight to improve; they can brainstorm and run experiments on how to improve in the next period (more on this topic in Part 3, “Learn Faster”). It’s crucial that the environment in which they work supports focusing on the customer and not on the internal output. A practical tool to change the environment is using a new type of metric. This metric expresses the relation between what the teams deliver, how this benefits the customer, and how that brings value to the company. This is why they need an indicator on the delivered value.
Tool 1: Key Value Indicator
The KVI is the most important indicator for the team to find out whether they generate value. The KVI is preferably one metric, visualized in a trend line, that makes the relationship between customer impact and value for the company tangible. The purpose of this tool is illustrated in Figure 1.1. Teams have to serve customers smarter and better; that generates more value for the company. It is therefore not an internal goal that measures what the team does. Instead, it’s an externally focused goal that measures (directly or indirectly) the behavior of the customers. The KVI is a current figure with which the team can measure the consequences of their actions. Several teams that work on the same customer impact can have the same KVI.
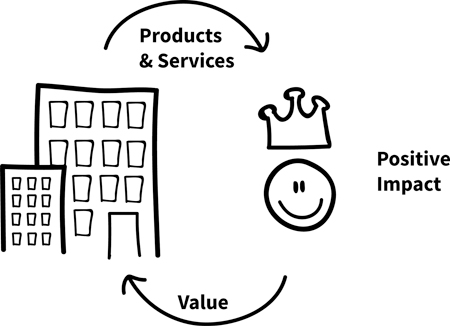
Figure 1.1 Visualization of the KVI
Many companies have been working with KPIs1 or objectives and key results (OKRs)2 for years. The power of these tools is that they give focus. They often measure the efficiency and quality of the internal process. But in a complex and dynamic market, it is important that teams focus on the customer. That is why the KVI is a customer-oriented tool that enhances the power of KPIs and OKRs. When KPIs and OKRs also measure the impact had on the customer, they are probably already KVIs. In other words, the most important KPI that also indicates the positive customer impact and how that brings value to the company is a KVI. Next, I give a few examples of KVIs. Other examples can be found at www.tval.nl.
2. https://rework.withgoogle.com/guides/set-goals-with-okrs/steps/introduction/
Some Examples of KVIs
Some examples of KVIs include the following:
A team that develops an online sports game has, as a KVI, the daily active users (DAU): the number of (millions of) users who play every day. A large proportion of these users just use the game for free, and about 15% have a paid subscription. These more serious gamers bring in the revenue. The percentage has been very stable over the years; as the DAU rose, so did the monthly income. Therefore, the DAU is a proper indicator of delivering value both to the customers and to the company. People who really love the game play it daily. And the more people who play it daily, the higher the revenue.
The DAU was known to everyone. When team members came in the morning, they asked each other about the DAU, and they followed how it developed over the course of the day. New functionalities, improvements, and marketing campaigns were measured in terms of increase (or decrease) of the DAU. New employees are updated on historical increases through good functionalities. Painful drops due to bugs, unsuccessful features, or not responding quickly enough to competitors are shared with a smile and a tear. In Figure 1.2, the rise and fall of the DAU is visualized. As illustrated, several events influenced the DAU.
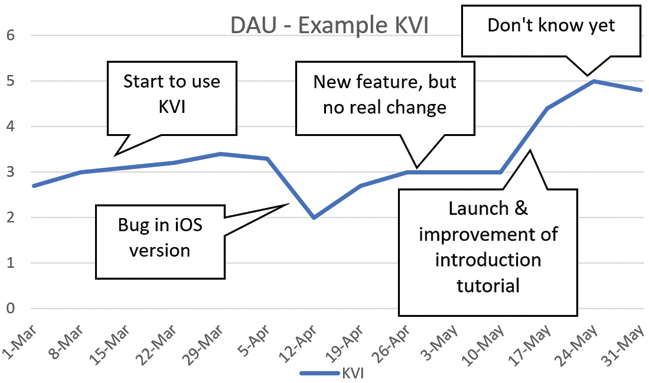
Figure 1.2 Example KVI
A software company is searching for a proper KVI. It has many customers that use its product on a daily or weekly basis. The company used to track the net promotor score (NPS), but over the past months the employees noticed that their NPS wasn’t giving them the insight they needed. Looking at the customers that filled in the NPS, they saw that a very low percentage took the time to give feedback but that most of the not-so-happy customers did take the time. Next they wanted to know the correlation between the amount of the monthly subscription and customer satisfaction. The monthly subscription varied between $10 and more than $5,000 per month. Together with some product managers, they brainstormed on this dilemma. They asked themselves two questions. How can the KVI give insight on the following?
The satisfaction of the vast majority of the customers
The amount spent every month
On a monthly basis, customers would all be queried on their satisfaction. If they give a 7-out-of-10 rating or higher, the monthly subscription counted. The new metric is: ∑€7+, the total monthly subscription of all the 7+ customers. To get more customers’ feedback, they introduced two improvements. First, they would ask more bluntly for a figure between 1 and 10. The relationship managers and customer support employees of course also took notes on the details of this feedback. Next, to improve the interaction with the customers, they started to use tools like UserVoice to give the customers a more tangible platform where they could post ideas and change priorities of the product backlog.
Teams that are jointly responsible for handling support calls have chosen to decrease the number of calls per week per 1,000 customers. This KVI had to decrease to indicate success. By working together with, among other things, sales, IT, and marketing, they started to focus on reducing the number of unnecessary calls. This allowed the teams to give real attention to the customers who still call and give them a positive experience with the company. In other words, thanks to fewer calls, the teams could spend time on customers who really needed their attention and could focus on delivering customer impact.