The Option of Self-Connection
Augusto Voltes-Dorta*; Juan Carlos Martín† * University of Edinburgh, Edinburgh, United Kingdom
† University of Las Palmas De Gran Canaria, Las Palmas, Spain
Abstract
Self-connectivity is a practice when passengers travel with a combination of tickets where the airline(s) involved do not handle the transfer themselves. Leisure travellers are expected to be one of the segments of demand most likely to build their own travel itineraries with self-connections in order to save in air fares. Thus the few European airports that recently started to facilitate this type of travel are heavily focusing the marketing efforts towards holiday routes. This chapter investigates the implications of this new business strategy from the perspective of the destination airports using data on European holiday markets in the Mediterranean region. Using an analysis of potential self-connectivity based on global airline schedules and passenger booking data, the destination airports are ranked according to the potential benefits from self-connectivity by tapping into new origin markets to which they are not connected in the traditional sense. The results from this chapter have important managerial implications with regards to how airports serving tourist destinations can identify new market opportunities.
Keywords
Tourist airports; Self-connectivity; Holiday travel
8.1 Introduction
Airline passengers are always looking for new ways to save in air fares, particularly those travelling for leisure purposes that are very sensitive to airline prices. With the widespread appearance of low-cost services and the concentration of arriving and departing flights in their home bases, many travellers started to create their own itineraries by combining multiple tickets from separate bookings and handling the baggage transfer themselves. This led to the emergence of self-connectivity as a popular way to travel, primarily for individual travellers who exhibit more flexible preferences regarding problematic areas like baggage issues and/or missed flight connections (OAG, 2016). The most common example of a self-connection is a passenger transferring between two low-cost carrier (LCC) flights, since the operation of flight connections has traditionally been considered uncharacteristic of the LCC business model due to cost reasons. However, self-connections can, in practice, apply to any other cases of interline connectivity beyond the scope of airline alliances or partnership agreements—throughout the paper this will be referred to as ‘traditional connectivity’.
Factors like LCC dominance and price-elastic demand point to tourism destinations as the primary beneficiaries of self-connectivity. The scarce literature on the topic, however, places more attention on the opportunities for self-connectivity for the transfer airports than for the actual destinations. This chapter aims to provide a ranking of destination airports in (or around) the Mediterranean region according to the number of potential self-connecting links to origin markets in European countries. On top of the novel focus on destination airports, there is a contribution to the literature by complementing the analysis of airline connectivity with data on actual passenger demand market information data tapes (MIDT) to weight the importance of each origin market. This is a relevant improvement since not all self-connectivity is equally important for a destination airport (some origin markets are more attractive than others). Furthermore, the analysis is not restricted to low-cost connections, as it also included other types of self-connections that passengers can make: LCC with full-service carriers (FSC) and cross-alliance FSC. This leads to a more complete picture of the travel opportunities available to passengers, from which tourism-oriented airports can benefit as well. To that end, a connections-building (CB) algorithm has been developed that combines (MIDT) as well as OAG airline schedules for June 2016.
The rest of the paper is structured as follows: the next section provides a brief revision of the relevant literature on this topic. Thereafter, there is an introduction to the European case study, the supply and demand datasets, as well as the CB methodology. This is followed by the presentation of results, with particular focus on the ranking of airports according to arriving self-connecting frequencies, and a discussion of the main policy and managerial implications. Finally, the last section summarises the primary findings, addresses the limitations of the model, and proposes new paths for future research.
8.2 Background
From an airline perspective, the emergence of self-connectivity fits with the current trend of many LCCs to go ‘hybrid’ and adopt many elements of the business model that is characteristic of full-service network carriers, such as price bundling, codesharing agreements, and connecting flights (Klophaus et al., 2012; Morandi et al., 2015; Fageda et al., 2015; Fichert and Klophaus, 2016). LCC/hybrid carriers like Vueling or Air Berlin did offer connect flights at one time (or indeed still do) in their main bases at Barcelona and Palma de Mallorca airports, respectively. Norwegian also introduced a connecting fee to facilitate transfers between their flights at selected locations and, more recently, the negotiations between Norwegian and Ryanair to develop low-cost long-haul connections at Gatwick airport have surfaced (CNN Money, 2017). The revealed interest by low-cost operators to tap into the market of self-connections capturing some of the rents currently enjoyed by the passenger triggers in part the objective of the research.
The business opportunity of self-connecting passengers has been recently picked up by a few European airports as well, such as London Gatwick and Milano Malpensa, which developed their own platforms to support passengers travelling with a combination of air tickets where the carriers do not provide flight transfers themselves (ViaMilano, 2016). In exchange for a fee (though this can also be offered for free), self-connecting passengers at Gatwick and Milano airports are offered two basic services: (1) baggage transfer between the feeding and the onward flights, and (2) an insurance policy that covers the risk of missing the onward flight in the event of a service disruption (Gattwick Airport, 2015). In order to book these services, passengers must search for flight connections employing dedicated online platforms that present self-connecting options to the passengers automatically. This removes the need for price-sensitive passengers to undertake an additional search effort to build their own travel itineraries and extends the market alternatives provided by online booking systems that mostly report traditional flight connections.1
From an airline perspective, it can be expected that they support these self-connection schemes if the additional interline connectivity brings economies of traffic density to their networks (Starkie, 2007). Airports providing these ‘self-help-hubbing’ services stand to benefit from increased nonaeronautical revenues linked to the extra connecting passengers (Malighetti et al., 2008). However, it is also worth noting the potential benefit to destination airports, which can benefit from more indirect arrivals via self-connections facilitated at other locations.
Several factors point to tourism destinations as the primary beneficiaries of self-connectivity. First, it has long been established that tourism demand is very sensitive to prices and particularly to the cost of travel (Ben-David et al., 2016). Second, holiday travel is a demand segment that, in Europe, has been heavily dominated by point-to-point LCC and charter services with limited traditional flight connectivity (Dobruszkes, 2013). Third, there is evidence that leisure passengers are willing to incur longer travel times in exchange for lower airfares (Fageda et al., 2015; OAG, 2016). Fourth, the advertising of self-connectivity at Gatwick and Milano airports is heavily targeted to Mediterranean tourism destinations, even those that are already well served by direct flights such as Barcelona or Rome (ViaMilano, 2016).
The scarce literature on the topic, however, places more attention on the opportunities for self-connectivity for the transfer airports (where the self-connection takes place) than for the other airports included in the itinerary. The most common methodological approach is to develop a CB algorithm that works with airline schedules to find competitive travel alternatives (Halpern and Graham, 2015). These algorithms search for all possible flight connections between predefined origin and destination airports. A simple approach to determine the validity of the identified connections is to set minimum and maximum connecting times (Seredynski et al., 2014). In this way, Malighetti et al. (2008) found that the majority of airline connectivity in Europe occurs outside the boundaries of airline alliances. Zeigler et al. (2017) also reached the same conclusion by showing that the potential interline connectivity between LCCs is higher than the traditional connectivity of scheduled FSCs in intra-European routes. They also argued that local policy makers should take into consideration these connectivity effects in the design of incentive contracts for LCCs at regional airports due to the ability to boost both originating and connecting traffic.
From the perspective of the hub airports, Malighetti et al. (2008) concluded that airports that are relatively ‘central’ to the European network were the ones with the highest potential for nontraditional connectivity (e.g. Munich, Paris-CDG, Stockholm, Helsinki). More recently, Suau-Sanchez et al. (2016) concluded that the dominance of LCC and reduced airline concentration boost airports’ potential to host self-connections, whilst having a diverse destination mix is not a necessary condition. In addition, whilst long-haul self-connection opportunities are indeed available, most self-connectivity occurs in intraregional markets. Using a larger dataset of airline schedules, Maertens et al. (2016) found that the European LCC network has indeed increased its potential for self-connectivity in the last decade, and also identified Barcelona, Gatwick, and Stansted as the airports with the highest number of low-cost transfer opportunities. This paper went a step further providing information about the largest origin and destination markets by number of potential low-cost connections. Several airports serving tourism destinations appear in the top positions, like Barcelona, Malaga, Ibiza, or Catania. This indicates that the Mediterranean region is ripe for self-connectivity, as further confirmed by Suau-Sanchez et al. (2017), which also focused on ranking potential transfer airports in holiday markets.
Building on the concepts and methods developed by the studies before, this chapter provides a ranking of destination airports in (or around) the Mediterranean region according to the number of self-connecting links to European origin markets. From the perspective of airport operators and local tourism authorities, this type of analysis can be useful to obtain insights on the potential economic benefits brought by new flights, particularly if the destination is geographically isolated (e.g. island) and/or distant from major metropolitan centres (Suau-Sanchez and Burghouwt, 2012). The increased indirect connectivity brought by self-connections can improve the region’s competitiveness as tourism destination (Hall, 2009).
8.3 Data and Methodology
8.3.1 Case Study and Datasets
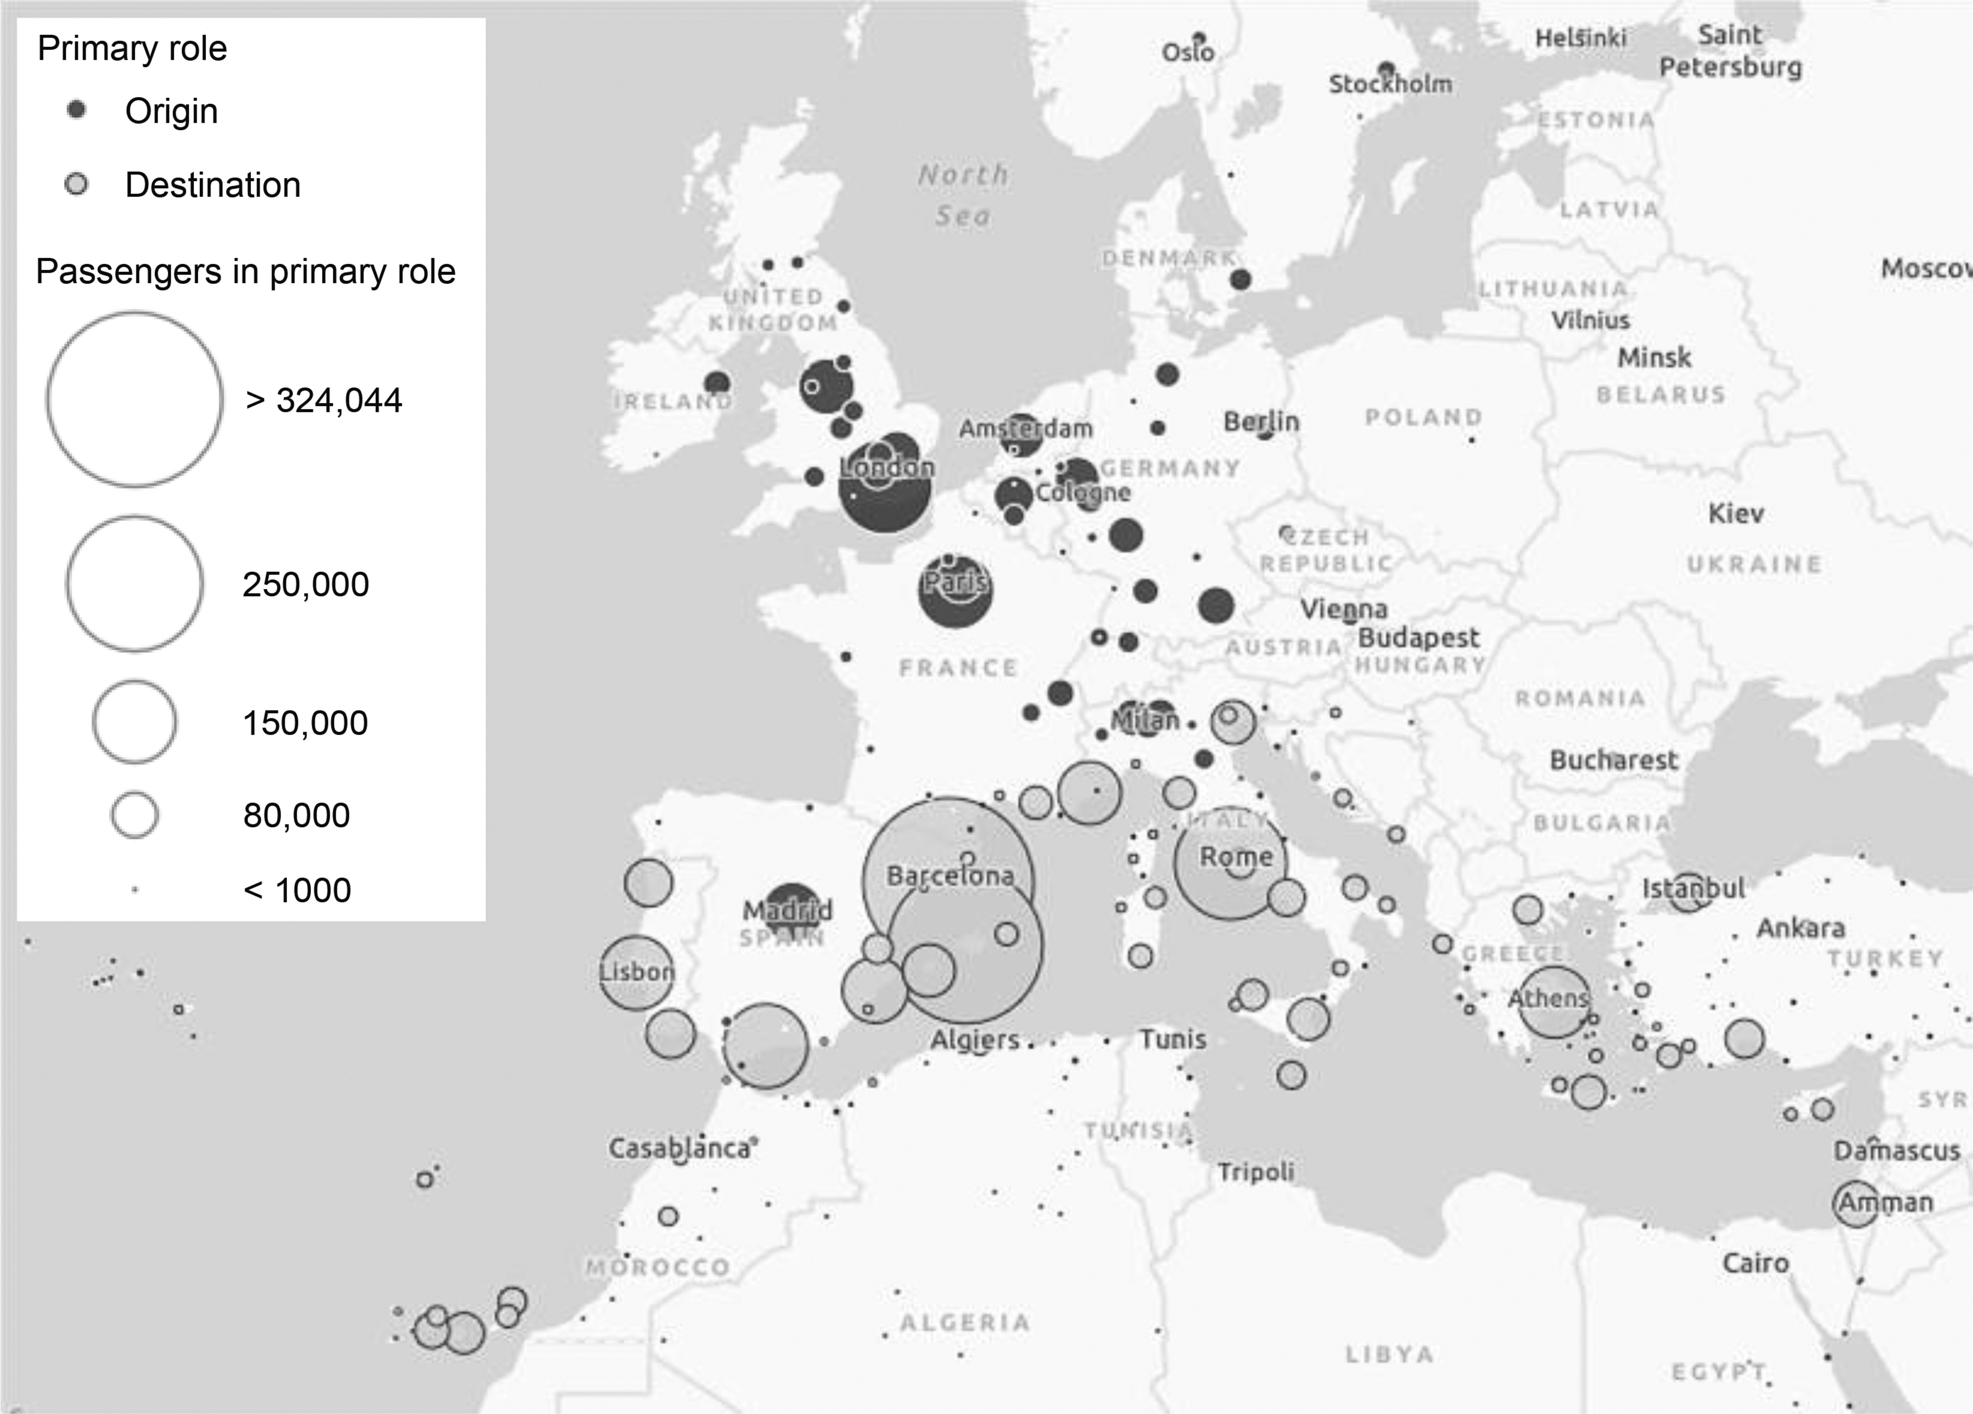
The geographical dimension of the case study is delimited by the chosen origin and destination markets. The origin markets are represented by all commercial airports located in the European Economic Area. The destination markets are represented by all commercial airports serving coastal destinations in (or around) the Mediterranean region. The size of each origin market is measured by the total number of passenger bookings travelling from the relevant airport to the selected coastal destinations during the first week of June 2016. June is chosen as the sample month because its traffic level is the closest to the annual monthly average for the sample markets. Fig. 8.1 shows all airports included in our analysis according to the primary role as points of origin or destination. Data was available from these countries: Morocco, Algeria, Malta, Egypt, Jordan, Israel, Lebanon, Cyprus, Turkey, Greece, Croatia, Italy, France, Monaco, Spain, Gibraltar, and Portugal. All island destinations in these countries are included, even the Atlantic ones (Canaries, Madeira, and Azores). For mainland Spain, France, and Italy, only the airports serving Mediterranean destinations are designed as such (see the Appendix for more details).
The MIDT dataset includes 4.1 million passenger bookings in the above-defined markets obtained from the OAG Traffic Analyser. Each record contains information on the operating airlines, as well as the points of origin and destination, the connecting airports (up to two intermediate stops), and the number of passengers. The original sources of information for the MIDT dataset are Global Distributions Systems (GDSs) such as Galileo, Saber, or Amadeus, amongst others. MIDT is a common data source in the construction of airport route development reports (Halpern and Graham, 2015) and similar datasets have been employed in past studies to calculate air transport connectivity (e.g. Suau-Sanchez et al., 2016, 2017). However, the original sources of information beg the question as to whether LCCs would be adequately represented in the dataset since they are much less likely to use GDSs as distribution channel. In order to address this limitation, the raw data on passenger bookings has been adjusted by the provider (OAG Traffic Analyser) using a proprietary algorithm based on frequencies and supplied seats in each flight sector. The reliability of these adjustments was checked by calculating the overall market share of LCCs in intra-European markets that results from the adjusted MIDT data. Results were consistent with values reported by the European Commission (EC, 2014).
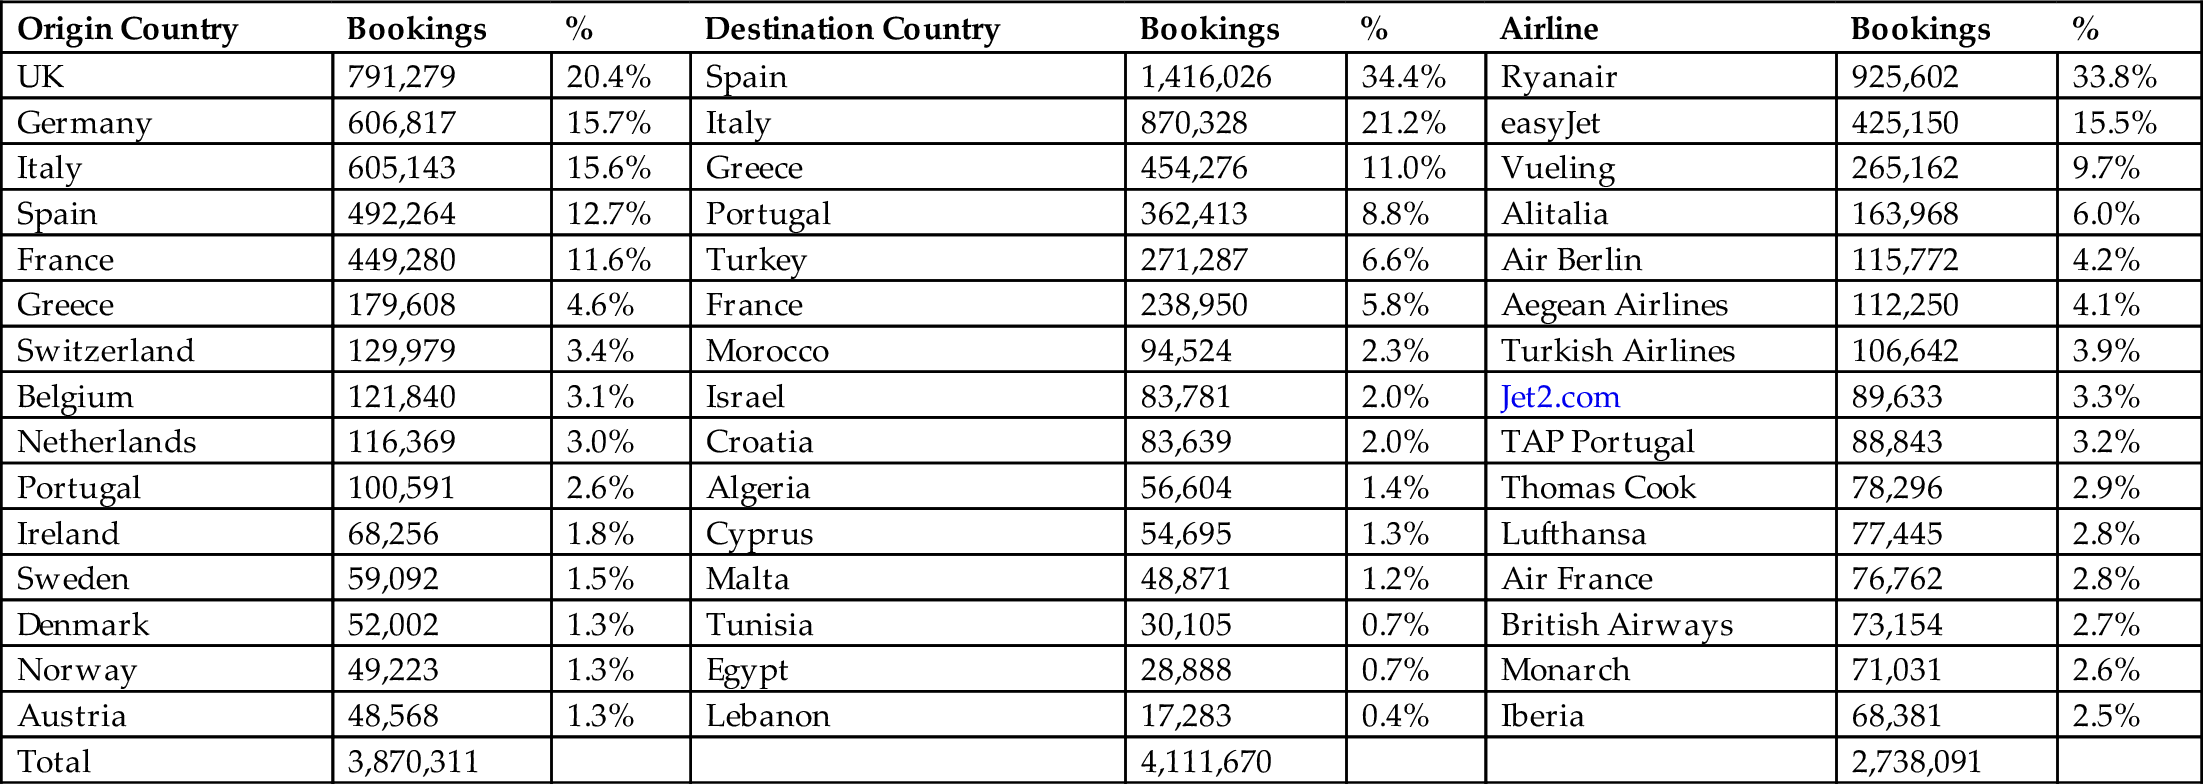
Table 8.1 provides a breakdown of bookings for the top 15 airlines, origin, and destination countries in our sample. United Kingdom, Italy, and Germany are the largest generators of air travel to Mediterranean destinations. Spain, Italy, and Greece are the top traffic attractors on the European side, whilst Morocco is the top destination on the African side. As expected, intra-European markets are dominated by LCCs such as Ryanair and easyJet, which supports the hypothesis that a large number of self-connecting opportunities will be found amongst these airlines that do not typically operate transfer flights.
Table 8.1
| Origin Country | Bookings | % | Destination Country | Bookings | % | Airline | Bookings | % |
|---|---|---|---|---|---|---|---|---|
| UK | 791,279 | 20.4% | Spain | 1,416,026 | 34.4% | Ryanair | 925,602 | 33.8% |
| Germany | 606,817 | 15.7% | Italy | 870,328 | 21.2% | easyJet | 425,150 | 15.5% |
| Italy | 605,143 | 15.6% | Greece | 454,276 | 11.0% | Vueling | 265,162 | 9.7% |
| Spain | 492,264 | 12.7% | Portugal | 362,413 | 8.8% | Alitalia | 163,968 | 6.0% |
| France | 449,280 | 11.6% | Turkey | 271,287 | 6.6% | Air Berlin | 115,772 | 4.2% |
| Greece | 179,608 | 4.6% | France | 238,950 | 5.8% | Aegean Airlines | 112,250 | 4.1% |
| Switzerland | 129,979 | 3.4% | Morocco | 94,524 | 2.3% | Turkish Airlines | 106,642 | 3.9% |
| Belgium | 121,840 | 3.1% | Israel | 83,781 | 2.0% | Jet2.com | 89,633 | 3.3% |
| Netherlands | 116,369 | 3.0% | Croatia | 83,639 | 2.0% | TAP Portugal | 88,843 | 3.2% |
| Portugal | 100,591 | 2.6% | Algeria | 56,604 | 1.4% | Thomas Cook | 78,296 | 2.9% |
| Ireland | 68,256 | 1.8% | Cyprus | 54,695 | 1.3% | Lufthansa | 77,445 | 2.8% |
| Sweden | 59,092 | 1.5% | Malta | 48,871 | 1.2% | Air France | 76,762 | 2.8% |
| Denmark | 52,002 | 1.3% | Tunisia | 30,105 | 0.7% | British Airways | 73,154 | 2.7% |
| Norway | 49,223 | 1.3% | Egypt | 28,888 | 0.7% | Monarch | 71,031 | 2.6% |
| Austria | 48,568 | 1.3% | Lebanon | 17,283 | 0.4% | Iberia | 68,381 | 2.5% |
| Total | 3,870,311 | 4,111,670 | 2,738,091 |
(Source: MIDT)
Further exploration of the demand dataset allows disaggregation of passenger bookings according to the type of itinerary. The vast majority of bookings (90.6%) are for nonstop travel, which is not surprising due to the relatively short travel distances around the Mediterranean. However, the amount of connecting passengers is not negligible (387 thousand per week) and represents an attractive segment of demand that destination airports could benefit from if self-connections become widespread in Europe.
The CB algorithm is built on a dataset of global flight schedules during the first week of June 2016, whose primary source is the OAG Schedules dataset. After simple data processing, the supply dataset comprises 655,987 unique records of scheduled passenger flight departures for 747 airlines that offered 89.7 million seats across a network of 2998 commercial airports. Each record indicates the operating airline, alliance membership (if applicable), flight number, origin and destination airport codes, aircraft type, number of seats, flight distance, departure and arrival times, and departure and arrival terminals (if applicable). Finally, there is also a dataset of minimum connecting times, including the airports’ default values plus around 68,000 airline-specific exceptions. This was obtained from the OAG Connections Analyser.
8.3.2 Connection Builder
A CB algorithm was employed to find valid travel itineraries in the relevant markets. The parameters of the CB algorithm are summarised in Table 8.2. For each potential airport-pair combination between the sample airports (including those without MIDT passenger bookings), a search is made in the schedules dataset for all valid nonstop and one-stop flight combinations from the origin airport to the destination airport. No interline restrictions are imposed. For a traditional flight combination to be valid, it must meet the published minimum connecting times. For a self-connection itinerary, minimum connecting times are left-truncated at 2 hours. A flight combination is labelled as ‘self-connecting’ if either: (1) both arriving and departure airlines are LCCs (as indicated by ICAO, 2014), except the connecting services provided by Vueling at Barcelona, Air Baltic at Riga, and Eurowings at several of its German bases; or (2) the arriving and departure airlines are not part of the same alliance, except if the interline connection (e.g. as a result of codesharing out-of-alliance) is recorded in the minimum connecting times file as an exception.
Table 8.2
| 1. No interline restrictions |
| 2. Published minimum connecting times must be met (minimum 2 h for self-connections) |
| 3. Maximum geographic detour per origin–destination market (calculated from MIDT itineraries) |
| 4. Maximum travel time increase per origin–destination market |
| 4a. Based on best weekly traditional connecting time (+ 1 h) in each individual itinerary |
First, in order to discard unrealistic flight combinations (Redondi et al., 2011; Seredynski et al., 2014; Grosche and Klophaus, 2015), maximum geographic detours and travel time increases are imposed. For airport pairs with MIDT bookings, a market-specific maximum geographic detour (ratio between indirect and nonstop flight distance) is calculated based on the real-world itineraries in the MIDT file. Second, a maximum travel time increase (ratio between total indirect travel time, including flight connections, and nonstop travel time) is calculated as the maximum travel time increase of all traditional flight combinations within a one-hour window with respect to the best weekly indirect travel time in each itinerary. The goal is to keep only the self-connecting flight combinations that are competitive in the sense that there is evidence that passengers are willing to accept these geographic detours and travel time increases in traditional flight connections. For airport pairs without MIDT bookings, the maximum geographic and travel time detours for indirect itineraries are determined by combining the individual maximum detours observed at the origin and destination airports, calculated separately from the existing MIDT records. The smallest values between the origin and destination airports will be used as the reference detours for the airport-pair itineraries without MIDT traffic. These itineraries are indeed relevant for the analysis because they signal an opportunity for the destination airport to tap into new origin markets from which they are not currently receiving any passengers despite having valid flight connections to it. The outcome of this stage is a dataset of 576,061 unique flight itineraries that the CB identified as valid travel options within the selected airport-pair markets.
The next section aggregates these itineraries by destination airport and identifies the places with the highest development potential via self-connections, in terms of both available indirect frequencies and the ability to tap into additional pockets of passenger demand all over the European Economic Area. To that end, several simple indicators will be calculated: (1) Total arriving self-connecting frequencies (split between origin markets already served and new origin markets). (2) Number or ‘hubs’ that are linking the airport to new European origin markets via self-connectivity. (3) Hub leverage: ratio between new origin markets and number of hubs. This number provides an indication of how many new markets can be reached for each direct transport link to a European hub. To the extent a given hub is also the main base of a LCC, the results provide a measurement of how valuable it is, on average, for the destination airport to maintain its relationship with the LCCs that are creating these self-connecting travel opportunities, both within their own networks or in combination with onward carriers. (4) Coverage of origin markets: indicates the proportion of total potential European passenger demand that the destination airport is connected to. The size of each origin market is measured by the total number of passenger bookings departing from a given origin airport. This figure is split in two components: current markets (origin points already being served as per the MIDT data) and new markets (new origin points not served and only reachable by self-connection). A large increase in coverage means that the relevant carriers can self-connect passengers from large origin markets that are not currently served directly or by means of traditional connections. (5) Largest self-connecting airline (this refers to the airline that operates the second leg of the flight that arrives to the tourism destination), with an indication of the amount and percentage of self-connecting frequencies to new origin points. In most cases, this number becomes a second measurement of the potential value of low-cost self-connections to the destination airport.
8.4 Results and Discussion
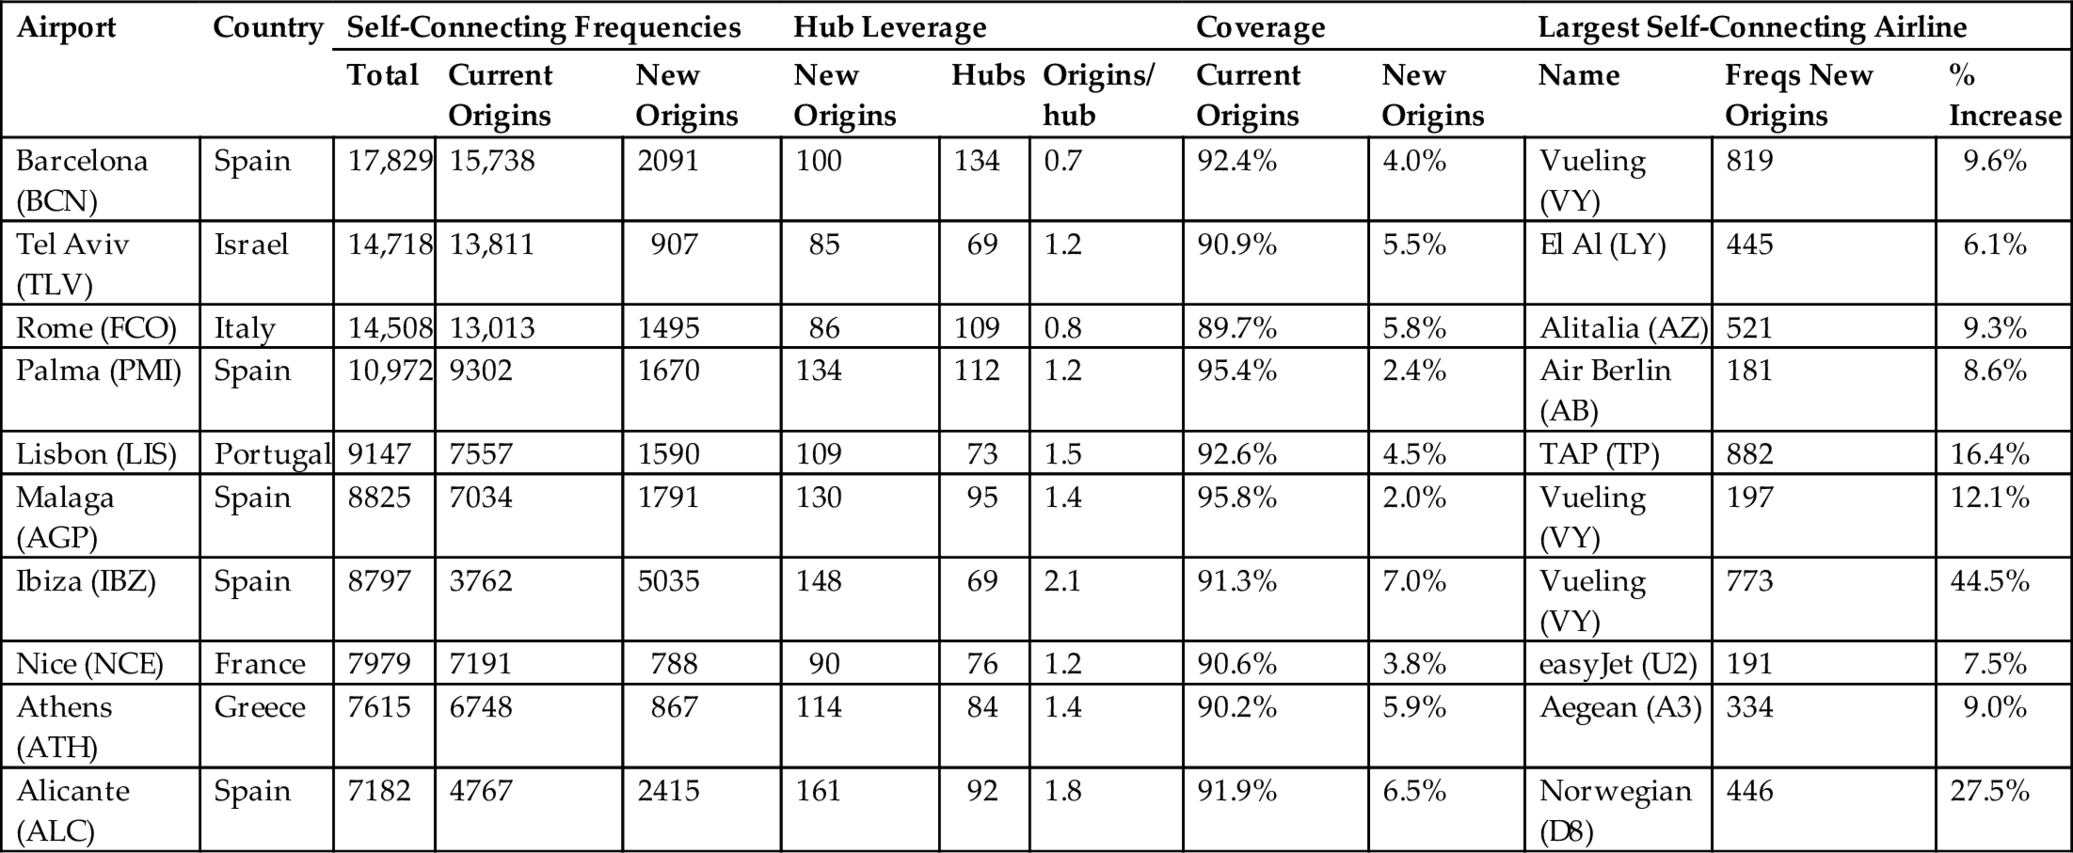
Table 8.3 presents the ranking for the top 10 destination airports according to the number of arriving self-connecting itineraries from European markets. Similar to the results of Maertens et al. (2016), the results reveal that airports in major tourism destinations like Barcelona, Tel Aviv, Rome, or Palma de Mallorca are amongst the ones that would receive the largest amount of self-connecting frequencies, ranging from 10 up to 16 thousand different one-stop itineraries per week. This is largely due to the strong complementarity between their home carriers’ schedules (i.e. Vueling, Alitalia, and Air Berlin, respectively) with the schedules of other nonpartner airlines that create self-connecting opportunities elsewhere. The vast amount of self-connecting frequencies, however, is not particularly beneficial for the major airports due to the overlap with origin markets already served with nonstop flights or traditional connections (this is seen in the low proportion of ‘new origins’ over ‘total’ under ‘self-connecting frequencies’). Indeed, large European airports are well connected to the rest of the continent. For the top three airports mentioned before, the increase in demand coverage ranges between 2.4% and 5.8%, whilst the largest benefit belongs to Ibiza Airport (Spain) with 7% (see ‘new origins’ column under ‘coverage’). This means that self-connections arriving at Ibiza connect that airport to new origin markets that represent 7% of the total passenger demand to Mediterranean destinations. This small contribution is also seen in the hub leverage indicators, as most large tourism destinations can only self-connect to between one and two new origin markets per associated hub (see ‘origins/hub’ column under ‘hub leverage’). Thus it is clear that the benefit of self-connections, if evaluated at the destination level, is not going to be concentrated in the large airports, despite the large number of itineraries coming in.
Table 8.3
| Airport | Country | Self-Connecting Frequencies | Hub Leverage | Coverage | Largest Self-Connecting Airline | |||||||
|---|---|---|---|---|---|---|---|---|---|---|---|---|
| Total | Current Origins | New Origins | New Origins | Hubs | Origins/ hub | Current Origins | New Origins | Name | Freqs New Origins | % Increase | ||
| Barcelona (BCN) | Spain | 17,829 | 15,738 | 2091 | 100 | 134 | 0.7 | 92.4% | 4.0% | Vueling (VY) | 819 | 9.6% |
| Tel Aviv (TLV) | Israel | 14,718 | 13,811 | 907 | 85 | 69 | 1.2 | 90.9% | 5.5% | El Al (LY) | 445 | 6.1% |
| Rome (FCO) | Italy | 14,508 | 13,013 | 1495 | 86 | 109 | 0.8 | 89.7% | 5.8% | Alitalia (AZ) | 521 | 9.3% |
| Palma (PMI) | Spain | 10,972 | 9302 | 1670 | 134 | 112 | 1.2 | 95.4% | 2.4% | Air Berlin (AB) | 181 | 8.6% |
| Lisbon (LIS) | Portugal | 9147 | 7557 | 1590 | 109 | 73 | 1.5 | 92.6% | 4.5% | TAP (TP) | 882 | 16.4% |
| Malaga (AGP) | Spain | 8825 | 7034 | 1791 | 130 | 95 | 1.4 | 95.8% | 2.0% | Vueling (VY) | 197 | 12.1% |
| Ibiza (IBZ) | Spain | 8797 | 3762 | 5035 | 148 | 69 | 2.1 | 91.3% | 7.0% | Vueling (VY) | 773 | 44.5% |
| Nice (NCE) | France | 7979 | 7191 | 788 | 90 | 76 | 1.2 | 90.6% | 3.8% | easyJet (U2) | 191 | 7.5% |
| Athens (ATH) | Greece | 7615 | 6748 | 867 | 114 | 84 | 1.4 | 90.2% | 5.9% | Aegean (A3) | 334 | 9.0% |
| Alicante (ALC) | Spain | 7182 | 4767 | 2415 | 161 | 92 | 1.8 | 91.9% | 6.5% | Norwegian (D8) | 446 | 27.5% |
A second way to approach this analysis is to rank the sample destinations according to the potential to reach unserved markets. These results are presented in Table 8.4 and now include the top 20 airports sorted in descending order by the percentage increase in demand coverage from self-connecting frequencies (see ‘new origins’ column under ‘coverage’). The figures reveal that the airports that stand to benefit the most are those in Northern African destinations, such as Morocco or Algeria, and well as Greek, Italian, and Spanish islands. Amongst the top destinations, Zakynthos (Greece), Constantine (Algeria), and Paphos (Cyprus), which are currently self-connected to unserved origin points, represent between 27% and 42% of the total European demand.2 In these cases, most of the valid self-connecting frequencies are indeed to new origin markets so there is an interesting potential to develop these opportunities that are ‘hidden’ in the complexity of European airline schedules. Table 8.4 also presents how these airports have a much higher level of hub leverage, potentially reaching by self-connection between three and four new origin markets for each existing link to a European gateway (in the top cases above 10 new origin markets—see ‘origins/hub’ column under ‘hub leverage’). Of all the different regions, Spanish islands, such as Menorca, Fuerteventura, or Lanzarote benefit slightly less due to their good connectivity to the continent.
Table 8.4
| Airport | Country | Self-Connecting Frequencies | Hub Leverage | Coverage | Largest Self-Connecting Airline | |||||||
|---|---|---|---|---|---|---|---|---|---|---|---|---|
| Total | Current Origins | New Origins | New Origins | Hubs | Origins/hub | Current Origins | New Origins | Name | Freqs New Origins | % Increase | ||
| Nador (NDR) | Morocco | 1141 | 131 | 1010 | 139 | 11 | 12.6 | 33.8% | 57.1% | Air Arabia Maroc (3O) | 708 | 89.6% |
| Girona (GRO) | Spain | 1117 | 94 | 1023 | 132 | 31 | 4.3 | 32.0% | 46.7% | Ryanair (FR) | 593 | 91.1% |
| Constantine (CZL) | Algeria | 1599 | 200 | 1399 | 108 | 10 | 10.8 | 45.4% | 41.9% | Air Algerie (AH) | 1206 | 87.3% |
| Paphos (PFO) | Cyprus | 2799 | 733 | 2066 | 144 | 30 | 4.8 | 53.4% | 32.0% | easyJet (U2) | 567 | 74.7% |
| Zakynthos (ZTH) | Greece | 1420 | 238 | 1182 | 134 | 36 | 3.7 | 56.7% | 27.8% | Thomas Cook (MT) | 327 | 94.8% |
| Hurghada (HRG) | Egypt | 1595 | 440 | 1155 | 111 | 28 | 4.0 | 64.1% | 26.7% | Condor (DE) | 137 | 46.4% |
| Chania (CHQ) | Greece | 2029 | 720 | 1309 | 174 | 45 | 3.9 | 66.8% | 25.6% | Ryanair (FR) | 355 | 65.4% |
| Brindisi (BDS) | Italy | 1903 | 435 | 1468 | 106 | 24 | 4.4 | 71.3% | 23.3% | Ryanair (FR) | 642 | 85.7% |
| Kos (KGS) | Greece | 2173 | 533 | 1640 | 160 | 51 | 3.1 | 72.5% | 22.4% | Thomson (TOM) | 399 | 92.6% |
| Tenerife Norte (TFN) | Spain | 2680 | 1472 | 1208 | 63 | 14 | 4.5 | 69.5% | 22.2% | Binter Canarias (NT) | 486 | 47.7% |
| Lamezia Terme (SUF) | Italy | 2063 | 791 | 1272 | 92 | 27 | 3.4 | 74.0% | 19.3% | Alitalia (AZ) | 321 | 47.1% |
| Algiers (ALG) | Algeria | 5635 | 4152 | 1483 | 100 | 40 | 2.5 | 79.8% | 16.9% | Air Algerie (AH) | 875 | 23.0% |
| Beirut (BEY) | Lebanon | 4067 | 3009 | 1058 | 106 | 30 | 3.5 | 77.1% | 16.9% | Middle East Airl. (ME) | 454 | 21.2% |
| Menorca (MAH) | Spain | 3295 | 1690 | 1605 | 143 | 50 | 2.9 | 79.4% | 16.5% | Air Europa (UX) | 254 | 29.6% |
| Olbia (OLB) | Italy | 3241 | 2231 | 1010 | 116 | 46 | 2.5 | 77.7% | 16.2% | Meridiana fly (IG) | 362 | 22.3% |
| Casablanca (CMN) | Morocco | 6734 | 4914 | 1820 | 142 | 50 | 2.8 | 81.8% | 15.9% | Royal Air Maroc (AT) | 1425 | 27.0% |
| Lanzarote (ACE) | Spain | 3742 | 1853 | 1889 | 157 | 52 | 3.0 | 82.0% | 15.6% | Ryanair (FR) | 377 | 53.0% |
| Fuerteventura (FUE) | Spain | 2903 | 1356 | 1547 | 140 | 53 | 2.6 | 80.4% | 15.1% | TUIfly (X3) | 250 | 54.5% |
| Heraklion (HER) | Greece | 7142 | 1709 | 5433 | 168 | 73 | 2.3 | 81.0% | 15.1% | Aegean Airlines (A3) | 918 | 68.1% |
| Kerkyra (CFU) | Greece | 3070 | 1286 | 1784 | 175 | 66 | 2.7 | 77.8% | 15.0% | easyJet (U2) | 459 | 76.0% |

Whilst the new origin markets reached via self-connections depend on the destination under analysis and its existing flight network, it is worth separating them in two broad categories: (i) smaller markets in Eastern European countries that become more accessible and (ii) new points in countries already accessible from the destination that nonetheless represent larger origin markets. More insight is provided in Figs 8.2–8.5 that show the detailed results for four case study destinations: Lanzarote (Canary Islands, Spain), Heraklion (Crete, Greece), Olbia (Sardinia, Italy), and Casablanca (Morocco).

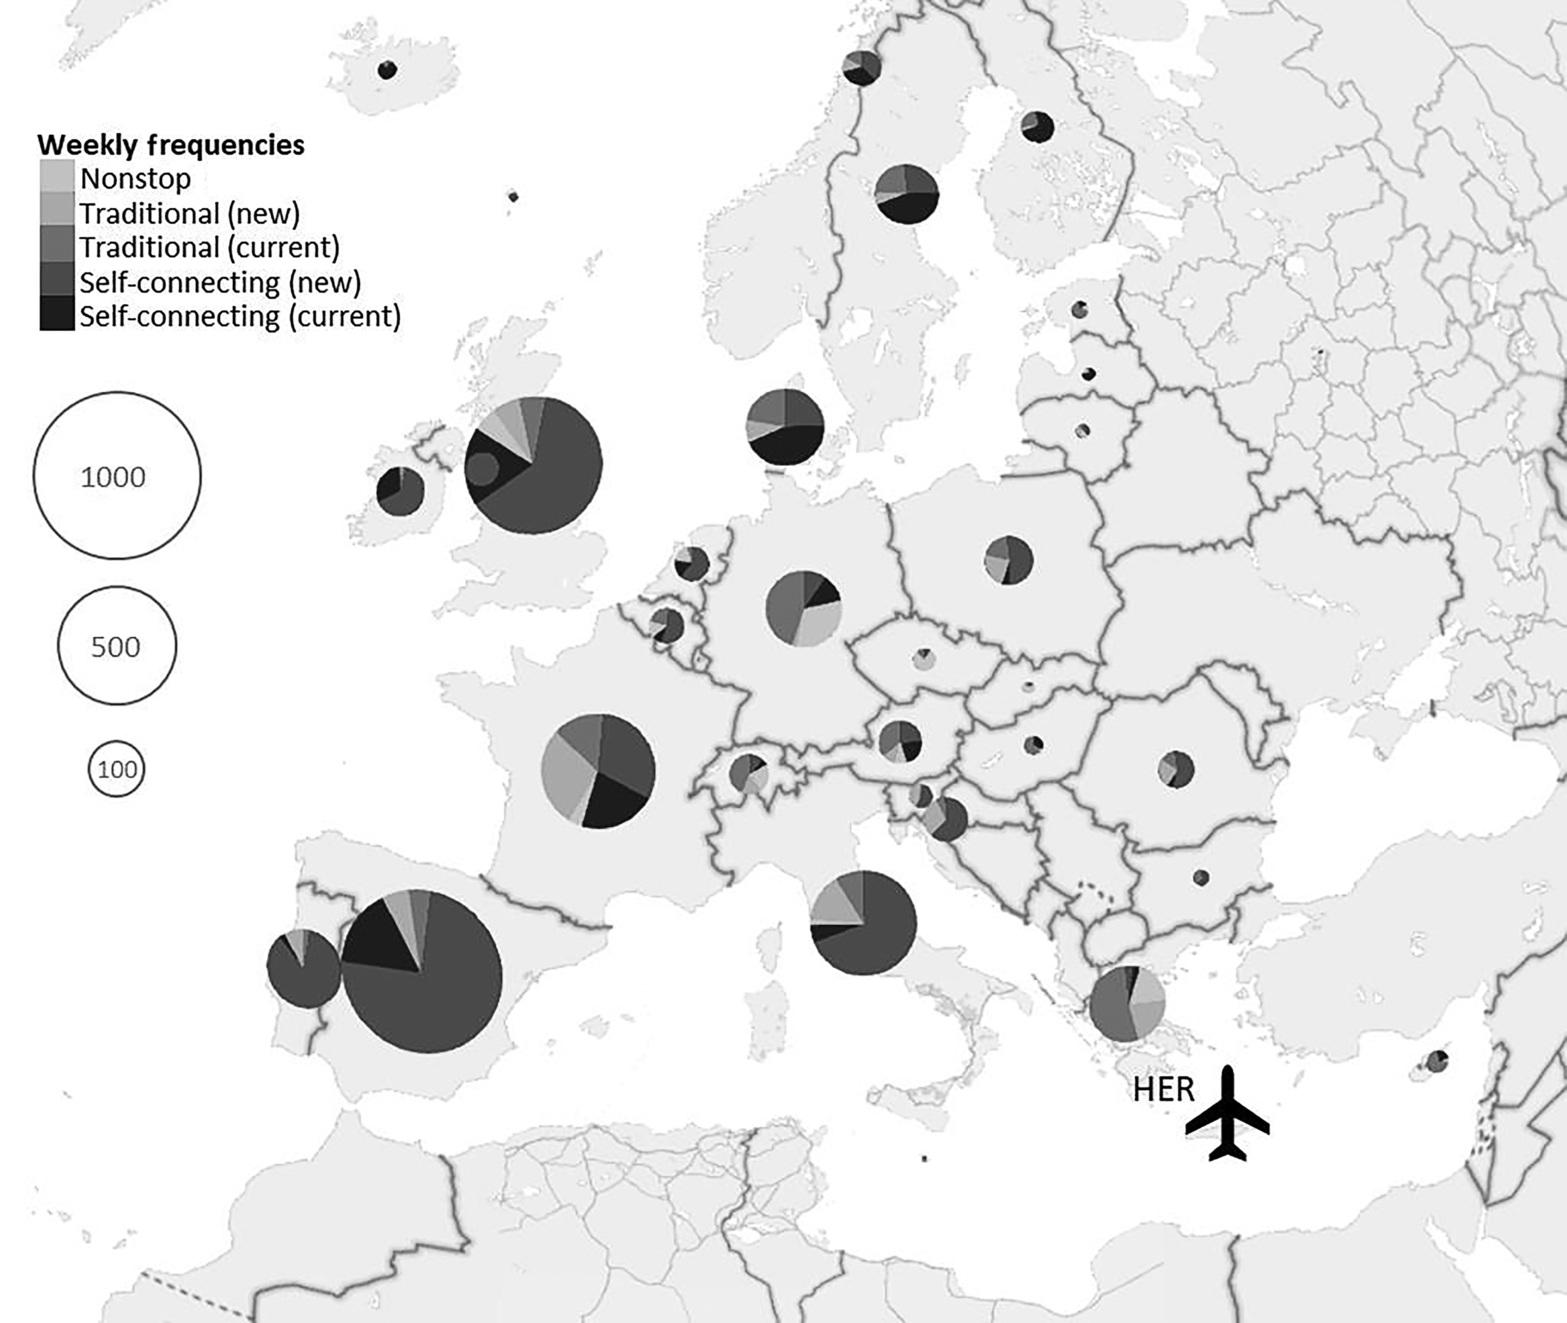

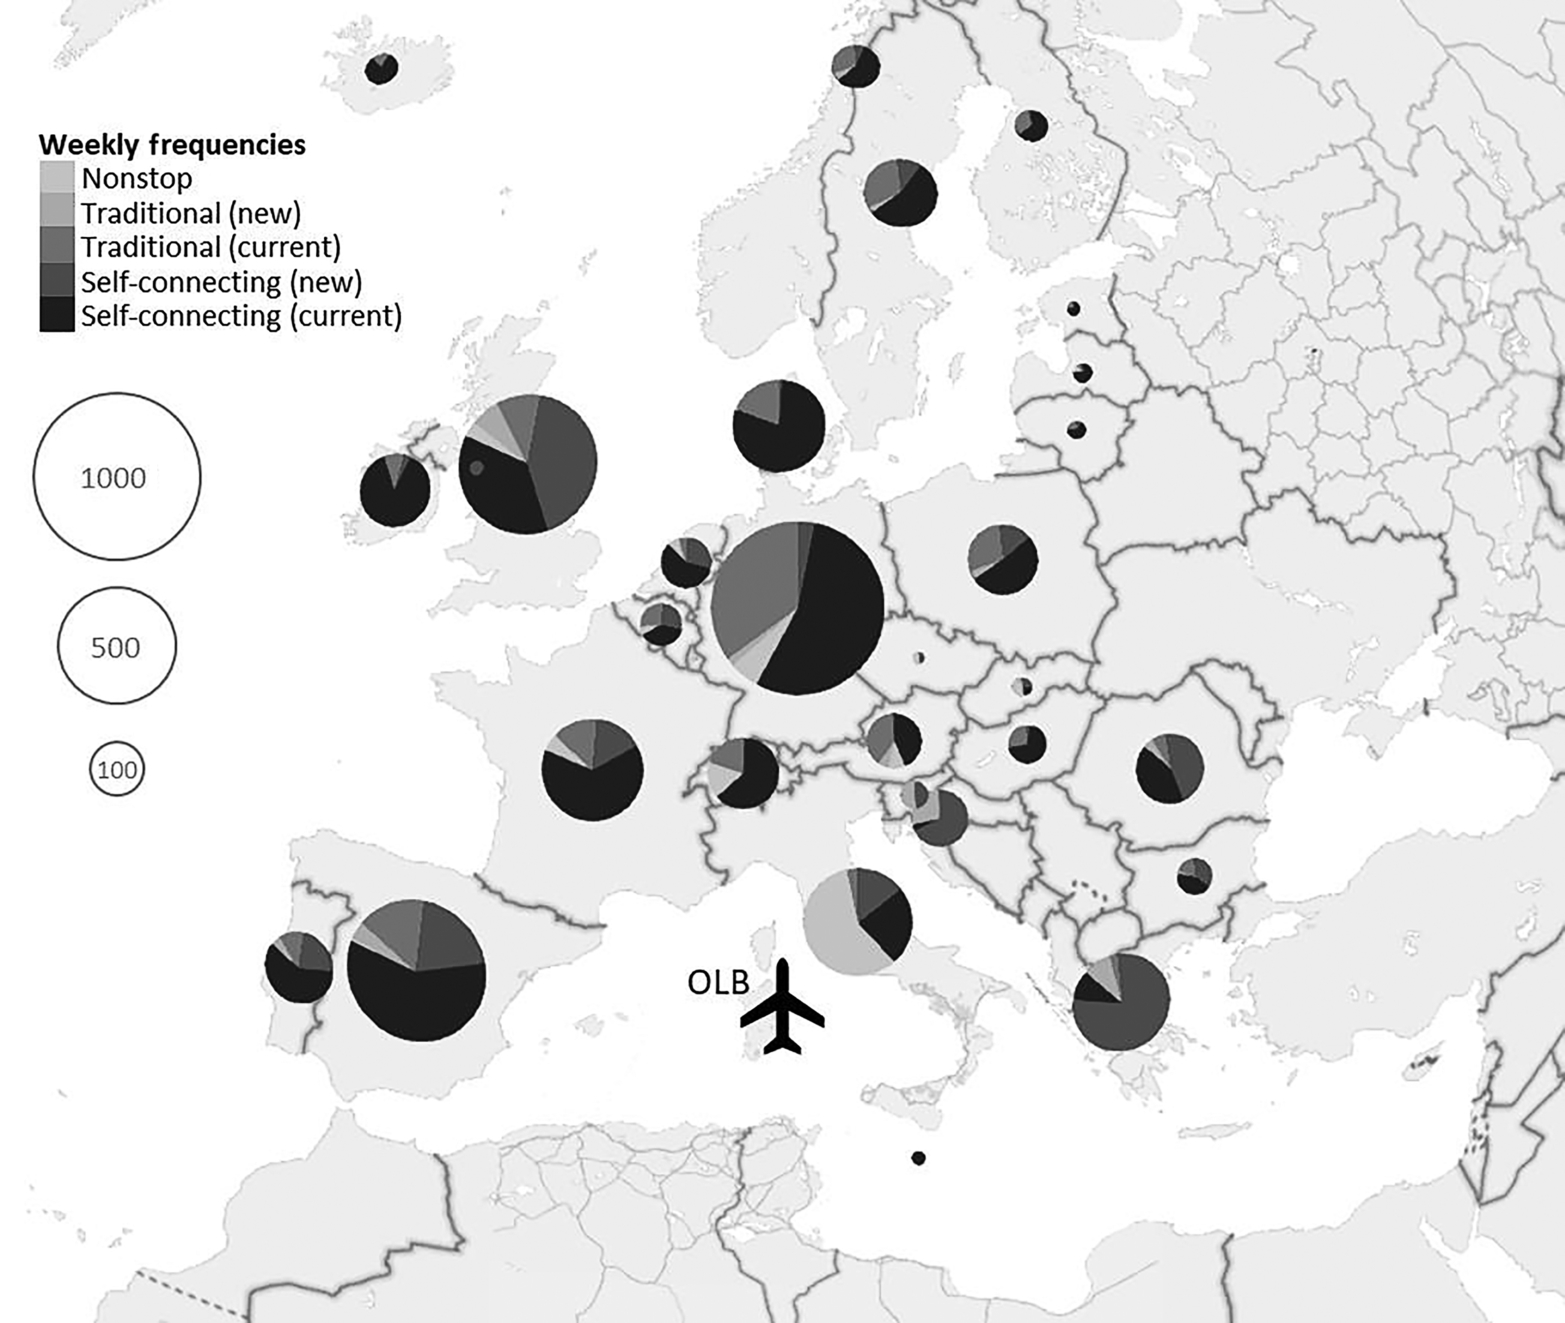
Lanzarote airport (ACE) serves the homonymous Spanish island, located off the Atlantic coast of Morocco and with an economy largely based on tourism. With a level of traffic in excess of 5 million annual passengers, the airport is well connected directly to its main origin markets: United Kingdom, Mainland Spain, and Germany. However, self-connectivity can open the door to markets in the Baltic countries, Poland, and Iceland, whilst also helping to reach more origin points in larger markets like the United Kingdom, Italy, and Greece. Heraklion (HER) is the main airport in the Greek island of Crete and serves around 6 million annual passengers with strong seasonality. The picture drawn by the results is different than in the case before, the Eastern European markets present much less frequencies, whilst the bulk of new origin points clearly shifts to Western Europe: Spain, France, Italy, United Kingdom, and Portugal. Casablanca (CMN) is the largest of the four selected airports, with recorded levels of traffic above 8 million annual passengers and the lowest seasonal effects as it serves not only a well-developed tourism destination but also the largest city and economic capital of Morocco. Olbia (OLB), on the other hand, is a relatively smaller airport, serving around 2 million annual passengers, most of them holiday travellers. In both airports, the distribution of frequencies to new origin markets is clearly concentrated in the United Kingdom. Thus it appears that, from an origin markets perspective, budget holidaymakers from British secondary cities are the ones that could benefit the most from self-connections, particularly if departing from airports dominated by LCCs. This result makes sense due to the congestion at London Heathrow steadily pushing regional frequencies outside the UK’s primary hub and the drastic reduction of domestic ‘traditional’ connectivity.
In view of these results, it is clear that self-connectivity uncovers new potential origin points that the airports and airlines may want to target. As presented in Table 8.4, frequencies to new origin markets by the primary carriers at each airport represent between 20% and 95% of their total self-connecting frequencies (%increase column). In addition, note that self-connectivity is not the exclusive territory of LCCs (such as Ryanair and easyJet) and full-service airlines (e.g. Alitalia) can also be relevant in this area. Depending on the attractiveness of the markets, the airlines could use these arguments to negotiate more favourable economic conditions with airport operators or local tourism authorities. In that regard, it is also worth mentioning the case of Girona (GRO), which is second overall in the ranking. After being one of the major Ryanair bases for many years, the LCC significantly cut its frequencies at GRO in favour of the primary airport in Barcelona (Dobruszkes et al., 2017). This substantially reduced its connectivity to European origin markets. The demand coverage in June 2016 was only 32%, but self-connections can help the airport tap into an additional 46.7% pocket of demand. The fact that these frequencies are provided primarily by Ryanair helps to put into perspective the role that the LCC can still play at the airport despite the sharp reduction in the number of nonstop flights. In the current context of projected congestion at Barcelona airport, the objective of making GRO a stronger alternative to the primary destination in the region could benefit from self-connectivity, particularly if the itineraries are competitive in terms of pricing, and access times to Barcelona are improved with the opening of the new high-speed rail station at GRO airport that is projected.
8.5 Conclusion
This chapter aims to provide a ranking of airport destinations in (or around) the Mediterranean region according to the increase in indirect connectivity to origin markets created by the availability of self-connecting travel options for leisure passengers. The paper aims to fill a gap in the literature by shifting the focus on the analysis from the intermediate airports (where the self-connection takes places) to the destination airport. Furthermore, the analysis is not restricted to low-cost connections, but also includes other types of self-connections that passengers can make, such as low cost with full service. In order to judge the attractiveness of each new origin market, data on actual passenger demand (MIDT) for June 2016 is combined with OAG Schedules to identify the self-connecting frequencies.
Results show that airports in major destinations, like Barcelona, Rome, or Palma de Mallorca, are amongst the ones that would receive the most self-connecting frequencies, largely due to the complementarity between their home carriers’ schedules with the schedules of other nonpartner airlines. This vast amount of self-connections, however, is not particularly beneficial due to the overlap with origin markets already served with traditional connections. When ranking the sample destinations according to the potential to reach unserved markets, the figures reveal that the airports that stand to benefit the most are those in Northern African destinations, such as Morocco, and well as Greek, Italian, and Spanish islands. These destinations could leverage up to four new origin markets for each existing link to a European gateway, thus enhancing their own competitiveness on account of the improved accessibility. Whilst the new markets reached via self-connections depend on the destination under analysis, it is worth separating them in two broad categories: (i) smaller markets in Eastern European countries that become more accessible and (ii) new points in countries already accessible that nonetheless represent larger origin markets, particularly within the United Kingdom.
Tourism authorities in destination cities may want to target the new ‘hidden’ markets with dedicated marketing campaigns. If the potential size of the new market is sufficiently large, for example, secondary UK cities, these campaigns could be carried out in the origin airports. However, for most new markets in Eastern Europe that are not particularly large, promotion of self-connecting routes could be delivered more efficiently by consolidating efforts at the relevant hubs with the collaboration of the operating airline(s). Depending on the actual figures, LCCs (and their self-connection partners) could use their ‘hub leverage’ to negotiate more favourable conditions with airport operators or local tourism authorities for facilitating the self-connections, perhaps with some degree of exclusivity.
The research, however, has a few limitations. First, the relevance of self-connections themselves for the development of leisure travel in Europe may be diluted in the future by LCCs actually incorporating these opportunities into their own menu of services rather than let the passengers or intermediate airports capture these rents via self-connecting platforms. For example, Ryanair is currently piloting connections between its own flights at several of its European bases and news has surfaced of negotiations with other major LCCs to facilitate interline connectivity as well. From a methodological perspective, it is also worth noting that our definition of self-connections does not rely on comprehensive information on existing interline agreements, such as those provided in IATA databases that were not available to the researchers. Whilst that information is generally transparent and can be easily found in the relevant airlines’ websites, further research should employ a consistent source of data to improve the accuracy of our estimates. Another suggestion for further research is to expand the scope or analysis to long-haul markets, such as those between Europe and America or Asia-Pacific, where there are low-cost airlines already operating (like Norwegian at Gatwick or Iberia/Level in Barcelona) in strong competition with established network carriers. The prospect of saving in air fares by means of self-connections between low-cost airlines can also make this travel option popular in long-haul markets.
Appendix: Tourist Airports in Mainland Spain, Italy, and France
| Country | Code | Airport |
|---|---|---|
| France | MRS | Marseille Provence |
| France | NCE | Nice |
| France | MPL | Montpellier Mediterranee |
| France | PGF | Perpignan |
| France | TLN | Toulon/Hyeres |
| France | BZR | Beziers |
| Italy | BRI | Bari |
| Italy | FCO | Rome Fiumicino |
| Italy | NAP | Naples Capodichino |
| Italy | PSA | Pisa |
| Italy | SUF | Lamezia Terme |
| Italy | TRS | Trieste |
| Italy | VCE | Venice Marco Polo |
| Italy | CIA | Rome Ciampino |
| Italy | GOA | Genoa |
| Italy | PSR | Pescara |
| Italy | AOI | Ancona |
| Italy | BDS | Brindisi |
| Italy | REG | Reggio Di Calabria |
| Italy | RMI | Rimini |
| Italy | TSF | Venice Treviso/Sant’angelo |
| Italy | VIF | Vieste |
| Spain | AGP | Malaga |
| Spain | ALC | Alicante |
| Spain | BCN | Barcelona |
| Spain | IBZ | Ibiza |
| Spain | PMI | Palma de Mallorca |
| Spain | VLC | Valencia (ES) |
| Spain | GRO | Girona |
| Spain | LEI | Almeria |
| Spain | MJV | Murcia |
| Spain | MAH | Menorca |
| Spain | REU | Reus |