“There goes Bill!”
Chapter Twelve
Bill Hunter and Some Ideas on Experimental Design
Bill Hunter arrived in Madison to begin his Ph.D. in the fall of 1960 after working during the summer in Whiting, Indiana. He had enjoyed the job so much that he had written asking whether it was possible to start classes a week after the semester began. I wrote back telling him that no, this would not be possible, so Bill arrived just before classes started (Figure 12.1).
Figure 12.1 Stu Hunter, me, and Bill Hunter.

Bill was on a fast track from the day he came to Madison. He completed a brilliant thesis1 in 1963. Soon after, we offered him an assistant professorship in the Statistics Department. From the beginning, he was an excellent teacher and did some first-class research. As a result, he became an associate professor in 1966, and a full professor in 1969, meaning that he had gone from graduate student to full professor in eight years.
During the first several years I worked at ICI, I taught statistics two nights a week at Salford Technical College to earn a bit of extra income. The college was about halfway between ICI, at Blackley, and my home in Sale, so I would work a full day at ICI, eat dinner at a greasy spoon restaurant, and go directly to the college to teach the class. The course concerned the design of experiments. I wrote out my notes, dittoed them, and circulated them to the class in advance so that the students could listen, rather than write. These notes also formed a basis for later courses I taught, and for my contributions to the second book for ICI, called the Design and Analysis of Industrial Experiments, otherwise known as “Big Davies,” after its editor, published in 1954. The latter book, and my notes, were very useful when Bill Hunter, Stu Hunter, and I began writing Statistics for Experimenters in the early 1960s.
As I have said, in the 1950s, statistics was subsumed by mathematics at most universities and received little respect as a field. The incentive to use it in science and industry came from industry itself, not from the college campus. The intention of the book was to introduce its application to a wider public. Stu and I made a good beginning when I moved to Wisconsin in 1959, and he came the following year. In 1962, however, Stu took a job at Princeton and duties at our respective institutions made collaboration more difficult. Stu continued to make further contributions when he became the department's first statistician in residence.
Bill Hunter had a joint appointment with the departments of Statistics and Engineering, and later his office was on the fifth floor of the School of Engineering; you could tell which room was his from outside of the building because he had pasted the pages of the New York Times on the window to keep the sun out. We often used Bill's office while we were working on Statistics for Experimenters. One of our bigger challenges was that some of our collaboration occurred during the Watergate hearings in the summer of 1973. The hearings, which kept the nation spellbound, regularly lured us from our work to watch the television in the nearby student union. There we were joined by numerous others who found it difficult to resist the unfolding story and its cast of characters. There were the testimonies of John Dean, H.R. Haldeman, and John Ehrlichman, among others, all presided over by the courtly Senator Sam Ervin, a man who possessed remarkable eyebrows.
We continued our work on the book well after the Watergate hearings were over. Finally, in 1978, we sent it off to Wiley, our publisher. Shortly before that, I wrote to my daughter, Helen, who was a senior at Culver. “The house is (almost) unimaginable because over the last several months it has been littered with Galleys, Page Proofs, Indexes and all the etceteras. BE IT KNOWN that today not only has Box (Hunter)2 been sent off for the last time but ‘Fisher The Life of a Scientist’ by Joan Fisher Box has also been sent off for the last time. Next time we see them they will be bound books!”
One of the best descriptions of the long process that yielded our book, and of Bill's role in it, comes from Conrad Fung, who was a master's degree student as the book was in progress:
I met Bill Hunter in the Fall semester of 1975 when I transferred into his course Statistics 424… It was ‘Statistics for Experimenters’ taught from mimeographed notes by Box, Hunter, and Hunter, that students could purchase from Mary Arthur in the Statistics Department office. The book would ultimately be published in 1978; we students who continued in the department over the years had the privilege of seeing the book take final form—including the evolution of all the half-normal plots that were in the manuscript when we took the course, into full normal plots when the book was published.
Bill later told the story that he himself had learned from similar notes two decades before, when he got permission…to attend George's graduate seminar on experimental design at Princeton. … They were dittoed notes in that case, but had the same + and − signs ‘marching down the page,’ as Bill described them. He said that little did he know then, as a student, that he was learning from a book of which he was to become one of the authors. And upon publication in 1978, he said, he broke into doggerel:
The three wrote the book page by page
So that statistics would become all the rage.
But when it came back from the binding,
They made a great finding:
At birth, it had reached voting age!2
The book would never have become a book had it not been for Bea Shube, the exceptional editor at Wiley Publishing. As a woman working in the field of scientific publishing, she was a pioneer. She started at Wiley in the early 1940s and worked there until 1988, and during that time, she shepherded many outstanding books into publication. There is no question that her encouragement and wise suggestions made Statistics for Experimenters a better book. When Bea retired in 1988, I was fortunate that Wiley had Lisa Van Horn to take her place, and she and I worked together for over 20 years, beginning with the 1997 paper edition of Evolutionary Operation. In 2004, she oversaw the second edition of Statistics for Experimenters and a book of collected articles, Improving Almost Anything, in 2006. Lisa also edited the second editions of Response Surfaces in 2008 and of Statistical Control in 2009. Her input was unusually perceptive, and it was always a joy to work with her. Steve Quigley, the associate publisher at Wiley, oversaw the publication of all of these books, and he and I remain close friends.
When I was still in England, I bought some records at bargain prices from a shop that had been damaged by fire. One of these I particularly liked was a song by Cole Porter called “Experiment,” sung, I think, by Gertrude Lawrence. I thought it might be an appropriate anthem for our book. But Bill had never heard of it, and no one else he knew in the United States had ever heard of it either. This was strange because Cole Porter was, of course, American. We knew that if we wanted to use the song in the book, we would have to get permission from whomever owned the copyright. So when Bill was going to England one summer, he decided to track the song down. After several dead ends, he went to the British Institute of Recorded Sound. He asked an old gentleman at the main desk if he knew anything about the song. The man promptly stood up and sang it. When Bill asked why the song was unknown in the United States, the man explained that it was in a 1933 show, Nymph Errant, that had been tried out in London and had flopped. So it had never appeared in the United States. In the show, the song is part of a commencement address. We included only the chorus on the first page of Statistics for Experimenters II. Here is the song in its entirety:
Before you leave these portals to meet less fortunate mortals,
There's just one final message I would give to you.
You all have learned reliance on the sacred teachings of science
So I hope through life you never will decline in spite of philistine defiance
To do what all good scientists do.
Experiment.
Make it your motto day and night.
Experiment and it will lead you to the light.
The apple on the top of the tree is never too high to achieve,
So take an example from Eve, experiment.
Be curious, though interfering friends may frown,
Get furious at each attempt to hold you down.
If this advice you only employ, the future can offer you infinite joy
And merriment.
Experiment and you'll see.
[Citation: Cole Porter, “Experiment,” from the London stage musical, “Nymph Errant,” 1933.]
Statistics for Experimenters is now in its second edition and has sold over 163,000 copies. I was particularly delighted when it was translated into Spanish by my friends in Barcelona and Madrid.3 My friend Ernesto Barrios was immensely helpful with the technical revision of the second spanish edition. Ernesto had been one of the longer running Ph.D. students in the Statistics Department. He wrote a very good thesis, but when I encouraged him to take the exam so that he could graduate, he always argued that there were parts of his dissertation that he wanted to improve. He did eventually go back to Mexico, in 2005, and is a professor of statistics at the Instituto Tecnológico Autónomo de México.
In the second edition, we added on the inside covers, more than 60 aphorisms, some our own, and some from other authors. Among them were:
- All models are wrong; some models are useful.
- It's better to solve the right problem approximately than the wrong problem exactly. (John Tukey)
- Experiment and you'll see! (Cole Porter)
- Question assumptions!
- One must try by doing the thing; for though you think you know, you have no certainty until you try. (Sophocles)
- Designing an experiment is like gambling with the devil: Only a random strategy can defeat all his betting systems. (R.A. Fisher)
- You can see a lot by just looking. (Yogi Berra)
- Common sense is not common.
- When running an experiment the safest assumption is that unless extraordinary precautions are taken, it will be run incorrectly.
- When Murphy speaks, listen.
- Certain words should be used sparingly. These include should, could, would, ought, might, can't, and won't.
In August 1984, I received a note from Emily Peterson, Chancellor Irving Shain's secretary, asking whether I would be able to join the Chancellor and some special visitors from England for lunch two months hence, on Oct. 18 or 19. I checked my schedule and realized that I was to attend a conference in New Mexico during that time so I wrote back sending my regrets. Ms. Peterson replied immediately, explaining that there was now a chance that the British visitors would be coming to Madison on Friday, Oct. 12 instead, and would I be available then? I was free that day, so I answered in the affirmative. In September, Ms. Peterson wrote confirming that I was to join the Chancellor and his English guests at noon on Oct. 12 at “L'Etoile,” Madison's finest restaurant, which was across the street from the state capitol building.
On the appointed day, I drove from the west side of town to the restaurant on the capitol square, which is in the center of Madison's famed isthmus. The isthmus is a narrow and congested part of town where parking is very scarce. As I approached the area, traffic became backed up and access to some of the streets was blocked. I suddenly remembered that this was the day Walter Mondale and Geraldine Ferraro were coming to Madison for a huge rally in the run-up to November's presidential election. There was absolutely nowhere to park, and by now I was sure I would be late. Finally I found a parking spot blocks away from the restaurant and hastily made my way to L'Etoile.
I arrived breathless at the restaurant and looked around for Chancellor Shain and his guests. They were nowhere in sight. What I saw instead was a large group of my past graduate students, some of whom had come from great distances. It dawned on me that this was a “setup.” Conspiring with the chancellor and his secretary, Bill had invited my students to Madison to celebrate my 65th birthday. I was completely stunned and delighted.

[Citation: Emily A. Peterson, letter to author, September 19, 1984.]
What behind-the-scenes chaos arose when I canceled the first meeting with the fabricated Englishmen I do not know, but doubtless there was some. Needless to say, there was much merriment and we had a wonderful reunion. Bovas Abraham had helped with the plot, which included asking various students and colleagues, including a number who could not be there, to write letters recounting memories and offering best wishes. These letters were beautifully bound into a leather volume that was presented to me at the gathering. Twenty-five years letter, they still give me great pleasure. The writers were:
| Bovas Abraham | Hannes Ledolter |
| Sig Andersen | Kevin Little |
| Dave Bacon | Greta Ljung |
| Steve Bailey | John MacGregor |
| Don Behnken | Paul Newbold |
| Gina Chen | Lars Pallesen |
| Larry Haugh | Dave Pierce |
| Bill Hill | Jake Sredni |
| Bill Hunter | David Steinberg |
| Stu Hunter | Ruey Tsay |
| Hiro Kanemasu | John Wetz |
| Dean Wichern |
Below is part of Bill's letter:
My first day in Madison was memorable. I arrived on a Saturday, to register at the last possible moment. I was working that summer in Whiting, Indiana for John Gorman, and did not want to leave. I was having a lot of fun working there, on such things as nonlinear estimation. You came breezing through the department (which, as you recall, was in the house on Johnson Street) about lunch time and asked if I had any plans for lunch. I said no, and you invited me to join you and Gwilym. I then sat in the back of your VW van as you gave him a tour of Madison, which included the zoo.
You stopped at El Rancho for some things for dinner, and, before I knew it, I was having dinner with all of you. There was champagne, which came out of the newly opened bottle in an overly vigorous way, which got everything, tablecloth and all, wet. Napkins were pushed under the tablecloth, which gave the otherwise formal setting, a somewhat casual and definitely lumpy appearance. As I recall, the champagne was a last-minute idea as an addition to the menu, and the bottle was not sufficiently chilled. In any event, a fine time was had by all, and the evening went on to songs by you and Gwilym. I think you both had guitars, and at one point you were singing statistical songs, impromptu efforts in rhyme, with you and Gwilym taking turns.
It was a magical day. About 2 am I left. As I was walking away in the night I thought to myself, ‘What a splendid day. It was wonderful. When I tell anyone about it, they won't believe it. Neither will I. I should have a momento. The champagne bottle is a possibility. That would be nice to have.' I turned around, returned, knocked on the door. You looked more than a little surprised when you answered the door, because being called on at 2 am is quite unusual. I explained that I’d like to keep the champagne bottle, and you said fine. That was the end of my first day in Madison.
The best thing about Madison is the friends that I have, which includes Judy, Jack, and Justin. And you, too, George. I love you, and I wish you a happy 65th!
Bill
Soon after coming to Madison, I started an intermediate-level course—Statistics 424—on experimental design. Later Bill taught the course to hundreds of students. One of his requirements was that every student should produce and analyze a factorial design of their own devising and draw appropriate conclusions. One student baked cakes with different ingredients. Another, who was a pilot, experimented with putting his plane into spins and measuring the factors that enabled him to escape them successfully.4 Below I discuss two examples.
Statistics is about how to use and generate data to solve scientific problems. To do this, familiarity with science and scientific method is essential. In science and technology, it is frequently necessary to study a number of variables. Let's call the variables you can change “inputs,” or “factors,” and the variables you measure “outputs,” or “responses.” It used to be believed that the correct way to study such a system affected by a number of factors was by changing one factor at a time. More than 80 years ago, R.A. Fisher showed that this procedure was extremely wasteful of experimental effort. In fact, you should change a number of factors simultaneously in patterns called “experimental designs.” Even now, however, the one factor at a time method is still taught.
Here is a simple factorial design due to Bill Hunter for an experiment on a polymer solution for use in floor waxes with eight experimental runs to study the effects of three factors. These factors were as follows: 1) the amount of monomer; 2) the type of chain length regulator; and 3) the amount of chain length regulator on three responses: milkiness, viscosity, and yellowness.

A designed experiment has the merit that it quite often “analyzes itself.” For this experiment, with only eight runs, it is clear that milkiness is affected only by factor 1, viscosity only by factor 3, and slight yellowness by a combination of 1 and 2.*
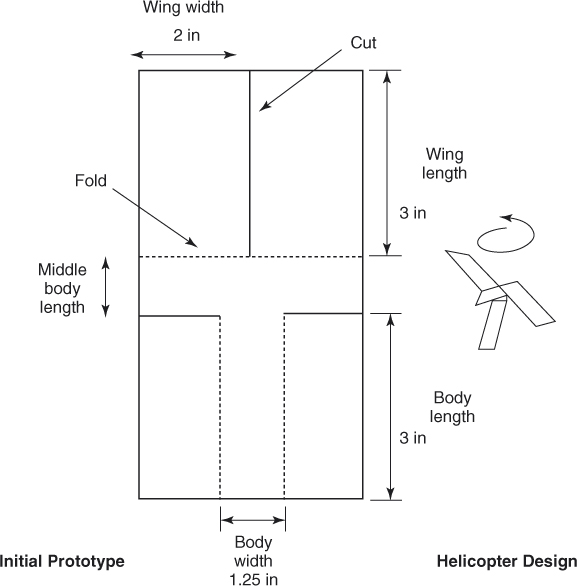
Bill and I believed that it was important to learn by doing. We wanted the class to experience how process improvement could be achieved using statistical design. In many of our demonstrations, we used a paper helicopter because it was easy to make, modify, and test. Our basic helicopter design is shown in the figure. In the figure, the heavy lines show where to make cuts in the paper and the dotted lines show where to make folds. If you release the helicopter, it will rotate and fall slowly to the ground. The problem is to modify the design so that the helicopter will stay in the air for the longest possible time.
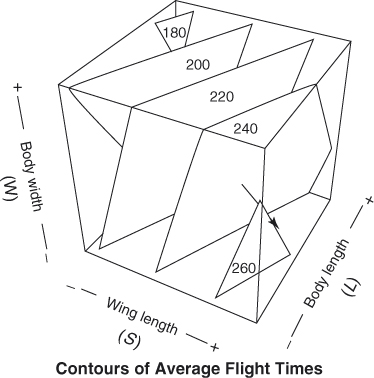
For simplicity we illustrate with eight different helicopter designs arranged in a 23 experiment.

Over these comparatively short flight times, the effects are roughly linear and can be represented by parallel contours plotted on a cube as follows:
The arrow indicates that a helicopter with shorter body (W) width and longer wing (S) length will fly longer, but a change in body length doesn't make much difference. Of course an experiment such as this may be run with more than three factors.
Most of the important ideas in statistics have come about because of scientific necessity, not because of mathematical manipulation.5 Some examples and the people involved are described below.
A famous example of practice generating theory was Charles Darwin's study of plants and animals on the voyage of the Beagle. Darwin, who was pathetically deficient in mathematics, used scientific observation to develop his theory of evolution.
An important factor in evolutionary theory was the variation of species. But Francis Galton wondered why this variation did not continually increase. He found that this was because similarities between relatives was only partial, and the partial similarity could be measured by the correlation coefficient.
This in turn was taken up with enthusiasm by Karl Pearson, who realized that if we were to find out when items were significantly correlated, it was necessary to discover the distribution of the correlation coefficient.
Pearson's methods were clumsy and were developed for large samples. Fisher, however, easily obtained the normal theory distribution and its elaborations using n-dimensional geometry. Pearson's methodology also failed to meet the practical needs of W. S. Gosset, when he came to study statistics with Pearson for a year at University College, London, in 1906. Gosset had graduated from Oxford with a degree in chemistry and had gone to work for Guinness's, following the company's policy (begun in 1893!) of recruiting scientists as brewers. He soon found himself faced with analyzing small sets of observations coming from the experimental brewery of which he was placed in charge.
Gosset's invention of the t test is a milestone in the development of statistics because it showed how account might be taken of the uncertainty in estimated parameters. It thus paved the way for an enormous expansion of the usefulness of statistics, which could now begin to provide answers for agriculture, chemistry, biology, and many other subjects in which small rather than large data samples were the rule.
Fisher, as he always acknowledged, owed a great debt to Gosset, both for providing the initial clue as to how the general problem of small samples might be approached, and for mooting the idea of statistically designed experiments.
When Fisher took a job at Rothamsted Agricultural Experimental Station in 1919, he was immediately confronted with a massive set of data on rainfall recorded every day, and of harvested yields every year, for over 60 years. He devised ingenious methods for analyzing these data, but he soon realized that the data that he had, although massive, did not provide much information on the important questions he needed to answer. The outcome was his invention of experimental design. Fisher considered the following question: How can experiments be conducted so that they answer the specific questions posed by the investigator? One can clearly see his many ideas developing in response to the practical necessities of field experimentation.
Fisher left Rothamsted in 1933 and was succeeded by Yates, who made further important advances. He invented new designs, and showed how to cope when, as sometimes happened, things went wrong and there were missing or suspect data.
Later Finney, responding to the frequent practical need to maximize the number of factors studied, introduced fractional factorial designs. These designs, together with another broad class developed independently by Plackett and Burman in response to war-time problems, have since proved of great value in industrial experimentation. An isolated example of how such a highly fractionated design could be used for screening out a source of trouble in a spinning machine had been described as early as 1934 by L. H. C. Tippett of the British Cotton Industry Research Association. This arrangement was a 125th fraction of a 55 design and required only 25 runs!
In another example, Henry Daniels, a statistician at the Wool Industries Research Association from 1935 to 1946, solved the problem of determining how much of the variation in the woolen thread was due to each of a series of processes through which the wool passed. Variance component models, which could be used to expose those particular parts of a production process responsible for large variations, had wide application in many other industries.
Later, Henry and I would meet under strange conditions, during the time of the Iron Curtain. We were both members of a small group attending a conference in West Germany who had arranged to travel to the home of Johan Sebastian Bach, at Eisenach in East Germany. At the border, we received a glimpse of what the Iron Curtain involved: an interminable row of concrete dragons' teeth stretching far into the distance, and guards with vicious dogs on leads. The guards took our passports, and they kept them until we crossed back into West Germany. I had not known Henry well before our trip to the border, but I became quite well acquainted with him and his wife during the two hours that we waited to cross into East Germany.
In the development of applied statistics, an important influence was the work of Walter Shewhart on quality control. This work and that on sampling inspection by Harold Dodge heralded more than a half century of statistical innovation, much of it coming from the Bell Telephone Laboratories. This included a rekindling of interest in data analysis in a much needed revolution led by John Tukey.
Another innovator guided by practical matters was Frank Wilcoxon, an entomologist turned statistician at the Lederle Labs of the American Cyanamid Company. He said that it was simply the need for quickness that led to his famous Wilcoxon tests, the origins of much subsequent research by mathematical statisticians on nonparametric methods.
An early contribution was by M. S. Bartlett, whose courses I sat in on while I was still at ICI. His work on the theory of transformation of data came about because he was concerned with the testing of pesticides and so with data that appeared as frequencies or proportions.
William Beveridge's attempt to analyze time series by fitting sine waves had revealed significant oscillations at strange and inexplicable frequencies. Yule suggested that such series should be represented, not by deterministic functions, but by dynamic systems. Yule's revolutionary idea was the origin of modern time series models. Unfortunately, the practical use of these models was for some time hampered by an excessive concern with stationary processes in equilibrium about a fixed mean. Almost all of the series arising in business, economics, and manufacturing do not behave like realizations from a stationary model. Consequently, for lack of anything better, operations research workers led by Holt and Winters devised an non-stationary model. They began in the 1950s to use the exponentially weighted moving average of past data and its extensions for forecasting series of this kind. This weighted average was introduced because it seemed sensible for a forecast steadily to discount the past, and it seemed to work reasonably well. However, in 1960, Muth showed that this empirical statistic was an optimal forecast for an important kind of nonstationary model. This model and its generalizations, together with Yule's contributions, later turned out to be extremely valuable for representing many kinds of practically occurring series, including seasonal series, and are the basis for so-called ARIMA models.
In further developments, mathematical statisticians had a theory of what they called “most powerful tests,” showing that given their assumptions, it was impossible to outperform such a test. In particular, this led to the conclusion that for a binomial testing scheme, you should inspect a fixed number n of items, say 20, drawn at random from the batch, and if the number of duds was greater than some fixed number, say three, you failed the whole batch. Allen Wallis has described the dramatic consequence of a simple query made by a serving officer, “Suppose in such a test it should happen that the first three components tested were all duds, why would we need to test the remaining seventeen?” Allen Wallis and Milton Friedman were quick to see the apparent implication that “super-powerful” tests were possible!
At the time Abraham Wald was accepted to be the premier mathematical statistician, but some thought the suggestion that he be invited to work on the problem of a test that was more powerful than a most powerful test was ridiculous. To do better than a most powerful test was impossible! What the mathematicians had failed to see was that the test considered was most powerful only if it was assumed the n
was fixed, and what the officer had seen was that n did not need to be fixed. This led to the important development of sequential tests that could be carried out graphically.6
A pioneer of graphical techniques of a different kind was Cuthbert Daniel, an industrial consultant who used his wide experience to make many contributions to statistics. An early user of unreplicated and fractionally replicated designs, he was concerned with the practical difficulty of understanding how significant effects could be determined without estimating the size of the experimental error by repetition. In particular he was quick to realize that higher order interactions that were unlikely to occur could be used to estimate experimental error. His introduction of graphical analysis of factorials by plotting effects and residuals on probability paper has had major consequences. It has encouraged the development of many other graphical aids, and together with the work of John Tukey, it has contributed to the growing understanding that at the hypothesis generation stage of the cycle of discovery, it is the imagination that needs to be stimulated, and that this often best be done by graphical methods.
Obviously one could go on with other examples, but at this point, I should like to draw some interim conclusions.
There are important ingredients leading to statistical advance. They are (1) the presence of an original mind that can perceive and formulate a new problem and move to its solution, and (2) a challenging and active scientific environment for that mind, conducive to discovery.
Gosset at Guinness's; Fisher, Yates, and Finney at Rothamsted; Tippett at the Cotton Research Institute; Youden at the Boyce Thomson Institute (with which organization Wilcoxon and Bliss were also at one time associated); Daniels and Cox at the Wool Industries Research Association; Shewhart, Dodge, Tukey, and Mallows at Bell Labs; Wilcoxon at American Cyanamid; and Cuthbert Daniel in his consulting practice: These are all examples of fortunate conjunctions leading to innovation.
Further examples are Don Rubin's work at the Educational Testing Service, Jerry Friedman's computer intensive methods developed at the Stanford linear accelerator, George Tiao's involvement with environmental problems, Brad Efron's interaction with Stanford Medical School, Gwilym Jenkin's applications of time series analysis in systems applications, and John Nelder's development of statistical computing at Rothamsted.
The message seems clear: A statistician or any scientist who believes himself or herself capable of genuinely original research will find inspiration in a stimulating scientific investigational environment. In all the important scientific developments described earlier, it was the need for new methods in appropriate environments that led to their conception.
As undergraduates, students are encouraged to sit with their mouths open and their teachers pour in “knowledge” for several years. Then those that become graduate students are expected to do something totally different. They have been regularly fed, and now they have to feed themselves and they haven't been taught how to do it. Undergraduate education must provide more opportunities for students to use their creativity—they need help in understanding the art of problem solving. Also, new graduate students tend to start trying to solve a problem in full generality with all the bells and whistles. I've told them, “Don't try to get a general solution all at once. Start out with n = 1, and m = 2. Once you can really understand the problem in its simplest form, then you can begin to generalize.” Also, you must try to see the essence of the problem. As it says in the New Testament, “Except ye be as little children ye shall not enter the kingdom of heaven.”
So I tell my students that it's best if you try to try to think of problems from first principles. It is easy to miss the obvious, and sometimes there is nothing less obvious than the obvious. If you don't approach problems in this way, you may get caught in the tramlines, you think what everyone else has already thought, and you don't arrive at anything new.
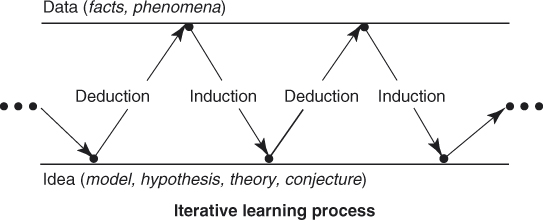
Mathematics is primarily concerned with the question: Given certain assumptions, is this true or isn't it? And in a myriad of other disciplines—physics, chemistry, engineering, and the like—mathematics is an essential tool. But statistics is concerned with finding out things that were not in the original model. For example, Albert Einstein noted that many people thought that he developed the idea of relativity from pure theory, but, he said, this was untrue—his theory of relativity was based on observation. Because of the necessity to change the model as one's understanding develops, scientific investigation can never be coherent. One important method that can result in innovation is the interactive process involving induction and deduction. As was said in Statistics for Experimenters:
An initial idea (or model or hypothesis or theory or conjecture) leads by a process of deduction to certain necessary consequences that may be compared with data. When consequences and data fail to agree, the discrepancy can lead, by a process called induction, to modification of the model. A second cycle in the iteration may thus be initiated. The consequences of the modified model are worked out and again compared with the data (old or newly acquired), which in turn can lead to further modification and gain of knowledge. The data acquiring process may be scientific experimentation, but it could be a walk to the library or a browse in the Internet.
The iterative inductive-deductive process, which is geared to the structure of the human brain and has been known since the time of Aristotle, is part of one's everyday experience. For example, a chemical engineer Peter Minerex parks his car every morning in an allocated parking space. One afternoon after leaving work he is led to follow the following deductive-inductive learning sequence:
Model: Today is like every other day.
Deduction: My car will be in its parking place.
Data: It isn't.
Induction: Someone must have stolen it.
Model: My car has been stolen.
Deduction: My car will not be in the parking lot.
Data: No. It's over there!
Induction: Someone took it and brought it back.
Model: A thief took it and brought it back.
Deduction: My car will have been broken into.
Data: It's unharmed and unlocked.
Induction: Someone who had a key took it.
Model: My wife used my car.
Deduction: She probably left a note.
Data: Yes. Here it is.
Suppose you want to solve a particular problem and initial speculation produces some relevant idea [model, theory]. You will then seek data to further support or refute this theory. This could consist of some of the following: a search of your files and of the Web, a walk to the library, a brainstorming meeting with co-workers and executives, passive observation of a process, or active experimentation. In any case, the facts and data gathered sometimes confirm your conjecture, in which case you have solved your problem. Often, however, it appears that your initial idea is only partly right or perhaps totally wrong. In the latter two cases, the difference between deduction and actuality causes you to keep digging. This can point to a modified or totally different idea and to the reanalysis of your present data or to the generation of new data.
Humans have a two-sided brain specifically designed to carry out such continuing deductive-inductive conversations. While this iterative process can lead to a solution of a problem, you should not expect the nature of the solution, or the route by which it is reached, to be unique.7
Your subconscious mind goes on trying to figure things out when you are not aware of it. When something really new occurs to you, it doesn't usually happen when you are sitting down and working at your desk. You might be in the shower or taking a walk, and you suddenly get an idea that solves, or at least helps to solve, the problem. I like working with someone else. The sum of our efforts has always been greater than the parts. Bouncing ideas around with a colleague, discussing, arguing—all catalyze the process of learning and discovery.8
Bisgaard9 defined innovation as the complete process of development and eventual commercialization of new products and services, new methods of production or provision, new methods of transportation or service delivery, new business models, new markets, or new forms of organization. Thus, innovations can occur in marketing, investment, operations, and management techniques as well as in manufacturing and services.
Breakthrough innovation and incremental innovation are commonly used terms. Breakthrough innovations are often associated with new products or services and incremental innovations with improvements in current services or products.
The importance of innovation has sometimes been neglected. Although there are many famous historic examples where innovation was paramount, we pick just one. At the end of World War II, Japanese industry was in ruins. If you visit the Toyota museum in Japan, you will be shown their first car, an exact copy of a Volkswagen. There were many modes of innovation that subsequently brought Toyota cars to world attention. Three of these were (1) previously unknown standards of quality control, (2) new designs developed with the help of thousands of statistically designed experiments, and (3) an attitude toward the workforce based on the idea that they were all one family dedicated to making a good product, with the workers treated fairly by management. Toyota also introduced many other important ideas, such as lean manufacturing. Unfortunately U.S. manufacturers were slow to adopt these concepts. I will go into detail about these facets of Japanese innovation in the next chapter.
The deductive-inductive iteration described earlier is one route to innovation. More generally, some important initiatives that can lead to successful innovation are:
In using these ideas, we should not ask which is best but be prepared to employ them all.
With de Bono's lateral thinking, one solves a problem not by working further down the established inductive-deductive path but by finding a new direction.10 The disadvantage of the inductive-deductive route is that the scheme you arrive at may have already occurred to competing scientists and engineers who have similar education and work with the same set of scientific principles. This is less likely to happen with lateral thinking.
The lateral thinking concept is easier to demonstrate than to define. A simple example of lateral thinking concerns the quandary of a person who has to organize a tennis championship. Supposing that there are 47 contenders, how many matches would be necessary to come up with a winner in a single elimination tournament? The answer could be obtained by enumeration, but it can be reached much more easily by thinking not about the winners but about the losers. There have to be 46 losers, so this is the number of needed contests.
A good statistical example of de Bono's lateral thinking occurred at a Princeton seminar where Merve Muller discussed a way of generating normal deviates by piecewise approximation of the normal curve. This was complicated and messy, and it seemed that there should be a simpler way. This led me to the following question: “What is it in the normal distribution that is uniformly distributed?” For two independent normal deviates, the angle of the radius vector and the log of its length are distributed uniformly and independently. So this provides a way of generating pairs of random numbers. (The less-than-two-page note containing this result11 has been cited almost 1,400 times on Google Scholar.)
These applications of lateral thinking are not earth shattering, but the idea can be. This was demonstrated, for example, by Charles Darwin. Everyone could see how wonderfully a multitude of living things fitted exactly into our environment, so it seemed obvious that this must be the result of magnificent intelligent design that individually fashioned every living thing and only a super power could accomplish. Darwin, thinking laterally, realized that all that was needed was reproduction and natural selection.12
Another example of lateral thinking was R.A. Fisher's use of n-dimensional geometry. This led, at once, among other things, to the distribution of the correlation coefficient, to degrees of freedom, orthogonality, the additive property of independent sums of squares, the analysis of variance, the idea of sufficiency, the development of regression analysis, and a better understanding of Gauss's method of least squares.
Lateral thinking is counterintuitive and will usually be resisted. It is easy to understand this. We have all been trained to think as if the inductive-deductive mode was the only way to solve problems. Thus, at first Darwin's ideas were contested, as were Fisher's.
The discovery process can also be greatly catalyzed by group discussion, especially if the group contains people from different disciplines. Adair has discussed how teams should be formed and run in order to be most effective.13 Scholtes et al. described the many aspects that can make this method effective.14
Discussion groups are important not only in themselves but also as a necessary adjunct to the other approaches. Thus, for example, de Bono's “six thinking hats” method can be regarded as either a means to facilitate lateral thinking or as a way to facilitate discussion within groups.15
It is important for there to be openness and trust on teams; otherwise, potentially useful ideas may not be suggested. Many point out that with an experienced team, there is little distinction between work and play.
Characteristics of successful teams were evident in the “Monday Night Beer Session” held for years in my home. As noted, students and faculty came from many different departments, and sometimes from industry, to discuss problems and ideas in an atmosphere of open exchange. The sessions were, in the eyes of many who attended, an invaluable learning experience.
Another approach that can prove useful in innovation is the use of analogy. As an example, at ICI one way to improve processes was by running designed experiments, but experiments on the full scale were expensive and disruptive, and small-scale experiments could be misleading. A graphical representation of the imaginary evolution of a species of lobster was used to illustrate to company executives at ICI the idea of evolutionary operation. This statistical procedure made it possible to generate information on how to improve a product during actual manufacture. Under evolutionary operation, small changes close to normal operating conditions are continually repeated. One is then able to move process factors toward better settings during routine manufacture. This procedure also has the capacity of following moving maxima.
All of these efforts will fail without appropriate leadership. It is true that many people helped Thomas Edison develop the light bulb, many sailors helped Admiral Lord Nelson win the battle of Trafalgar, and no doubt many engineers and scientists helped Steve Jobs develop the iPhone. Nevertheless, these happenings would not have occurred (at least not at that time) without these leaders. One reliable guide to effective leadership is that of Scholtes.16
A few years ago, I got a letter from India. The writer said he was a student who very much wanted to study under my guidance. I wrote back explaining that I had retired and no longer supervised Ph.D. students. But he responded that that didn't matter as far as he was concerned; he just wanted to be with me. He was given a three-year visa and enrolled in the Industrial Engineering Program at the University. He was quick to learn and very helpful.
Suren had been granted a temporary visa, but I had not realized that he faced a serious problem. He needed to borrow money to pay his fees at the University in dollars, but on an Indian salary, it would take most of his life to pay off. But happily he got a job in the Quality Control Department of the Kohler Company in Wisconsin. The company was very impressed with his work, and they asked the U.S. immigration authorities to provide him with some sort of a document allowing him to stay. Suren went from strength to strength at Kohler, and they used their influence to get him permanent residence, which will allow him to pay off his loan easily.
In 2010, we wrote a paper together introducing a fundamental change in quality control charting.17 This was published in the journal Quality Engineering and received the Brumbaugh Award for the best paper appearing in that year in any of American Society for Quality's journals.
The iteration between practice and theory and the innovation of new ideas is a never-ending process, and sometimes well-established ideas need to be re-thought. An example of this is quality control charts. These were originally developed by Shewhart in the 1930s. The underlying process model had been one where the data was assumed to vary about a fixed mean with deviations that were random. But the fact is that no system behaves in this way. In real processes, the mean and the size and nature of the variation about the mean are not fixed. In our paper, Suren and I pointed out that a more realistic model is provided by the nonstationary integrated moving average (IMA). The reason why this model is of central importance was first explained by John F. Muth in 1960. This leads to an exponentially weighted average quality control chart that can represent reality with much greater closeness.
1 W.G. Hunter, Generation and Analysis of Data in Non-Linear Situations, Ph.D. dissertation, University of Wisconsin, Madison, 1963.
2 C. Fung, “Some Memories of Bill Hunter,” Sep. 2009, retrieved from http://williamhunter.net/email/conrad_fung.cfm.
3 Luis Arimani de Pablos, Daniel Peña Sanchez de Rivera, Javier Tort-Martorell Llabres, and Alberto Prat Bartes worked extremely hard on the first edition, and Xavier Tomas Morer and Ernesto Barrios Zamudio did the same for the second.
4 W.G. Hunter, “101 Ways to Design an Experiment, or Some Ideas About Teaching Design of Experiments,” CQPI Technical Report No. 413, June 1975.
5 Parts of this section appeared in the article, “The Importance of Practice in the Development of Statistics,” Technometrics, Vol. 26, No. 1, Feb. 1984, pp. 1–8.
6 It is heartening that this particular happening even withstood the scientific test of repeatability, for at about the same time and with similar practical inspiration, sequential tests were discovered independently in Great Britain by George Barnard. Nor was this the end of the story. Some years later, Ewan Page, then a student of Frank Anscombe, while considering the problem of finding more efficient quality control charts, was led to the graphical procedure using the sequential idea of plotting the cumulative sum of deviations from the target value. The concept was further developed by Barnard who introduced the idea of a V mask to decide when action should be taken. The procedure is similar to a backward-running, two-sided sequential test. Cusum charts have since proved to be of great value in the textile and other industries. In addition, this graphical procedure had proved its worth in the “post mortem” examination of data where it can point to the dates on which the certain critical events may have occurred. This sometimes leads to discovery of the reason for the events.
7 G.E.P. Box, J.S. Hunter, and W.G. Hunter, Statistics for Experimenters: Design, Innovation and Discovery, John Wiley and Sons, Hoboken, NJ, 2005.
8 This discussion of innovation is taken in part from the article, “Innovation in Quality Engineering and Statistics,” by G.E.P. Box and W. Woodall, Quality Engineering, Vol. 21, 2012, pp. 20–29.
9 S. Bisgaard, “The Future of Quality Technology: From a Manufacturing to a Knowledge Economy and from Defects to Innovations,” (2005 Youden Address) ASQ Statistics Division Newsletter, Vol. 24, No. 2, 2006, pp. 4–8. Available at http://www.asq.org/statistics/. Reprinted in Quality Engineering, Vol. 24, No. 1, 2012, pp. 29–35.
10 E. de Bono, Lateral Thinking, Harper and Row, New York, 1970; and Lateral Thinking: A Textbook of Creativity, Viking, New York, 2009.
11 G.E.P. Box and M.E. Muller, “A Note on the Generation of Random Normal Deviates,” Annals of Mathematical Statistics, Vol. 29, No. 2, 1958, pp. 610–611.
12 Alfred Russel Wallace (1823–1913) proposed a theory of evolution based on natural selection independent of Darwin's. Although Darwin has overshadowed Wallace, the two were in regular communication and supported one another in their research.
13 J. Adair, Leadership for Innovation: How to Organize Team Creativity and Harvest Ideas, Kogan Page Limited, London, 1990.
14 P.R. Scholtes, B.L. Joiner, and B.J. Streibel, The Team Handbook, 3rd ed., Oriel Inc., Madison, WI, 2003.
15 E. de Bono, Six Thinking Hats, Little Brown and Company, Boston, 1985.
16 P.R. Scholtes, The Leader's Handbook: Making Things Happen, Getting Things Done, McGraw-Hill, New York, 1998.
17 G.E.P. Box, and S. Narasimhan “Rethinking Statistics for Quality Control,” Quality Engineering, Vol. 22, No. 2, 2010, pp. 60–72.