
JConsole is one of the best monitoring utilities that comes with JDK 1.5 or later. The full form of the JConsole is the Java Monitoring and Management Console. It's a graphical tool, which gives complete details of the application and server performance. It gives us the following information about the application hosted in Tomcat 7:
- Detect low memory
- Enable or disable the GC and class loading verbose tracing
- Detect deadlocks
- Control the log level of any loggers in an application
- Access the OS resources—Sun's platform extension
- Manage an application's Managed Beans (MBeans)
In order to use the JConsole for Tomcat 7 monitoring, we have to enable the Java Management Extension (JMX) on Tomcat 7. By doing this, we can monitor the Tomcat 7 server details from our desktop machine also, or in simple terms, we can monitor the server status remotely without logging into the server machine. It gives great flexibility to the administrator to work from any location and troubleshoot the problem. In order to enable it in Tomcat 7, we have to add the CATALINA_OPTS parameter in catalina.sh. By default, the following values are added to enable the details:
CATALINA_OPTS=-Dcom.sun.management.jmxremote -Dcom.sun.management.jmxremote.port=%my.jmx.port% -Dcom.sun.management.jmxremote.ssl=false -Dcom.sun.management.jmxremote.authenticate=false
Let's do the real-time configuration on Tomcat 7 and understand the meaning of each parameter:
CATALINA_OPTS="-Djava.awt.headless=true -Xmx128M -server -Dcom.sun.management.jmxremote -Dcom.sun.management.jmxremote. port=8086 -Dcom.sun.management.jmxremote.authenticate=false -Dcom.sun.management.jmxremote.ssl=false"
-Djava.awt.headless:It is a system configuration option that helps the graphics rendering program to accept the graphics console and redirects the program to work in the command-line mode. It is very useful while connecting to the remote server.-Dcom.sun.management.jmxremote:This JMX allows the host to connect to the system.-Dcom.sun.management.jmxremote.port:It defines the port where your Remote Method Invocation (RMI) is connected.-Dcom.sun.management.jmxremote.authenticate:It defines the authentication mechanism for the connection.-Dcom.sun.management.jmxremote.ssl:It defines the protocol used for communication. If it is set tofalse, then, by default, it uses the HTTP protocol.
Once Tomcat 7 configurations are done, it's time to connect to Tomcat 7 through the JConsole remotely using the command jconsole, as follows. It will open the GUI interface. We have to provide the IP address and port for the server where we want to connect; in our case, it's localhost and 8086. The following screenshot shows the default console for the JConsole:
[root@localhost bin] # jconsole
Note
jconsole can be found in JAVA_HOME/bin.
If we have included JAVA_HOME/bin in the path, then we can execute this command from anywhere in the system.
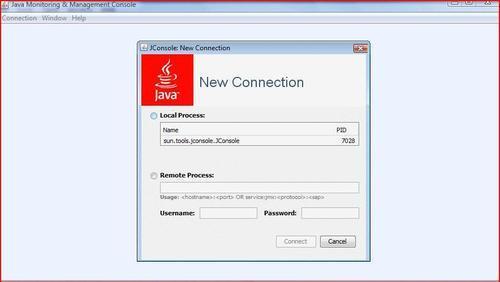
The following screenshot shows the JConsole connecting to Tomcat 7 using the port 8086:
Note
To connect to remote servers, we have to enable the firewall to allow the JConsole port on the server.

Once the system is connected, it gives the complete overview of the system such as the CPU, memory, thread, and classes. The following screenshot shows the details. We can also do a deep analysis for the following components of Java-based applications:
- Memory
- Thread
- Classes
- MBeans
The advantages of using this tool are:
- Online analysis of the application
- Customized report for the analysis
- Deadlock can be retrieved in the systems
We will now discuss the different components of monitoring for the JConsole.
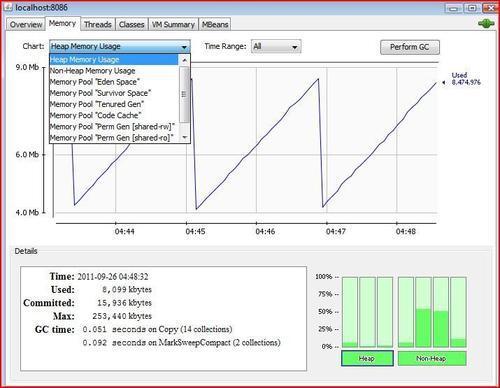
It's necessary for web administrators to analyze the memory status for Tomcat 7 to avoid future issues with the server. The following screenshot shows the real-time heap memory utilization for Tomcat 7. This tab provides the following features:
- Graphical presentation of memory with their JVM footprints
- Customization of the Memory chart based on the requirement analysis
- Ability to perform the GC
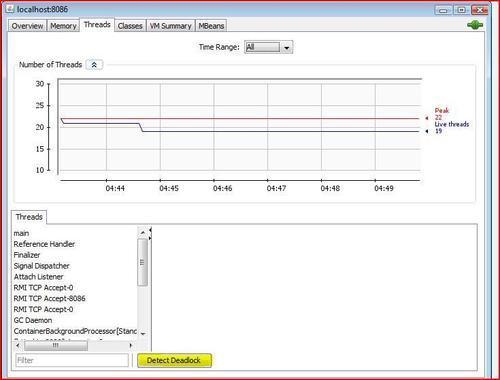
This tab gives the complete picture of the server threads and the web application hosted in Tomcat 7, for a particular instance. The following screenshot shows the live status of the threads utilization, and the Deadlock Detection button is highlighted. In real-time, this thread analysis tool is a very handy tool for the administrators. Following are the features offered by the Threads tab:
- Graphical presentation of threads and their picture
- Individual thread analysis with their status
- Deadlock detection
These two tabs are very important for an administrator. In practice, it's not possible for the administrator to view each and every component of the application every time. What the administrator does is, he/she checks for the overall performance of the system. If any anomalies are found, they will drill down the component. Following are the features of these tabs:
- Complete summary of the instances (Heap Memory Usage, Threads, CPU Usage, Classes)
- VM argument summary

The previous screenshot shows the real-time status of Tomcat 7. It consists of four graphs displaying the real-time utilization of the heap, threads, classes and CPU usage for the Tomcat 7 instance. On the other hand, the following screenshot shows the complete summary of the Tomcat instance:

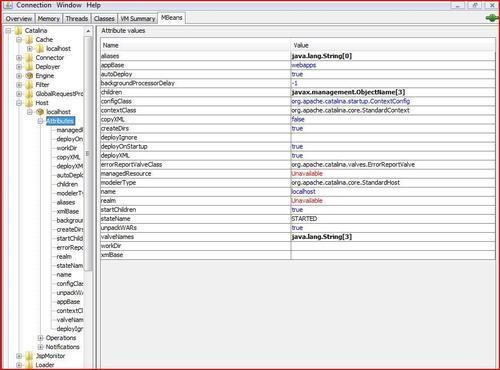
This tab gives you the complete picture of Managed Beans (MBeans) deployed in the Tomcat instance. It includes both Tomcat and application-level MBeans. The following screenshot shows the attributes of MBeans. It's very useful if a particular MBean is the source for an issue. Following are the advantages of the MBeans tab:
There are four types of MBeans. The following figure shows the different types of MBeans. Let's discuss each MBean briefly:
- Standard MBeans: A standard MBean is a combination of an MBean interface and a class, where the interface defines the entire list of attributes and operations, while the class provides the functionalities for communication for a remote interface. It is one of the simplest MBeans.
- Dynamic MBeans: A dynamic MBean implements a separate interface (a specific method) and can be invoked at runtime.
- Open MBeans: It is a composition of Dynamic MBeans and the universal dataset used for manageability.
- Model MBeans: It is a composition of Dynamic MBeans with complete access to configurable parameters at runtime and self-described methods. This MBean requires classes.

Let's take an example of the Connectors deployed in Tomcat 7, where we can configure and perform operations on the Connectors remotely using MBeans. By default, the HTTP and AJP Connectors are configured. In our example, we have the HTTPS Connector also configured. The following screenshot shows the three Connectors HTTP, AJP, and HTTPS:

If we observe the Connector folder, we can view the three sublevels for each Connector. Following are the functions of each section:
- Attributes: This section contains information about the different parameters loaded in the memory during the startup of the Tomcat instance. In short, we can say that information of the configured parameter is loaded at runtime.
- Operations: The functionality of this mode is to perform runtime operations for MBeans. Following are the different operations we can perform:
- Destroy
- Start
- Stop
- Init
- Resume
- Pause
The following screenshot shows the pause operation successfully invoked for the HTTP Connector for Tomcat 7:

Note
For more information on monitoring, please refer to the link http://java.sun.com/developer/technicalArticles/J2SE/monitoring/.