
This chapter focuses on the GUI for the Appium server. By the end of this chapter, we should get an understanding of all the terms that are available in the application.
In this chapter, we will learn about the following topics:
- The Appium GUI for Windows
- The Appium GUI for Mac
In the previous chapter, we downloaded the Appium server. We have two ways to start the server: either using the Appium GUI or using Command Prompt/Terminal. Now let's discuss the Appium GUI.
Appium developers have created the well-designed server GUI, using which we can easily start the server along with the desired settings. This GUI gives us a lot of options to set up the environment in order to start with automation testing.
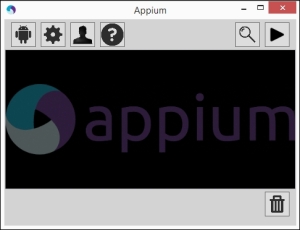
The Appium GUI has the following icons/buttons:
- Android Settings
- General Settings
- Developer Settings
- About
- Inspector
- Launch/Stop
- Clear
These buttons/icons can be seen in the following screenshot:
Under Android Settings, we have multiple options which we need before we start with the automation of mobile apps. Just click on the first icon from the Appium GUI; this will open the pop-up window along with a lot of fields. These fields are categorized using headings such as Application, Launch Device, Capabilities, and Advanced, as shown in the following screenshot:
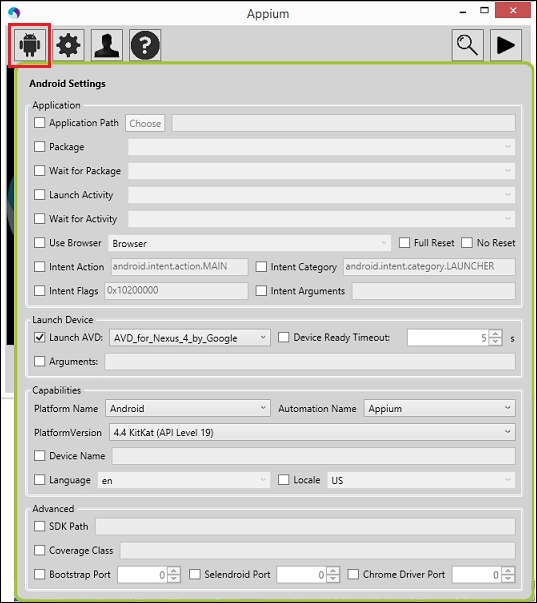
The Application pane contains various fields, which are listed in the following table:
The Capabilities pane contains the fields listed in the following table:
Click on the second icon in the GUI to open the developer settings. This also categorizes the fields into headings such as Server and Logging, as shown in the following screenshot:

The Server pane contains the fields listed in the following table, along with their descriptions:
The Logging pane contains the fields listed in the following table, along with their descriptions:
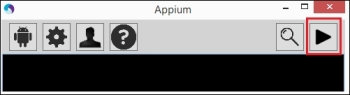
If you click on the highlighted icon (shown here) in the GUI, you will get the following screen:
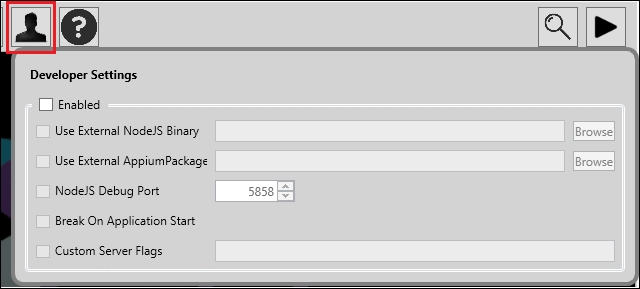
The Developer Settings pane will contain the options listed in the following table:
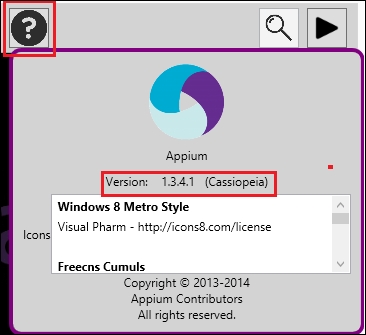
Clicking on this icon will display the Appium version you are using, as shown in the following screenshot:
Now, let's take a look at the Appium Inspector.
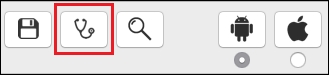
Appium Inspector allows us to find the elements that we are looking for. It also comes with a record and playback functionality similar to that of the Selenium IDE, but currently, it does not work well with Windows. To open the Inspector, we have to click on the highlighted icon, as shown in the following screenshot, but first application should be prelaunched on the device:
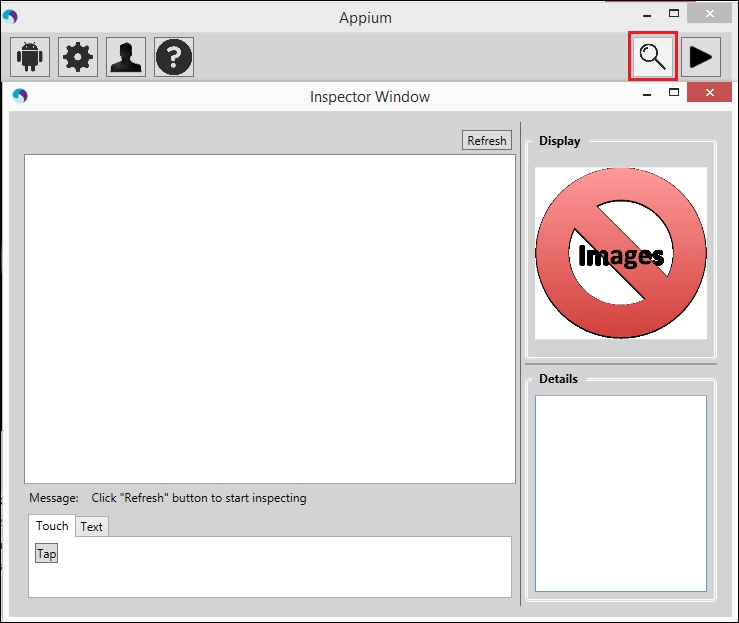
By using the Inspector, we can get the source code of a particular application, but it is hard to recognize the app elements. On Windows, UIAutomator is more powerful than Appium Inspector for inspecting the elements. In the next chapter, we will learn more about the UIAutomator.
Similarly, Mac also has an Appium GUI for Android automation; a lot of options are common with Windows. Let's discuss all the settings that are present in the GUI. The following is the screenshot of the Appium GUI on Mac
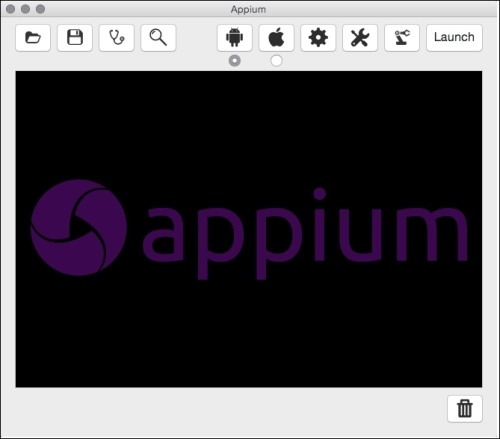
It contains the following icons:
- Android Settings
- iOS Settings
- General Settings
- Developer Settings
- Robot Settings
- Save configuration
- Open configuration
- Inspector
- Appium doctor
- Launch/Stop
- Delete
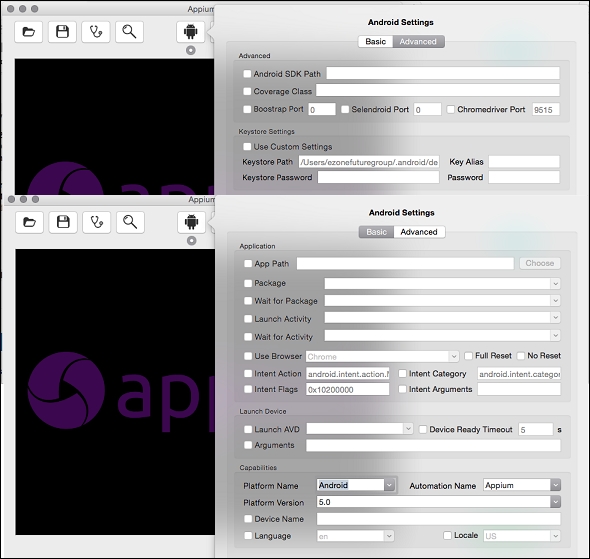
We have already seen Android Settings on the Windows platform; these settings are the same on Mac OS as well, but there are some UI changes in the Appium server, as shown in the following screenshot. The Android Settings are divided into two tabs, Basic and Advanced.
To set up the iOS, we need to click on the iOS Settings icon. It contains two options, Basic and Advanced. Under Basic, we will have the subheadings Application and Device Settings, and under Advanced, we will get the advanced iOS settings.

The options present under the Application tab are listed in the following table, along with their descriptions:
The options present under the Device Settings tab are listed in the following table, along with their descriptions:
The options present under the Advanced tab are listed in the following table, along with their descriptions:
We have already discussed General Settings, Developer Settings, Launch, and Delete in Appium for Windows. Now, let's take a look at Robot Settings.
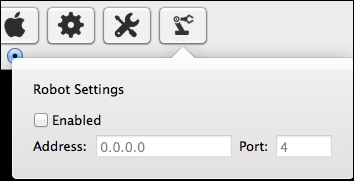
If you want automation using a robot, then you need to enable Robot Settings. In Robot Settings, Appium will ask for the host and port numbers where the robot is connected, as shown here:
Appium has a feature to save the settings; we don't need to specify the settings again and again while testing the apps. It allows you to tag the configuration file, after which you can easily find out the saved file on the basis of the tag color.
To save the configuration file, we need to perform the following steps:
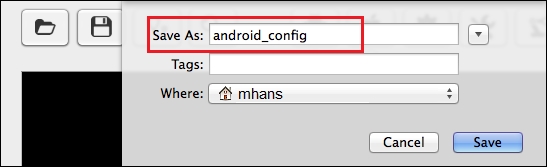
- Click on the Save configuration icon; this will open the popup, as shown here:

- Specify the filename:
- Click on the Tags textbox; it will display the list of tags, as shown in the following screenshot. We can select more than one tag.

- Select the location where you want to save the file.
We just saw how easy it is to save the configuration file. Using the saved file, we can quickly set the configuration by clicking on the Open configuration icon (which is visible in the left-hand side of the Save configuration icon) and selecting the saved file.
It will tell you about the Appium setup; you can verify the setup using the Appium doctor. Click on the Doctor button in between the Inspector and Save buttons; this will display the information in the Appium GUI console, as shown here:
If you get any configuration error that something is not being set up, then try to resolve it before you start with Appium.
Appium comes with a great piece of functionality such an the Inspector; it is a record and playback tool like Selenium IDE. We can easily generate the test script without hurdles.
It shows all the elements of the mobile app, like UIAutomator does in Android. Now, let's take a look at the Inspector. Here, we are going to take an example of the BMI calculator app in iOS, which is shown in the following screenshot. First, we need to click on the Save button before clicking on the Inspector button, and we also need to specify the app path.
In the Appium Inspector window, we can see the following fields:
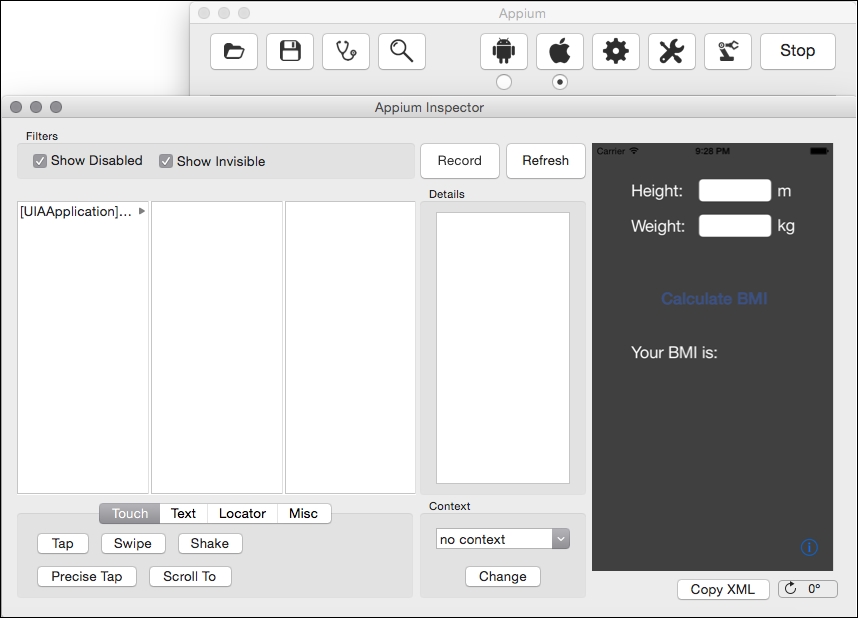
- Show Disabled: This will display the elements that are not enabled
- Record: This will open the recording panel in the bottom of the window, as shown in the following screenshot, and you can perform actions using controls in the Appium Inspector:
- Refresh: This will refresh the DOM 3-column as well as the screenshot
- Screenshot: This area will display the screenshot taken for the app, and you can also click in the area to select elements in the DOM
- Details: This will contain details about the selected element
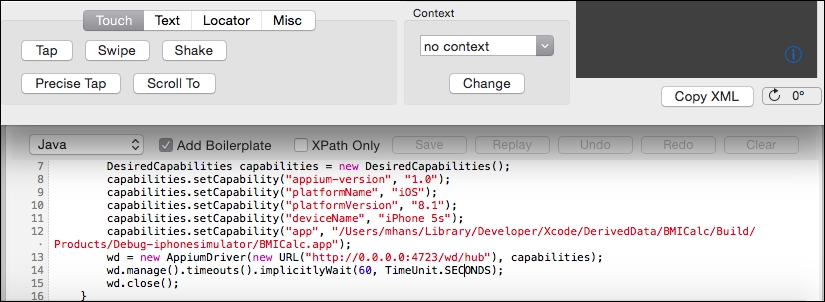
You will find some more options such as the Touch section, Text section, Alerts section, Locator, and Misc, which will further categorize into some buttons that can take an action on the application under test.
Let's take a look at the following options:
- Touch: This contains buttons to execute touch events such as tap, swipe, shake, and scroll
- Text: This contains buttons to execute text events, such as typing and firing the JavaScript
- Locator: This is a useful option provided by Appium; by using this, we can check whether the elements exist or not on the basis of locators.
- Misc: This contains the buttons that can handle the alerts
This panel contains the test scripts generated by the recorded actions that are performed on the application. It also contains some options that we can take on the recorded test scripts. Let's take a look at the panel's options:
- A dropdown for language selection: You can change the recorded test scripts' language from the dropdown (in the screenshot, we selected Java)
- Add Boilerplate: This will display the code with the Selenium instance along with the recorded scripts; otherwise, this will only show the code from the actions you have recorded
- XPath Only: This will generate the scripts using the XPath identifier only
- Replay: By clicking on the Replay button, we can execute the recorded scripts
- Undo: This will delete the last recorded action
- Redo: This will add the last undone action back
- Clear: This will clear the recorded actions