Appium has different locators to find elements on the mobile apps that can be used while testing. In this chapter, we will discuss some techniques to find an element for native and hybrid apps using the uiautomator and Appium inspector. To find an element for web-based applications, we will see a Chrome add-on to remotely inspect the web elements.
In this chapter, we will learn the following topics:
- Finding elements using the Chrome ADB plugin
- Finding elements using the Safari Develop option
- Finding elements using UIAutomatorviewer and Appium Inspector
- Finding elements on mobile apps by
id,Name,LinkText,Xpath,cssSelector,ClassName,AccessibilityId,AndroidUIAutomator, andIosUIAutomation
To find an element for web apps, we need to install an add-on in order to remotely inspect the web elements. The Chrome browser gives us an ADB (add-on) to access the source code of the mobile apps remotely. You can download it from https://chrome.google.com/webstore/detail/adb/dpngiggdglpdnjdoaefidgiigpemgage?hl=en-GB (Make sure you've installed Chrome Version 32 or later on your desktop.).
Once the add-on is installed, perform the following steps to set up the device for remote debugging:
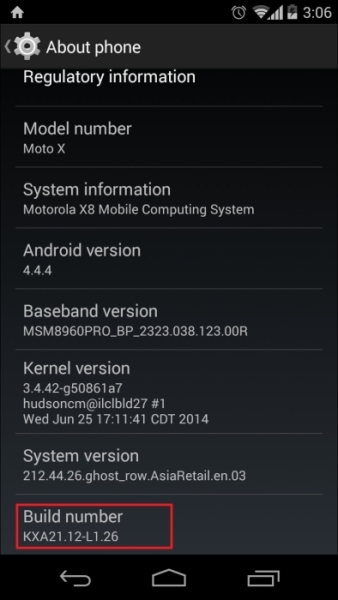
- Go to Settings | About Phone and tap on Build number seven times (assuming that you have Android Version 4.2 or newer). Then, return to the previous screen and find Developer options, as shown in the following screenshot:
- Tap on Developer options and click on ON in the developer settings (you will get an alert to allow developer settings; just click on the OK button); make sure that the USB debugging option is checked:

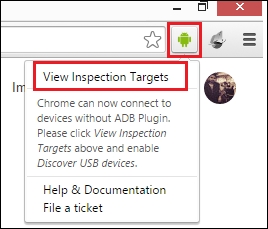
- Now, go to your desktop Chrome browser (assuming that you've already installed the ADB plugin), click on the ADB plugin icon—which is in the top-right corner of the screen—and click on View Inspection Targets:
- Use a USB cable to connect your Android device to the desktop (make sure you've installed the appropriate USB driver for your device). After you connect, you will get an alert on your device to allow USB debugging; just tap on OK.
- Open the Chrome browser on your device and navigate to the desired URL (we will open www.google.com).
- Once you set up your device for debugging, then the chrome://inspect/#devices page will display all the connected devices along with the open tabs and web views. Make sure Discover USB devices is checked, as shown here:
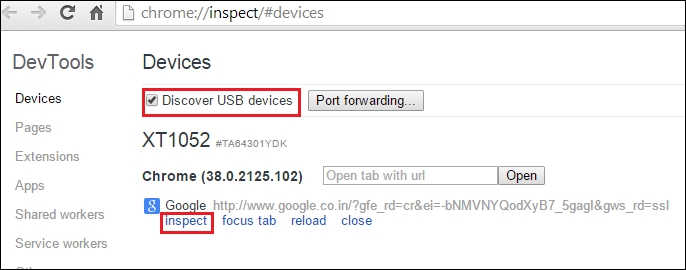
- Now, click on the inspect link to open the developer tools; you will get the following screen. Now, click on the screencast icon, in the top-right corner, to display your device's screen:
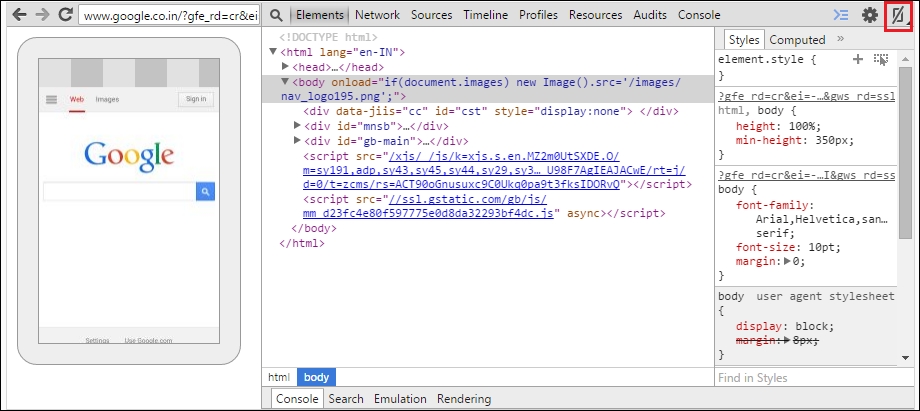
Now we can easily inspect elements with Chrome DevTools.
