Scenario
Suppose that a loan company has given loans to people with different features (for example, employment status, home ownership, credit grade, and so on), and you want to see the relationships between some of those variables.
Aim
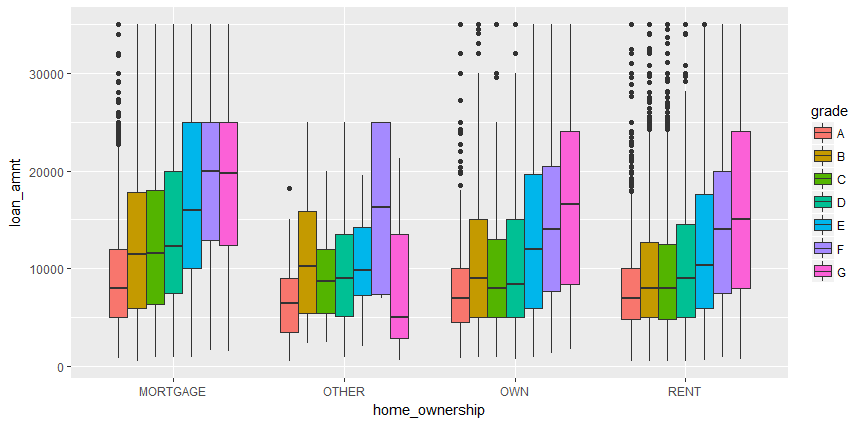
To view the distribution of loan amount versus home ownership using a plot with color differentiation on the basis of credit grade.
Steps for Completion
- Use the LoanStats dataset and make a subset.
- Clean the dataset (removing the NONE and NA cases).
- Create a boxplot showing the loan amount versus home ownership.
- Color differentiate by credit grade.
The following plot should be obtained:

