1
Introduction
Are you ready for your first encounter with web scraping? Let us start with a small example that you can recreate directly on your machine, provided you have R installed. The case study gives a first impression of the book's central themes.
1.1 Case study: World Heritage Sites in Danger
The United Nations Educational, Scientific and Cultural Organization (UNESCO) is an organization of the United Nations which, among other things, fights for the preservation of the world's natural and cultural heritage. As of today (November 2013), there are 981 heritage sites, most of which of are man-made like the Pyramids of Giza, but also natural phenomena like the Great Barrier Reef are listed. Unfortunately, some of the awarded places are threatened by human intervention. Which sites are threatened and where are they located? Are there regions in the world where sites are more endangered than in others? What are the reasons that put a site at risk? These are the questions that we want to examine in this first case study.
What do scientists always do first when they want to get up to speed on a topic? They look it up on Wikipedia! Checking out the page of the world heritage sites, we stumble across a list of currently and previously endangered sites at http://en.wikipedia.org/wiki/List_of_World_Heritage_in_Danger. You find a table with the current sites listed when accessing the link. It contains the name, location (city, country, and geographic coordinates), type of danger that is facing the site, the year the site was added to the world heritage list, and the year it was put on the list of endangered sites. Let us investigate how the sites are distributed around the world.
While the table holds information on the places, it is not immediately clear where they are located and whether they are regionally clustered. Rather than trying to eyeball the table, it could be very useful to plot the locations of the places on a map. As humans deal well with visual information, we will try to visualize results whenever possible throughout this book. But how to get the information from the table to a map? This sounds like a difficult task, but with the techniques that we are going to discuss extensively in the next pages, it is in fact not. For now, we simply provide you with a first impression of how to tackle such a task with R. Detailed explanations of the commands in the code snippets are provided later and more systematically throughout the book.
To start, we have to load a couple of packages. While R only comes with a set of basic, mostly math- and statistics-related functions, it can easily be extended by user-written packages. For this example, we load the following packages using the library() function:1
R> library(stringr)
R> library(XML)
R> library(maps)
In the next step, we load the data from the webpage into R. This can be done easily using the readHTMLTable() function from the XML package:
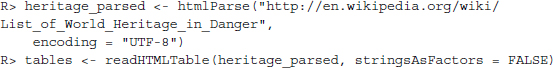
We are going to explain the mechanics of this step and all other major web scraping techniques in more detail in Chapter 9. For now, all you need to know is that we are telling R that the imported data come in the form of an HTML document. R is capable of interpreting HTML, that is, it knows how tables, headlines, or other objects are structured in this file format. This works via a so-called parser, which is called with the function htmlParse(). In the next step, we tell R to extract all HTML tables it can find in the parsed object heritage_parsed and store them in a new object tables. If you are not already familiar with HTML, you will learn that HTML tables are constructed from the same code components in Chapter 2. The readHTMLTable() function helps in identifying and reading out these tables.
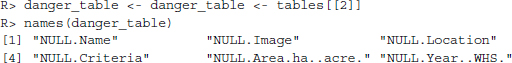
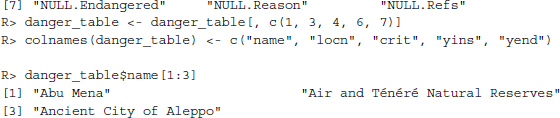
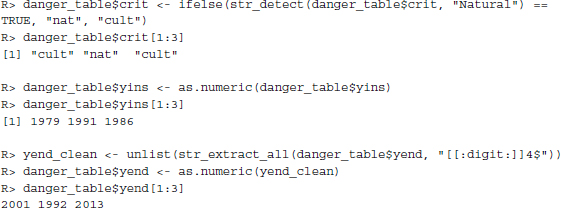
All the information we need is now contained in the tables object. This object is a list of all the tables the function could find in the HTML document. After eyeballing all the tables, we identify and select the table we are interested in (the second one) and write it into a new one, named danger_table. Some of the variables in our table are of no further interest, so we select only those that contain information about the site's name, location, criterion of heritage (cultural or natural), year of inscription, and year of endangerment. The variables in our table have been assigned unhandy names, so we relabel them. Finally, we have a look at the names of the first few sites:
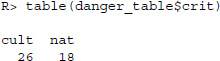
This seems to have worked. Additionally, we perform some simple data cleaning, a step often necessary when importing web-based content into R. The variable crit, which contains the information whether the site is of cultural or natural character, is recoded, and the two variables y_ins and y_end are turned into numeric ones.2 Some of the entries in the y_end variable are ambiguous as they contain several years. We select the last given year in the cell. To do so, we specify a so-called regular expression, which goes [[:digit:]]4$—we explain what this means in the next paragraph:
The locn variable is a bit of a mess, exemplified by three cases drawn from the data-set:
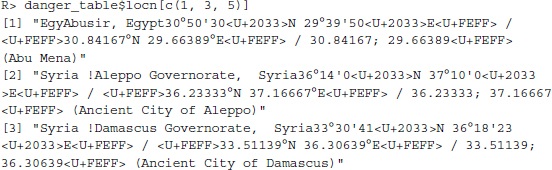
The variable contains the name of the site's location, the country, and the geographic coordinates in several varieties. What we need for the map are the coordinates, given by the latitude (e.g., 30.84167N) and longitude (e.g., 29.66389E) values. To extract this information, we have to use some more advanced text manipulation tools called “regular expressions”, which are discussed extensively in Chapter 8. In short, we have to give R an exact description of what the information we are interested in looks like, and then let R search for and extract it. To do so, we use functions from the stringr package, which we will also discuss in detail in Chapter 8. In order to get the latitude and longitude values, we write the following:
R> reg_y <-"[/][ -]*[[:digit:]]*[.]*[[:digit:]]*[;]"
R> reg_x <-"[;][ -]*[[:digit:]]*[.]*[[:digit:]]*"
R> y_coords <- str_extract(danger_table$locn, reg_y)
R> y_coords <- as.numeric(str_sub(y_coords, 3, -2))
R> danger_table$y_coords <- y_coords
R> x_coords <- str_extract(danger_table$locn, reg_x)
R> x_coords <- as.numeric(str_sub(x_coords, 3, -1))
R> danger_table$x_coords <- x_coords
R> danger_table$locn <- NULL
Do not be confused by the first two lines of code. What looks like the result of a monkey typing on a keyboard is in fact a precise description of the coordinates in the locn variable. The information is contained in the locn variable as decimal degrees as well as in degrees, minutes, and seconds. As the decimal degrees are easier to describe with a regular expression, we try to extract those. Writing regular expressions means finding a general pattern for strings that we want to extract. We observe that latitudes and longitudes always appear after a slash and are a sequence of several digits, separated by a dot. Some values start with a minus sign. Both values are separated by a semicolon, which is cut off along with the empty spaces and the slash. When we apply this pattern to the locn variable with the str_extract() command and extract the numeric information with str_sub(), we get the following:
R> round(danger_table$y_coords, 2)[1:3]
[1] 30.84 18.28 36.23

R> round(danger_table$x_coords, 2)[1:3]
[1] 29.66 8.00 37.17
This seems to have worked nicely. We have retrieved a set of 44 coordinates, corresponding to 44 World Heritage Sites in Danger. Let us have a first look at the data. dim() returns the number of rows and columns of the data frame; head() returns the first few observations:
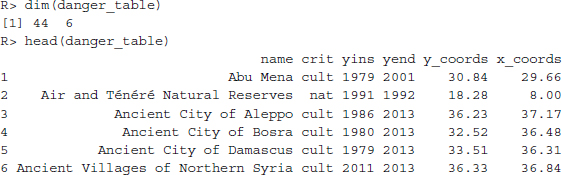
The data frame consists of 44 observations and 6 variables. The data are now set up in a way that we can proceed with mapping the sites. To do so, we use another package named “maps.” In it we find a map of the world that we use to pinpoint the sites’ locations with the extracted y and x coordinates. The result is displayed in Figure 1.1. It was generated as follows:
R> pch <- ifelse(danger_table$crit =="nat", 19, 2)
R> map("world", col ="darkgrey", lwd = 0.5, mar = c(0.1, 0.1, 0.1, 0.1))
R> points(danger_table$x_coords, danger_table$y_coords, pch = pch)
R> box()
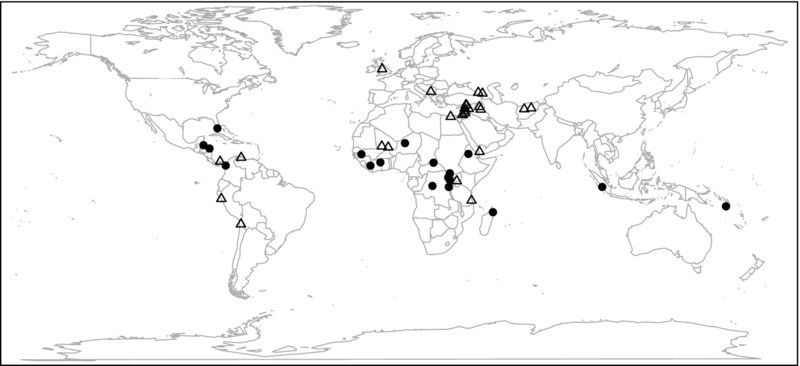
Figure 1.1 Location of UNESCO World Heritage Sites in danger (as of March 2014). Cultural sites are marked with triangles, natural sites with dots
We find that many of the endangered sites are located in Africa, the Middle East, and Southwest Asia, and a few others in South and Central America. The endangered cultural heritage sites are visualized as the triangle. They tend to be clustered in the Middle East and Southwest Asia. Conversely, the natural heritage sites in danger, here visualized as the dots, are more prominent in Africa. We find that there are more cultural than natural sites in danger.
We can speculate about the political, economic, or environmental conditions in the affected countries that may have led to the endangerment of the sites. While the information in the table might be too sparse for firm inferences, we can at least consider some time trends and potential motives of the UNESCO itself. For that purpose, we can make use of the two variables y_ins and y_end, which contain the year a site was designated a world heritage and the year it was put on the list of endangered World Heritage Sites. Consider Figure 1.2, which displays the distribution of the second variable that we generated using the hist() command. We find that the frequency with which sites were put on the “red list” has risen in recent decades—but so has the number of World Heritage Sites:
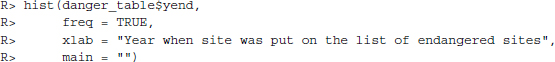
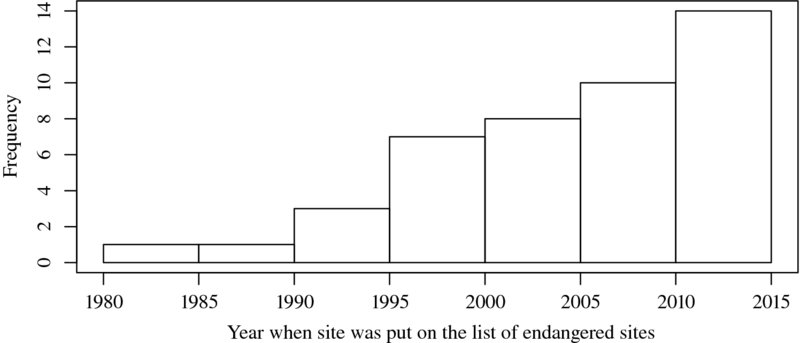
Figure 1.2 Distribution of years when World Heritage Sites were put on the list of endangered sites
Even more interesting is the distribution of time spans between the year of inscription and the year of endangerment, that is, the time it took until a site was put on the “red list” after it had achieved World Heritage Site status. We calculate this value by subtracting the endangerment year from the inscription year. The result is plotted in Figure 1.3.
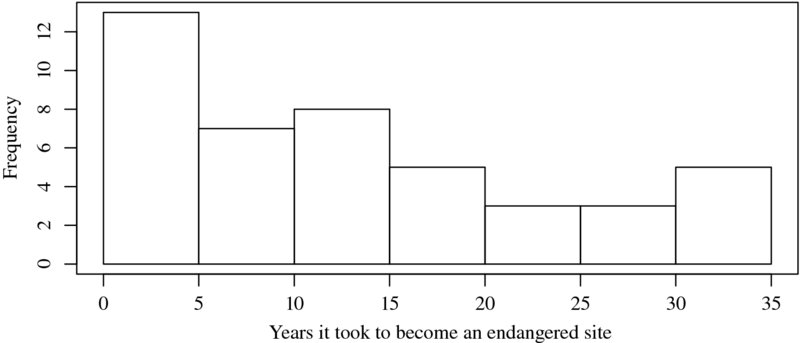
Figure 1.3 Distribution of time spans between year of inscription and year of endangerment of World Heritage Sites in danger
Many of the sites were put on the red list only shortly after their designation as world heritage. According to the official selection criteria for becoming a cultural or natural heritage, it is not a necessary condition to be endangered. In contrast, endangered sites run the risk of losing their status as world heritage. So why do they become part of the List of World Heritage Sites when it is likely that the site may soon run the risk of losing it again? One could speculate that the committee may be well aware of these facts and might use the list as a political means to enforce protection of the sites.
Now take a few minutes and experiment with the gathered data for yourself! Which is the country with the most endangered sites? How effective is the List of World Heritage Sites in Danger? There is another table on the Wikipedia page that has information about previously listed sites. You might want to scrape these data as well and incorporate them into the map.
Using only few lines of code, we have enriched the data and gathered new insights, which might not have been obvious from examining the table alone.3 This is a variant of the more general mantra, which will occur throughout the book: Data are abundant—retrieve them, prepare them, use them.
1.2 Some remarks on web data quality
The introductory example has elegantly sidestepped some of the more serious questions that are likely to arise when approaching a research problem. What type of data is most suited to answer your question? Is the quality of the data sufficiently high to answer your question? Is the information systematically flawed? Although this is not a book on research design or advanced statistical methods to tackle noise in data, we want to emphasize these questions before we start harvesting gigabytes of information.
When you look at online data, you have to keep its origins in mind. Information can be firsthand, like posts on Twitter or secondhand data that have been copied from an offline source, or even scraped from elsewhere. There may be situations where you are unable to retrace the source of your data. If so, does it make sense to use data from the Web? We think the answer is yes.
Regarding the transparency of the data generation, web data do not differ much from other secondary sources. Consider Wikipedia as a popular example. It has often been debated whether it is legitimate to quote the online encyclopedia for scientific and journalistic purposes. The same concerns are equally valid if one cares to use data from Wikipedia tables or texts for analysis. It has been shown that Wikipedia's accuracy varies. While some studies find that Wikipedia is comparable to established encyclopedias (Chesney 2006; Giles 2005; Reavley et al. 2012), others suggest that the quality might, at times, be inferior (Clauson et al. 2008; Leithner et al. 2010; Rector 2008). But how do you know when relying on one specific article? It is always recommended to find a second source and to compare the content. If you are unsure whether the two sources share a common source, you should repeat the process. Such cross-validations should be standard for the use of any secondary data source, as reputation does not prevent random or systematic errors.
Besides, data quality is nothing that is stuck to the data like a badge, but rather depends on the application. A sample of tweets on a random day might be sufficient to analyze the use of hash tags or gender-specific use of words, but is less useful for predicting electoral outcomes when the sample happens to have been collected on the day of the Republican National Convention. In the latter case, the data are likely to suffer from a bias due to the collection day, that is, they lack quality in terms of “representativeness.” Therefore, the only standard is the one you establish yourself. As a matter of fact, quality standards are more alike when dealing with factual data—the African elephant population most likely has not tripled in the past 6 months and Washington D.C., not New York, is the capital of the United States.
To be sure, while it is not the case that demands on data quality should be lower when working with online data, the concerns might be different. Imagine you want to know what people think about a new phone. There are several standard approaches to deal with this problem in market research. For example, you could conduct a telephone survey and ask hundreds of people if they could imagine buying a particular phone and the features in which they are most interested. There are plenty of books that have been written about the pitfalls of data quality that are likely to arise in such scenarios. For example, are the people “representative” of the people I want to know something about? Are the questions that I pose suited to solicit the answers to my problem?
Another way to answer this question with data could be to look for “proxies,” that is, indicators that do not directly measure the product's popularity itself, but which are strongly related. If the meaning of popularity entails that people prefer one product over a competing one, an indirect measurement of popularity could be the sales statistics on commercial websites. These statistics usually contain rankings of all phones currently on sale. Again, questions of representativeness arise—both with regard to the listed phones (are some phones not on the list because the commercial website does not sell them?) and the customers (who buy phones from the Web and from a particular site?). Nevertheless, the ranking does provide a more comprehensive image of the phone market—possibly more comprehensive than any reasonably priced customer survey could ever hope to be. The availability of entirely new information is probably the most important argument for the use of online data, as it allows us to answer new questions or to get a deeper understanding of existing questions. Certainly, hand in hand with this added value arise new questions of data quality—can phones of different generations be compared at all, and can we say anything about the stability of such a ranking? In many situations, choosing a data source is a trade-off between advantages and disadvantages, accuracy versus completeness, coverage versus validity, and so forth.
To sum up, deciding which data to collect for your application can be difficult. We propose five steps that might help to guide your data collection process:
- Make sure you know exactly what kind of information you need. This can be specific (“the gross domestic product of all OECD countries for the last 10 years”) or vague (“peoples' opinion on company X's new phone,” “collaboration among members of the US senate”).
- Find out whether there are any data sources on the Web that might provide direct or indirect information on your problem. If you are looking for hard facts, this is probably easy. If you are interested in rather vague concepts, this is more difficult. A country's embassy homepage might be a valuable source for foreign policy action that is often hidden behind the curtain of diplomacy. Tweets might contain opinion trends on pretty much everything, commercial platforms can inform about customers’ satisfaction with products, rental rates on property websites might hold information on current attractiveness of city quarters....
- Develop a theory of the data generation process when looking into potential sources. When were the data generated, when were they uploaded to the Web, and by whom? Are there any potential areas that are not covered, consistent or accurate, and are you able to identify and correct them?
- Balance advantages and disadvantages of potential data sources. Relevant aspects might be availability (and legality!), costs of collection, compatibility of new sources with existing research, but also very subjective factors like acceptance of the data source by others. Also think about possible ways to validate the quality of your data. Are there other, independent sources that provide similar information so that random cross-checks are possible? In case of secondary data, can you identify the original source and check for transfer errors?
- Make a decision! Choose the data source that seems most suitable, document your reasons for the decision, and start with the preparations for the collection. If it is feasible, collect data from several sources to validate data sources. Many problems and benefits of various data collection strategies come to light only after the actual collection.
1.3 Technologies for disseminating, extracting, and storing web data
Collecting data from the Web is not always as easy as depicted in the introductory example. Difficulties arise when data are stored in more complex structures than HTML tables, when web pages are dynamic or when information has to be retrieved from plain text. There are some costs involved in automated data collection with R, which essentially means that you have to gain basic knowledge of a set of web and web-related technologies. However, in our introduction to these fundamental tools we stick to the necessary basics to perform web scraping and text mining and leave out the less relevant details where possible. It is definitely not necessary to become an expert in all web technologies in order to be able to write good web scrapers.
There are three areas that are important for data collection on the Web with R. Figure 1.4 provides an overview of the three areas. In the remainder of this section, we will motivate each of the subfields and illustrate their various linkages. This might help you to stay on top of things when you study the fundamentals in the first part of the book before moving on to the actual web scraping tasks in the book's second part.

Figure 1.4 Technologies for disseminating, extracting, and storing web data
1.3.1 Technologies for disseminating content on the Web
In the first pillar we encounter technologies that allow the distribution of content on the Web. There are multiple ways of how data are disseminated, but the most relevant technologies in this pillar are XML/HTML, AJAX, and JSON (left column of Figure 1.4).
For browsing the Web, there is a hidden standard behind the scenes that structures how information is displayed—the Hypertext Markup Language or HTML. Whether we look for information on Wikipedia, search for sites on Google, check our bank account, or become social on Twitter, Facebook, or YouTube—using a browser means using HTML. Although HTML is not a dedicated data storage format, it frequently contains the information that we are interested in. We find data in texts, tables, lists, links, or other structures. Unfortunately, there is a difference between the way data are presented in a browser on the one side and how they are stored within the HTML code on the other. In order to automatically collect data from the Web and process them with R, a basic understanding of HTML and the way it stores information is indispensable. We provide an introduction to HTML from a web scraper's perspective in Chapter 2.
The Extensible Markup Language or XML is one of the most popular formats for exchanging data over the Web. It is related to HTML in that both are markup languages. However, while HTML is used to shape the display of information, the main purpose of XML is to store data. Thus, HTML documents are interpreted and transformed into pretty-looking output by browsers, whereas XML is “just” data wrapped in user-defined tags. The user-defined tags make XML much more flexible for storing data than HTML. In recent years, XML and its derivatives—so-called schemes—have proliferated in various data exchanges between web applications. It is therefore important to be familiar with the basics of XML when gathering data from the Web (Chapter 3). Both HTML and XML-style documents offer natural, often hierarchical, structures for data storage. In order to recognize and interpret such structures, we need software that is able to “understand” these languages and handle them adequately. The necessary tools—parsers—are introduced in Chapters 2 and 3.
Another standard data storage and exchange format that is frequently encountered on the Web is the JavaScript Object Notation or JSON. Like XML, JSON is used by many web applications to provide data for web developers. Imagine both XML and JSON as standards that define containers for plain text data. For example, if developers want to analyze trends on Twitter, they can collect the necessary data from an interface that was set up by Twitter to distribute the information in the JSON format. The main reason why data are preferably distributed in the XML or JSON formats is that both are compatible with many programming languages and software, including R. As data providers cannot know the software that is being used to postprocess the information, it is preferable for all parties involved to distribute the data in formats with universally accepted standards. The logic of JSON is introduced in the second part of Chapter 3.
AJAX is a group of technologies that is now firmly integrated into the toolkit of modern web developing. AJAX plays a tremendously important role in enabling websites to request data asynchronously in the background of the browser session and update its visual appearance in a dynamic fashion. Although we owe much of the sophistication in modern web apps to AJAX, these technologies constitute a nuisance for web scrapers and we quickly run into a dead end with standard R tools. In Chapter 6 we focus on JavaScript and the XMLHttpRequest, two key technologies, and illustrate how an AJAX-enriched website departs from the classical HTML/HTTP logic. We also discuss a solution to this problem using browser-integrated Web Developer Tools that provide deep access to the browser internals.
We frequently deal with plain text data when scraping information from the Web. In a way, plain text is part of every HTML, XML, and JSON document. The crucial property we want to stress is that plain text is unstructured data, at least for computer programs that simply read a text file line by line. There is no introductory chapter to plain text data, but we offer a guide on how to extract information from such data in Chapter 8.
To retrieve data from the Web, we have to enable our machine to communicate with servers and web services. The lingua franca of communication on the Web is the Hypertext Transfer Protocol (HTTP). It is the most common standard for communication between web clients and servers. Virtually every HTML page we open, every image we view in the browser, every video we watch is delivered by HTTP. Despite our continuous usage of the protocol we are mostly unaware of it as HTTP exchanges are typically performed by our machines. We will learn that for many of the basic web scraping applications we do not have to care much about the particulars of HTTP, as R can take over most of the necessary tasks just fine. In some instances, however, we have to dig deeper into the protocol and formulate advanced requests in order to obtain the information we are looking for. Therefore, the basics of HTTP are the subject of Chapter 5.
1.3.2 Technologies for information extraction from web documents
The second pillar of technologies for web data collection is needed to retrieve the information from the files we gather. Depending on the technique that has been used to collect files, there are specific tools that are suited to extract data from these sources (middle column of Figure 1.4). This section provides a first glance at the available tools. An advantage of using R for information extraction is that we can use all of the technologies from within R, even though some of them are not R-specific, but rather implementations via a set of packages.
The first tool at our disposal is the XPath query language. It is used to select specific pieces of information from marked up documents such as HTML, XML or any variant of it, for example SVG or RSS. In a typical data web scraping task, calling the webpages is an important, but usually only intermediate step on the way toward well-structured and cleaned datasets. In order to take full advantage of the Web as a nearly endless data source, we have to perform a series of filtering and extraction steps once the relevant web documents have been identified and downloaded. The main purpose of these steps is to recast information that is stored in marked up documents into formats that are suitable for further processing and analysis with statistical software. This task consists of specifying the data we are interested in and locating it in a specific document and then tailoring a query to the document that extracts the desired information. XPath is introduced in Chatper 4 as one option to perform these tasks.
In contrast to HTML or XML documents, JSON documents are more lightweight and easier to parse. To extract data from JSON, we do not draw upon a specific query language, but rely on high-level R functionality, which does a good job in decoding JSON data. We explain how it is done in Chapter 3.
Extracting information from AJAX-enriched webpages is a more advanced and complex scenario. As a powerful alternative to initiating web requests from the R console, we present the Selenium framework as a hands-on approach to getting a grip on web data. Selenium allows us to direct commands to a browser window, such as mouse clicks or keyboard inputs, via R. By working directly in the browser, Selenium is capable of circumventing some of the problems discussed with AJAX-enriched webpages. We introduce Selenium in one of our scraping scenarios of Chapter 9 in Section 9.1.9. This section discusses the Selenium framework as well as the RWebdriver package for R by means of a practical application.
A central task in web scraping is to collect the relevant information for our research problem from heaps of textual data. We usually care for the systematic elements in textual data—especially if we want to apply quantitative methods to the resulting data. Systematic structures can be numbers or names like countries or addresses. One technique that we can apply to extract the systematic components of the information are regular expressions. Essentially, regular expressions are abstract sequences of strings that match concrete, recurring patterns in text. Besides using them to extract content from plain text documents we can also apply them to HTML and XML documents to identify and extract parts of the documents that we are interested in. While it is often preferable to use XPath queries on markup documents, regular expressions can be useful if the information is hidden within atomic values. Moreover, if the relevant information is scattered across an HTML document, some of the approaches that exploit the document's structure and markup might be rendered useless. How regular expressions work in R is explained in detail in Chapter 8.
Besides extracting meaningful information from textual data in the form of numbers or names we have a second technique at our disposal—text mining. Applying procedures in this class of techniques allows researchers to classify unstructured texts based on the similarity of their word usages. To understand the concept of text mining it is useful to think about the difference between manifest and latent information. While the former describes information that is specifically linked to individual terms, like an address or a temperature measurement, the latter refers to text labels that are not explicitly contained in the text. For example, when analyzing a selection of news reports, human readers are able to classify them as belonging to particular topical categories, say politics, media, or sport. Text mining procedures provide solutions for the automatic categorization of text. This is particularly useful when analyzing web data, which frequently comes in the form of unlabeled and unstructured text. We elaborate several of the available techniques in Chapter 10.
1.3.3 Technologies for data storage
Finally, the third pillar of technologies for the collection of web data deals with facilities for data storage (right column of Figure 1.4). R is mostly well suited for managing data storage technologies like databases. Generally speaking, the connection between technologies for information extraction and those for data storage is less obvious. The best way to store data does not necessarily depend on its origin.
Simple and everyday processes like online shopping, browsing through library catalogues, wiring money, or even buying a couple of sweets at the supermarket all involve databases. We hardly ever realize that databases play such an important role because we do not interact with them directly—databases like to work behind the scenes. Whenever data are key to a project, web administrators will rely on databases because of their reliability, efficiency, multiuser access, virtually unlimited data size, and remote access capabilities. Regarding automated data collection, databases are of interest for two reasons: One, we might occasionally be granted access to a database directly and should be able to cope with it. Two, although, R has a lot of data management facilities, it might be preferable to store data in a database rather than in one of the native formats. For example, if you work on a project where data need to be made available online or if you have various parties gathering specific parts of your data, a database can provide the necessary infrastructure. Moreover, if the data you need to collect are extensive and you have to frequently subset and manipulate the data, it also makes sense to set up a database for the speed with which they can be queried. For the many advantages of databases, we introduce databases in Chapter 7 and discuss SQL as the main language for database access and communication.
Nevertheless, in many instances the ordinary data storage facilities of R suffice, for example, by importing and exporting data in binary or plain text formats. In Chapter 11, we provide some details on the general workflow of web scraping, including data management tasks.
1.4 Structure of the book
We wrote this book with the needs of a diverse readership in mind. Depending on your ambition and previous exposure to R, you may read this book from cover to cover or choose a section that helps you accomplish your task.
- If you have some basic knowledge of R but are not familiar with any of the scripting languages frequently used on the Web, you may just follow the structure as is.
- If you already have some text data and need to extract information from it, you might start with Chapter 8 (Regular expressions and string functions) and continue with Chapter 10 (Statistical text processing).
- If you are primarily interested in web scraping techniques, but not necessarily in scraping textual data, you might want to skip Chapter 10 altogether. We recommend reading Chapter 8 in either case, as text manipulation basics are also a fundamental technique for web scraping purposes.
- If you are a teacher, you might want to use the book as basic or supplementary literature. We provide a set of exercises after most of the chapters in Parts I and II for this purpose. Solutions are available on the book's website www.r-datacollection.com for about half the exercises, so you can assign them as homework or use them for test questions.
For all others, we hope you will find the structure useful as well. The following is a short outline of the book's three parts.
Part I: A primer on web and data technologies
In the first part, we introduce the fundamental technologies that underlie the communication, exchange, storage, and display of information on the World Wide Web (HTTP, HTML, XML, JSON, AJAX, SQL), and provide basic techniques to query web documents and datasets (XPath and regular expressions). These fundamentals are especially useful for readers who are unfamiliar with the architecture of the Web, but can also serve as a refresher if you have some prior knowledge. The first part of the book is explicitly focused on introducing the basic concepts for extracting the data as performed in the rest of the book, and on providing an extensive set of exercises to get accustomed quickly with the techniques.
Part II: A practical toolbox for web scraping and text mining
The book's second part consists of three core chapters: The first covers several scraping techniques, namely the use of regular expressions, XPath, various forms of APIs, other data types and source-specific techniques. We present a set of frequently occurring scenarios and apply popular R packages for these tasks. We also address legal aspects of web scraping and give advice on how to behave nicely on the Web. The second core chapter deals with techniques for statistical text processing. Data are frequently available in the form of text that has to be further analyzed to make it fit for subsequent analyses. We present several techniques of the two major methods for statistically processing text—supervised and unsupervised text classification—and show how latent information can be extracted. In the third chapter, we provide insights into frequently occurring topics in the management of data projects with R. We discuss how to work with the file system, how to use loops for more efficient coding, how to organize scraping procedures, and how to schedule scraping tasks that have to be executed on a regular basis.
Part III: A bag of case studies
In the third part of the book, we provide a set of applications that make use of the techniques introduced in the previous parts. Each of the case studies starts out with a short motivation and the goal of the analysis. The case studies go into more detail than the short examples in the technical chapters and address a wide range of problems. Moreover, they provide a practical insight into the daily workflow of data scraping and text processing, the pitfalls of real-life data, and how to avoid them. Additionally, this part comes with a tabular overview of the case studies' contents' with a view of the main techniques to retrieve the data from the Web or from texts and the main packages and functions used for these tasks.