When you first create a report and preview the data, the report displays the data in the order in which your data source returns it. The order varies, based on how data was entered in the data source and how you joined tables in the query.
In most cases, you will want to change the order in which data appears in the report. A customer phone list, for example, is easier to use if it is in alphabetical order. A sales report is more useful if it presents sales figures from highest to lowest, or the reverse, if you want to see low to top performers.
Compare the reports in Figure 12-1.
The report on the left displays customer names in the order the data set returns them, which is also called natural order. The report on the right displays customer names in alphabetical order. This report presents the data sorted by customer name.
Now, compare the reports in Figure 12-2. The report on the left sorts the data alphabetically by customer name. The report on the right also sorts the data alphabetically by customer name, but adds an additional sort criterion, by state. This report first groups the data by state. Within each state, the report sorts data by customer name.
As you can see from the examples, sorting and grouping are two essential ways to organize data for more effective viewing and analysis.
As the previous section describes, you sort data to display report data in a more meaningful order. Without sorting, a report can be much less usable. For example, it often displays data in seemingly random order, because that was the way the data was entered into the data source.
You can sort data in ascending or descending order, and you can sort by as many fields as you like. For example, you can sort a list of customers by credit rank, then by customer name.
Figure 12-3 shows the first six data rows in three lists. The first list is unsorted, the second sorts data by credit rank, and the third sorts data first by credit rank, then by customer name.
You sort data in one of two ways:
Specify sorting in the data set query so that the database processes the data before sending the results to BIRT. Specify sorting in the query whenever possible. Databases are efficient at sorting data, especially if they have indexes to optimize sorts.
Sort data in BIRT. Use this method if your data source, such as a text file, does not support sorting. If you group data, BIRT handles all sorting automatically.
How to sort data through the query
In Data Explorer, create a new data set, or edit an existing one.
In the query text area, write an ORDER BY clause in the SELECT statement. For example, the following statement returns customer information and sorts rows by credit rank, then by customer name.
     SELECT Customers.customerName,
     Customers.phone,
     Customers.creditRank
     FROM Customers
     ORDER BY Customers.creditRank, Customers.customerName
Choose Preview Results to verify the data that the query returns. The rows should be sorted by the fields in the ORDER BY clause.
Choose OK.
How to sort data in BIRT
The instructions in this section assume that you already inserted data in a report.
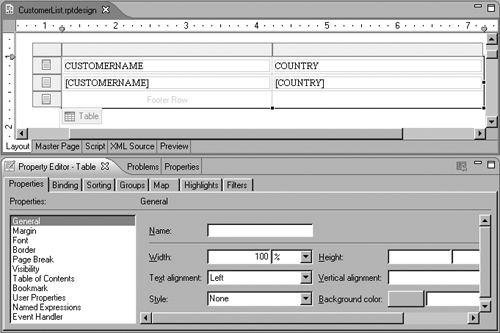
In the layout editor, select the table element or list element that contains the data that you want to sort. Property Editor displays the properties for the table or list.
Figure 12-4 shows an example of a selected table and the table’s properties.
Choose the Sorting tab in Property Editor.
On the sorting page, choose Add to specify the field to sort. The first line displays Key for Sort Key and Ascending for Sort Direction.
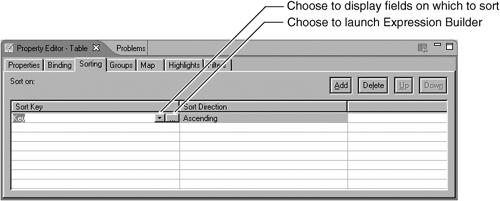
Select the cell under Sort Key. Two buttons appear on the right, as shown in Figure 12-5. The arrow button displays a list of fields by which you can sort. The ellipsis (…) button launches Expression Builder.
Complete one of the following steps:
To specify a field to sort by, select the arrow button, and choose a field.
To specify an expression by which to sort the data, choose the ellipsis button, then provide an expression in Expression Builder.
Specify the sort order by selecting Ascending or Descending under Sort Direction.
Preview the report. The data in the details section appears in a different order.
BIRT and some databases sort string data according to UCS2 code point values, so uppercase letters precede lowercase letters. For example, “Z” appears before “a.” The following list of values is an example of how BIRT sorts string data:
     ANG Resellers
     AV Stores, Co.
     Alpha Cognac
     American Souvenirs Inc
     Anna's Decorations, Ltd
     abc Shops
Most of the time, report users prefer to view a list of names in simple alphabetical order, without regard to capitalization. To display string values in case-insensitive alphabetical order, use JavaScript’s toUpperCase( ) or toLowerCase( ) function to convert the values to all uppercase or all lowercase before sorting.
The following expression is an example of a sort key expression that you specify on the sorting page of Property Editor:
row["CUSTOMERNAME"].toUpperCase()
Using this expression, the previous list of values appears alphabetically as:
     abc Shops
     Alpha Cognac
     American Souvenirs Inc
     ANG Resellers
     Anna's Decorations, Ltd
AV Stores, Co.It is common for reports to present data that is organized into meaningful groups. For example, rather than displaying a basic list of orders, an orders report can group orders by customers, then group customers by state. In addition to providing a more effective way to view data, grouped reports have other advantages over reports that are not grouped.
When you group data, you can:
Add titles or other text at the beginning of each group.
Add subtotals, counts, averages, or other summary information at the beginning or end of each group.
Insert a page break before or after each group.
Automatically generate a table of contents that displays the values of every group. The table of contents supports navigating to specific locations in the report.
Remove duplicate field values.
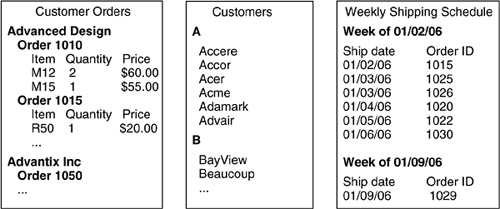
Compare the reports in Figure 12-6 and Figure 12-7. The report in Figure 12-6 displays customer order information in a simple list. The data rows are sorted by customer name, then by order number. Notice the repeated customer name and order ID information.
The report in Figure 12-7 shows data from the same data set. Unlike the first report, it groups the data rows by customers and order numbers, removing the repeated customer names and order numbers. The customer name and order totals appear at the beginning of each customer group. The order number appears at the beginning of each order group, and a subtotal appears at the end of each order. When the report is displayed in the BIRT report viewer, a table of contents appears to the left of the report.
To create the report in Figure 12-7, you use the customer and order ID fields to create two groups. The customer group is the outer, or top, group. The orders group is within the customer group. You can create as many groups as you want. In the example report, you could, for example, create a third group to organize customers by state. You could also add a fourth group to organize states by region. Practically, however, a report that contains too many groups can make the report difficult to read.
How to group data
The instructions in this section assume that you already inserted data in your report.
In the layout editor, select the table element or list element that contains the data that you want to group.
Choose Element →Add Group. New Group, shown in Figure 12-8, displays the properties you can set for the group.
Specify the properties of the group:
For Name, type a name for the group. The name identifies the group and appears in the Edit Group context menu, so you can easily find a specific group for editing later.
For Group On, select the field on which you want to group. The drop-down list displays all the fields associated with the table. You can group on a field in the table or a field that you have not used in the table. To group on a field that you have not used in the table, you must first create the column binding. Column binding is described in Chapter 8, “Binding Data.”
For Interval, you can select a grouping interval, then specify a range. You can also specify the initial value to use for calculating numeric intervals. For information about grouping by intervals, see “Grouping data by intervals,” later in this section.
For Hide Detail, specify whether or not to display the detail rows. Select this option to display only summary data in the group’s header or footer rows.
For TOC Item Expression, specify the expression that returns the values to display in the auto-generated table of contents. By default, the group values appear in the report’s table of contents.
For Sort Direction:
Select Ascending to sort the group values in ascending order.
Select Descending to sort the group values in descending order.
For Page Break, you can control where page breaks occur. If you want to display each group of data on its own page, you can insert a page break before or after each group. For more information about setting page breaks, see Chapter 21, “Designing a Multipage Report.”
For Filters, you can specify a filter condition to select group values that meet a certain criteria. For information about filtering group values, see Chapter 15, “Filtering Data.”
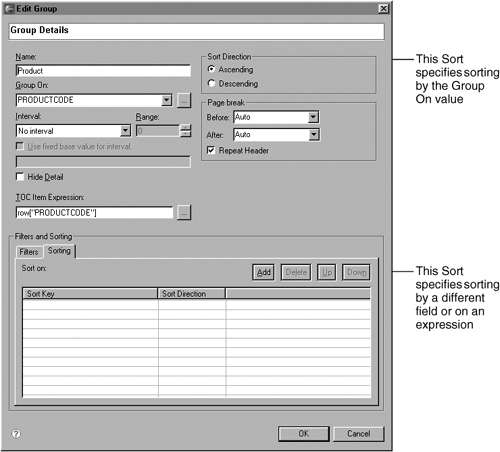
For Sorting, you can specify that the group values be sorted by a field other than the field on which the data is grouped. For information about sorting group values, see “Sorting data at the group level,” later in this chapter.
Choose OK to save the group.
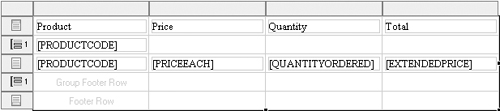
The table shows two new rows, group header and group footer. Figure 12-9 shows the new rows. BIRT Report Designer places a data element in the group header automatically. This data element displays the values of the field (PRODUCTCODE, in this example) on which the group is based.
Preview the report. The data is organized in groups.
To create additional groups, repeat all the previous steps.

When you create a group, BIRT’s default behavior is to group data by a single value, such as a customer name, an order ID, or a date. In the detailed orders report shown earlier in this chapter, each customer name starts a new group, and each order ID starts a new group within the customer group.
Sometimes, it is more useful to group data by a specific interval. A sales report, for example, can present sales by quarters, rather than by dates. Similarly, you can group data in a shipping report by weeks or months, rather than by dates.
Compare the reports in Figure 12-10 and Figure 12-11. The report in Figure 12-10 groups shipping information by dates.
Table 12-10. Typographical Conventions
Shipping Schedule | ||
Ship by | Order ID | Customer name |
01/02/2006 | 1440 | Advanced Engineering |
01/02/2006 | 1445 | Technical Design Corp. |
01/03/2006 | 1355 | Signal MicroSystems |
01/04/2006 | 1400 | InfoSpecialists Inc. |
01/05/2006 | 1320 | CompuDesign Co. |
01/09/2006 | 1410 | Brittan Design Inc. |
01/10/2006 | 1420 | Exosoft Corp |
01/11/2006 | 1250 | Technical Solutions Inc. |
01/11/2006 | 1325 | SigniMicro Systems |
01/12/2006 | 1500 | CompuBoards |
Table 12-11. Dates grouped into weekly intervals
Weekly Shipping Schedule | ||
Week of 01/02/2006 | ||
Ship by | Order ID | Customer name |
01/02/2006 | 1440 | Advanced Engineering |
01/02/2006 | 1445 | Technical Design Corp. |
01/03/2006 | 1355 | Signal MicroSystems |
01/04/2006 | 1400 | InfoSpecialists Inc. |
01/05/2006 | 1320 | CompuDesign Co. |
Week of 01/09/2006 | ||
Ship by | Order ID | Customer name |
01/09/2006 | 1410 | Brittan Design Inc. |
01/10/2006 | 1420 | Exosoft Corp |
01/11/2006 | 1250 | Technical Solutions Inc. |
01/11/2006 | 1325 | SigniMicro Systems |
01/12/2006 | 1500 | CompuBoards |
The report in Figure 12-11 groups the same shipping information by weeks.
As the reports show, grouping by interval provides the following benefits:
Organizes a long report into shorter, more readable pieces
Summarizes data further for more effective analysis
The following sections describe in more detail how to group string, numeric, and date-and-time data by intervals.
When you group string data by interval, the interval that you specify is a prefix of a particular length. For example, if a customer group sorts customers by name, you can group customers by the first letter of their names, or the first two letters, or the first three letters, and so on.
You typically group by the first letter to group names by letters of the alphabet. In a customer list, for example, you might want to group all customers whose names begin with A under the heading A, all customers whose names begin with B under the heading B, and so on.
You can group by multiple letters to group items whose names contain special prefixes for classification or categorization. A computer parts vendor, for example, might use the prefix ME for all memory chips, CP for CPU boards, MO for monitors, and so on. In this case, creating a computer parts list that groups names by the first two letters lends itself to logical groupings by part type.
Figure 12-12 shows the results of grouping names by the first letter, the first two letters, and the first three letters. Lines separate the groups.
How to group string data by intervals
When you group numeric data by intervals, you group by a range of numbers. For example, if an order group sorts orders by numeric ID, you can group the orders by intervals of 10, 50, 100, 1000, and so on.
The interval that is best for any set of numeric data depends on the range of numeric values. If the numbers range from 100 to 200, it makes sense to group in intervals of 10s. If the numbers range from 100 to 1000, you might want to group in intervals of 100.
Figure 12-13 shows the results of grouping numbers by intervals of 10, 100, and 1000. Lines separate the groups.
Groups are calculated from the first value in the data set. If the first number is 1070, and you use an interval of 10, the first group contains values from 1070 to 1079, the second group contains values from 1080 to 1089, and so on. In the example report that shows a grouping interval of 1000, the numbers 2005 and 2030 are not in a separate group, which is what you might expect, because the first group contains numbers from 1070 to 2069. The second group contains numbers from 2070 to 3069.
Rather than using the first data set value as the starting, or base, value for determining the grouping of numbers, you can specify a different base value to group numbers in more predictable ranges. Compare the two reports in Figure 12-14.
A base value of 1000 provides better results than a base value of 1070 when grouping by intervals of 1000. Rather than grouping numbers in groups of 1070–2069 and 2070–3069, the second report uses more logical groups of 1000–1999 and 2000–2999.
How to group numeric data by intervals
Create a group using the instructions in “How to group data,” earlier in this chapter.
Set the Interval field in the group editor to Interval.
Set Range to the desired grouping interval.
If you want to specify a starting value to use for calculating groups, select Use fixed base value for interval, and specify a number.
When you group date-and-time data by intervals, you group data by time periods, such as hours, days, weeks, months, and so on. Grouping by time periods is useful for reports that display information that has a time or schedule focus, such as weekly shipping schedules or quarterly sales figures.
The reports in Figure 12-15 show the results of grouping dates by weeks, months, and quarters. The lines separate the groups. Weekly groups start on Mondays, monthly groups start on the first date of the month, and quarterly groups are January 1–March 31, April 1–June 30, July 1–September 30, and October 1–December 31. If you group by year, the groups start on January 1 and end on December 31.
If you do not want to use the default start value for date-and-time groups, you can specify a different base value to group dates in different ranges. For example, if an organization’s fiscal year is October 1 to September 30, and you want to group ten years worth of data into yearly groups by fiscal year rather than by calendar year, you can specify a base value such as 10/01/1995. The report will display the data in the following groups: October 1, 1995–September 30, 1996; October 1, 1996–September 30, 1997; October 1, 1997–September 30, 1998; and so on.
How to group date-and-time data by intervals
Create a group using the instructions in “How to group data,” earlier in this chapter.
Set the Interval field in the group editor to one of the time period values, such as Year, Month, Week, Day, or Hour.
Set Range to the number of units to include in each group. For example, if you selected Week as the interval, specify 2 as the range to group data in two-week periods.
If you want to specify a different starting value to use for calculating groups, select Use fixed base value for interval, then specify a date.
When you create a group, the default setting specifies sorting the group values by the grouping field in ascending order. For example, if you create an order ID group, the default setting is to sort order ID values in ascending order. You can, however, sort the group values by a different field. For example, rather than sort group values by order ID, you can sort by order total.
Sorting at the group level is different from sorting at the detail row level. When you sort at the detail row level, you specify the sorting criteria on the Sorting page in Property Editor. When you sort at the group level, you specify the sorting criteria through the Groups page.
The report in Figure 12-16 groups sales data by product code. The group header, highlighted with a grey background, displays the product code and the sales total. The product code group uses the default sorting, which sorts by product code in ascending order, such as S10_1678, S10_1949, S10_2016, and so on.
The report in Figure 12-17 contains the same data as the report in Figure 12-16, but rather than sorting by product code, it sorts by the product sales total in ascending order.
By changing the field on which groups are sorted, you can choose the information to emphasize. As Figure 12-17 shows, the report can group sales data by product code but list them in order of sales total, which is often a more useful way to present sales information.
How to sort data at the group level
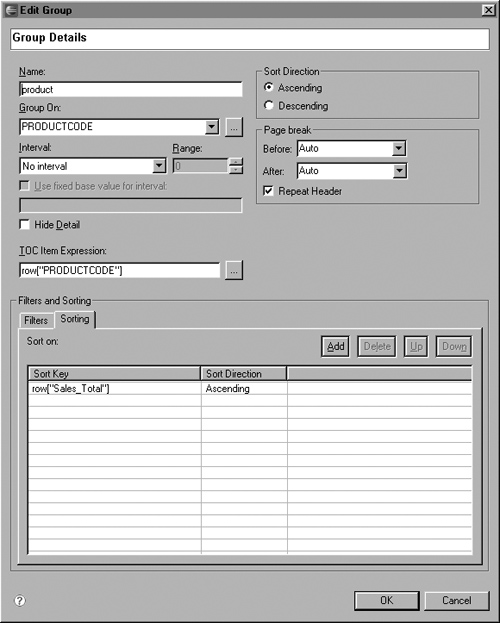
Create a group using the instructions in “How to group data,” earlier in this chapter. Figure 12-18 shows the group editor. You can specify sorting in two ways. The first way is to specify sorting by the grouping field. The second way enables you to specify a different field by which to sort and also enables you to specify a sort expression.
In Filters and Sorting, choose Sorting.
Choose Add to specify the field on which to sort the group values. Placeholder values appear on the first line.
Select the line under Sort Key. Two buttons appear on the right. The arrow button displays a list of fields by which you can sort. The ellipsis button (...) launches Expression Builder.
Specify the sort order by selecting Ascending or Descending under Sort Direction. Choose OK. Figure 12-19 shows an expression that sorts the group values by sales totals in ascending order.
Preview the report.
When you create multiple groups, the order in which you create them determines how the report groups data. Before you create groups, think about their order. For example, if you want to group data by state, then by city, create the groups in that order. In other words, state is the table or list’s first, or top-level, group, and city is the second, or inner, group.
The reports in Figure 12-20 show the results of creating the state and city groups in different orders. The first report shows the output when the state group is the top-level group. The second report shows the output when the city group is the top-level group.
Data in the first report is organized logically. The report shows each state in alphabetical order, then the cities are sorted alphabetically within each state. On the other hand, data in the second report is sorted by city first, resulting in repeated state headings that are organized in seemingly random order.
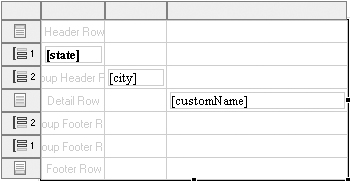
Figure 12-21 shows the report design for the first report. The state field appears in the group header 1 row, and the city field appears in the group header 2 row.
You can create groups using any of the following procedures. The procedure you use depends on your preference and whether you are creating all the groups for the first time or adding groups to an existing group structure.
To create groups that follow the order in which you create them, use one of the following procedures:
Select the table or list, then choose Element→Add Group from the main menu to create each group. For example, if you create a state group first and a city group second, the state group is the top-level group, and the city is the inner group.
Select the table or list, then choose the Groups tab on Property Editor. Like the previous technique, the order in which you create the groups determines the order in which data is grouped.
To add a group at the top level, select the table or list, then choose Insert Group →Above from the context menu. For example, if you already created a city group, use Insert Group →Above to add a state group as the top-level group.
To add a group at the lowest level, right-click the table or list, then choose Insert Group →Below from the table or list’s context menu. For example, if you already created a state group, choose Insert Group →Below to add a city group as the inner group.
To add a group between two existing groups, use one of the following procedures:
Right-click the group row above which to create the new group, then choose Insert Group →Above.
Right-click the group row below which to create the new group, then choose Insert Group →Below.
All the techniques display the Edit Group dialog box, where you define the properties of a group. If you inadvertently create groups in the wrong order, you can easily change the order of the groups. You do not have to delete and recreate the groups.
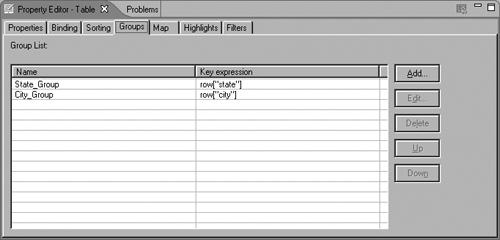
The Groups page in Property Editor shows all the groups that you create for a particular table or list. You must use this page, shown in Figure 12-24, to change the order of groups. You can also add, edit, and delete groups using this page.
You cannot change the order of groups by moving data elements in the layout editor. This action affects only the display position of the data values. Compare the report designs in Figure 12-22. The state and city data elements are transposed by dragging and dropping in the layout editor.
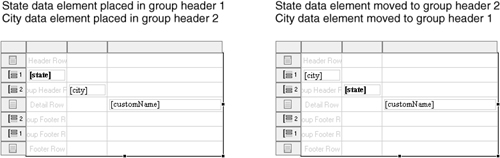
Now, compare the corresponding report output, shown in Figure 12-23. The first report shows data sorted by state, then by city. The second report displays the city values above the state values. The report data, however, is still sorted by state first, then by city.

How to change the order of groups
Select the table or list whose groups you want to re-order.
In Property Editor, choose the Groups tab. The Groups page displays the groups defined in the table or list, as shown in Figure 12-24.
This page displays the group names in the order in which the report currently groups the data.
Select a group from the list, then use the Up or Down button to move the selected group up or down the list. In the layout editor, the data elements change positions to reflect the new grouping order.
Repeat the previous step until you finish changing the order of groups.
If your report contains groups, you typically add a descriptive heading that appears at the beginning of each group to identify the data within the group. When you create a group, BIRT Report Designer automatically inserts a data element in the group header row to serve as the group heading. This data element displays the values of the field on which the group is based. For example, if you group data by state, the data element displays a state name for each group.
Unlike column headings, which are static, group headings change based on the content of the group. If a report groups data by customers, for example, you can display the customer name at the beginning of each group. For a customer list that groups names by the first letter, the titles for the groups are A, B, C, and so on. For a shipping schedule that groups data by weeks, the titles for the groups could be Week of 01/02/06, Week of 01/09/06, and so on.
The reports in Figure 12-25 show examples of headings that change with each group. Bold text highlights the group headings. If you do not use group headings, it is unclear where one group ends and another begins. Remove the A and B headings from the Customers report, for example, and the report looks like a list sorted alphabetically. You can add a line or space between groups to indicate a change in group, but a descriptive heading makes it easier for users to find information in the report.
Headings that are in a group header row appear above the detail rows. Sometimes, a report looks better if the headings appear in the first detail row of each group. Compare the examples in Figure 12-26. The example on the left shows the group headings, which are order numbers, in a row above the detail rows. The example on the right shows the group headings in the detail row.
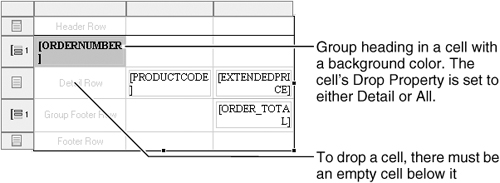
To display group headings on the same line as the first detail row, you drop the cell that contains the heading, using the Drop property. You cannot just move the group heading to the detail row, because it would be repeated for every row. To drop a cell, you must observe the following rules:
There must be an empty cell below the cell that contains the group heading. Otherwise, the cell content overwrites the content in the cell below it.
If a table contains multiple group header rows, you can drop only cells in the group header row directly above the detail row.
You can only drop cells in a group header row. You cannot drop cells in a detail or group footer row.
You can drop a group header cell so that it spans the detail rows, or all the rows in the group, including the group footer row. You see a difference only if the group header cell has a border or background color. Compare the examples in Figure 12-27. The example on the left drops the group header cell to the detail rows. The example on the right drops the group header cell to all the rows in the group.
Notice that the cell color in the example on the left extends to the last detail row, whereas the cell color in the example on the right extends to the group footer row. If the cell did not have a background color, the output would look the same whether you set the cell’s Drop property to Detail or All. The order numbers always appear in the first detail row of each group.
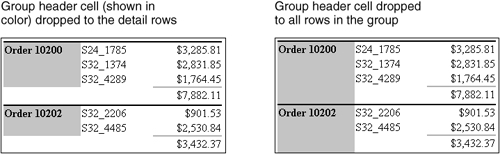
Figure 12-28 shows the portion of the report design that generates the previous example output.
How to drop a group heading to the detail row
Select the cell that contains the group heading you want to drop. The cell directly below it must be empty.
On Property Editor, choose General from the list of properties.
For Drop, select one of the following values:
These values display a difference in the generated report only if the cell has borders or background color.
Preview the report. The group heading appears in the first detail row of each group.
Unlike column headings, which you create using static text, you specify expressions for group headings because the heading values are dynamic. In other words, the value changes based on the group’s content. You can use a data set field, a computed field, or a text element with dynamic values, depending on the value that you want to display.
Typically, you use a computed field to combine a field value and static text. Sometimes, you use a JavaScript function to display the values you need. The following list shows some examples of expressions that you can use for group headings:
To display the customer name as the group heading, use the customer name field as the expression:
row["customerName"]
To display a group heading that combines static text with a field, insert a data element, and use an expression like the following example:
"Order " + row["orderID"]
To create headings (A, B, and so on) for a customer list that is grouped by the first letter, insert a data element, and use the JavaScript charAt( ) function to get the first letter of the name in each group:
row["customerName"].charAt(0)
To create headings that display the names of months (January, February, and so on) for each group of dates, insert an HTML text element, and use the following expression:
<VALUE-OF format="MMMM">row["shipByDate"]</VALUE-OF>
This tutorial provides instructions for grouping customer data by credit limit. It uses the report that you built in Tutorial 1: “Building a simple listing report,” in Chapter 4, “Learning the Basics.” In the first tutorial, you built a simple report that listed customers in alphabetical order. In this report, you organize customers into credit limit groups of $50,000.00, such as 0–49999, 50000–99999, 100000–149999, and so on.
Before you begin this tutorial, you must complete the first tutorial. In this tutorial, you perform the following tasks:
Open the report design.
Save the report as a new file.
Add the credit limit field to the data set.
Add credit limit data to the report.
Group customer data by credit limit.
Display credit limit ranges in the group header.
Display aggregate information.
Format the report.
Preview the report in the BIRT report viewer.
Display credit limit ranges in the table of contents.
In the first tutorial, you created Customers.rptdesign in a project folder named My Reports. Open Customers.rptdesign using one of the following procedures:
If you are using BIRT Report Designer, open the file through Navigator:
If you are using BIRT RCP Report Designer, use the main menu to open the file:
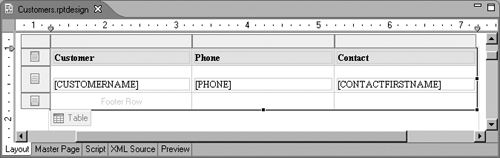
The file opens in the layout editor, as shown in Figure 12-29.
Rather than editing directly the report that you created in the first tutorial, save Customers.rptdesign as a new file.
In order for the report to display credit limit data, you must add the CREDITLIMIT field to the data set.
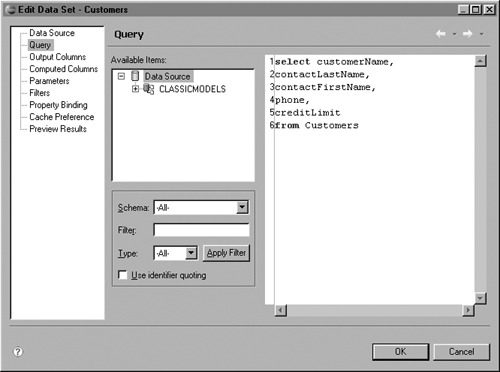
Choose Data Explorer, expand Data Sets, then double-click Customers. Edit Data Set displays the SQL query for the Customers data set.
In the query, add a comma (,) after phone.
On the next line, add the following text:
creditLimit
The modified query should look like the one shown in Figure 12-30.
Choose Preview Results to verify that the query returns rows with credit limit information.
Choose OK to save the data set.
In this procedure, you insert the credit limit field in the existing table.
In the layout editor, select the table. Guide cells appear at the top and left side of the table.
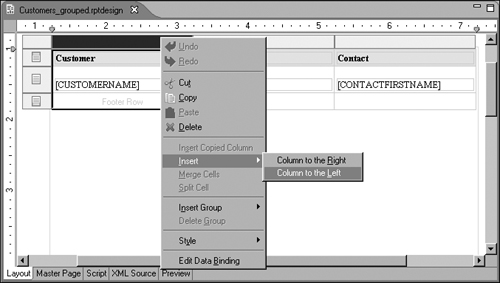
Right-click the guide cell above the first column, then choose Insert →Column to the Left, as shown in Figure 12-31.
A new column appears.
In Data Explorer, expand Data Sets, then expand Customers. The Customers data set displays the fields specified in the query.
Drag the CREDITLIMIT field from Data Explorer, and drop it in the detail row cell next to [CUSTOMERNAME]. BIRT Report Designer creates a named column, which is bound to the data set field. Select Data Binding displays this column binding.
Choose OK to accept the default column binding.
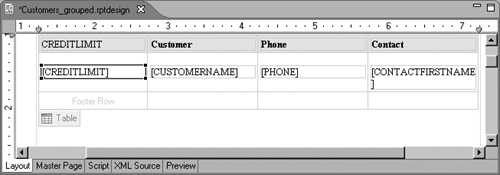
In the layout editor, the table displays the field that you added. The table also shows the label element that the layout editor automatically added to the header row. This label serves as the column heading and displays the field name as static text. The report should look like the one shown in Figure 12-32.
Edit the CREDITLIMIT label so that it appears as Credit Limit.
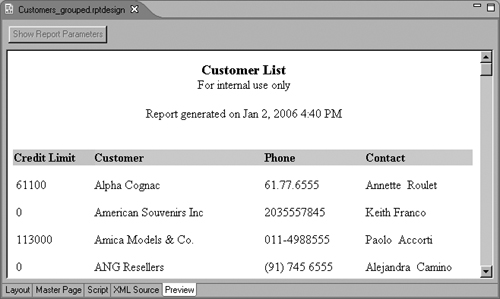
Preview the report. The report should look like the one shown in Figure 12-33.
Some of the customers have a credit limit of 0. These are new customers who have not yet been approved for a line of credit.
The report is currently sorted alphabetically by customer name. Recall that in the first tutorial, you specified that the rows in the table be sorted by customer name. In this procedure, you group the data by credit limit in intervals of 50,000. When you group data, BIRT sorts the rows into groups first, then it sorts the rows within each group, assuming that you also specify a sort condition at the table level. As you will see when you complete this task, the data rows within each credit limit group will be sorted by customer name.
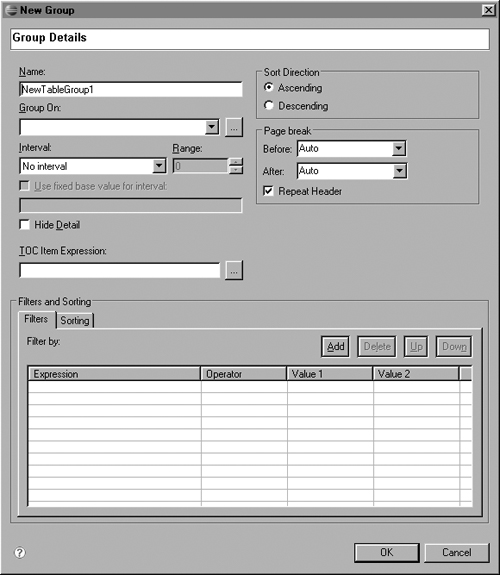
Right-click the table, and choose Insert Group →Above. New Group, shown in Figure 12-34, displays the group properties you can set.
Follow these steps to specify grouping by credit limit in intervals of 50000:
For Name, type the following text as the group name:
credit_group
For Group On, select CREDITLIMIT from the drop-down list.
For Interval, select Interval from the drop-down list.
For Range, type 50000.
Use the default values for the other options. Choose OK.
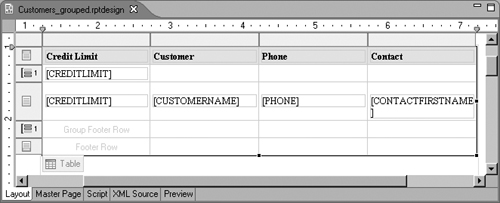
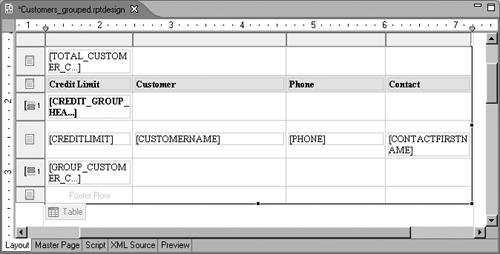
The table in the report design displays a group header and a group footer row, as shown in Figure 12-35. The table also shows the data element that the layout editor automatically added to the group header row. This data element serves as the group heading and, in the generated report, displays the first credit limit value of each group.
Select the [CREDITLIMIT] data element that appears in the group header row. Do not select the [CREDITLIMIT] data element that appears in the detail row.
In Property Editor, choose General, then choose B to format the group heading as bold text.
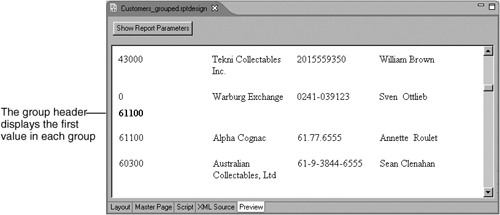
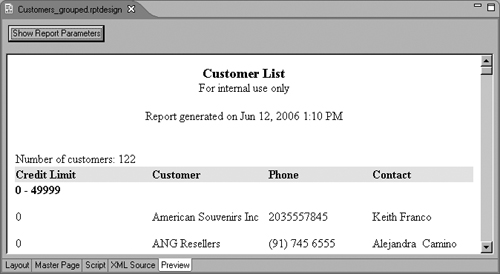
Preview the report. Scroll down the report to view all the data. The report organizes data into four credit limit groups. At the beginning of each group, you see the following numbers in bold: 0, 61100, 113000, 227600. These numbers match the first credit limit value of each group. Within each group, customer names are sorted in alphabetical order. Figure 12-36 shows one of the four credit limit groups.
Rather than display the first value of each group in the group header, the report is easier to navigate if it displays the credit limit range for each group, as follows:
     0 - 49999
     50000 - 99999
     100000 - 149999
This procedure shows how to write a JavaScript expression to display these credit limit ranges. The procedure also shows how to create a column binding with which to associate the JavaScript expression.
Choose Layout to return to the layout editor.
Select the table, and choose Binding on Property Editor.
Create a new column binding:
Choose Add.
In Expression Builder, type the following expression:
for(i=50000; i<300000; i+=50000){
   if( row["CREDITLIMIT"] < i ){
      rangeStart = i-50000;
      rangeEnd = i-1;
      break;
   }
}
displayString=rangeStart + " - " + rangeEnd;
Choose OK. The new column binding appears on the binding page of Property Editor with the column name highlighted.
Replace the name New Binding with the following name:
CREDIT_GROUP_HEADER
Update the CREDITLIMIT data element in the group header to use the new column binding. Double-click the data element and select CREDIT_GROUP_HEADER, then choose OK.
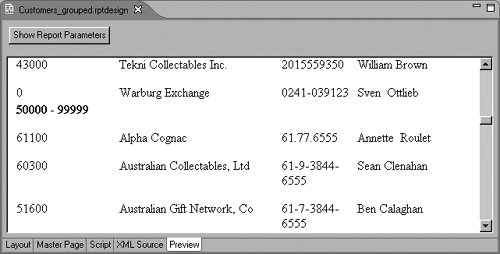
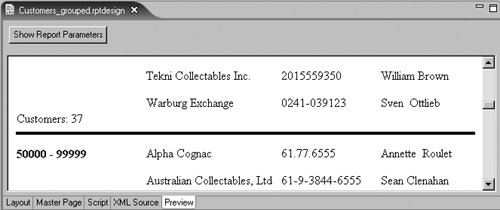
Preview the report. The group headers display the credit limit ranges. Figure 12-37 shows the 50000 - 99999 group header.
One of the benefits of grouping data is that you can add summary, or aggregate, information at the beginning or end of each group. In this procedure, you display the number of customers in each group and the number of all customers that are listed in the report.
Choose Layout to return to the layout editor.
Display the number of customers in each group:
Drag a data element from the palette, and drop it in the first cell in the group footer row. Elements that are in the group footer appear at the end of every group.
On Select Data Binding, create a new column binding:
On a new row, in Name, type the following text:
GROUP_CUSTOMER_COUNT
Use the default data type, Any.
In Expression, type the following aggregate expression:
"Customers: " + Total.count()
Total.count( ) returns the number of rows.
Use the default Aggregate On value, credit_group. This value indicates that the Total.count( ) function returns the number of rows in each credit limit group.
Select the column binding you just created, and choose OK. The data element uses the selected column binding.
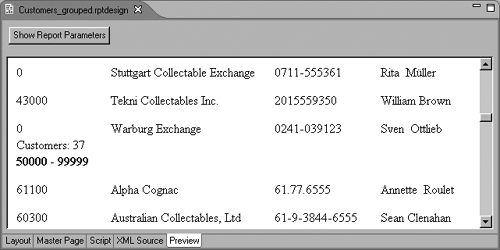
Preview the report. The report displays the number of customers at the end of each group, as shown in Figure 12-38.
Choose Layout to return to the layout editor.
Display the number of all customers:
Select the table. Guide cells appear at the top and left side of the table.
Right-click the guide cell on the left of the first row, Table - Header, then choose Insert →Row →Above.
A new table header row appears above the row that displays the column headings. It appears in color, because it inherited the properties of the row that follows it.
Select the new row, and, in Property Editor, change its background color to white.
Drag a data element from the palette, and drop it in the first cell in the new table header row. Elements that are in the table header appear at the beginning of the section.
On Select Data Binding, create a new column binding:
On a new row, in Name, type the following text:
TOTAL_CUSTOMER_COUNT
Use the default data type, Any.
In Expression, type the following expression, which combines static text with an aggregate calculation:
"Number of customers: " + Total.count()
Use the default Aggregate On value, ALL. This value indicates that the Total.count( ) function returns the number of rows in the entire table.
Select the column binding you just created, and choose OK. The data element uses the selected column binding. The report design should look like the one shown in Figure 12-39.
Preview the report. The report displays the number of customers at the beginning of the table, as shown in Figure 12-40.
Now that the report displays the correct data, you can focus on improving the report’s appearance. You perform the following tasks in this section:
Remove credit limit data from the detail rows.
Display group headings on the first row of each group.
Separate each group with a line.
To verify that data appears in the correct credit limit groups, it is useful to display each customer’s credit limit. Now that we have verified the data, we can delete the individual credit limit information from the report.
Choose Layout to return to the layout editor.
Delete the [CREDITLIMIT] data element from the detail row.
Preview the report. It should look like the one shown in Figure 12-41.

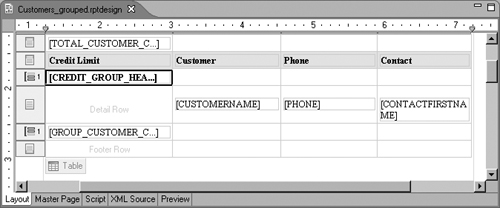
The credit limit group headings appear in their own rows, above the detail rows of each group. In this procedure, you drop the group headings so that they appear in the first detail row.
Choose Layout to return to the layout editor.
Select the cell that contains the group heading, as shown in Figure 12-42. Be sure to select the cell and not the data element in the cell.
In the General properties of Property Editor, set Drop to Detail. In the report design, the group heading still appears above the detail row because technically the element is still in the group header row.
In the Padding properties of Property Editor, set Padding—Top to 12 points. This setting aligns the group headings more precisely with the detail rows’ data. Remember that, in the first tutorial, we added a 12-point padding to the top of the detail row cells.
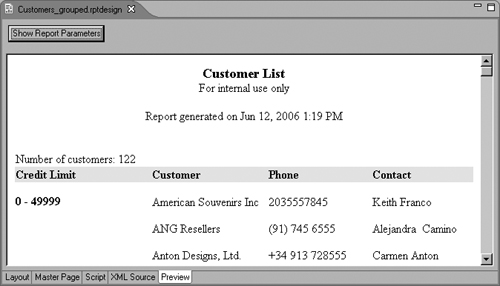
Preview the report. The group headings appear in the first row of each group, as shown in Figure 12-43.
Drawing a line to separate each group makes it easier to see the groups of data.
Choose Layout to return to the layout editor.
Select all the cells in the group footer row. To select multiple cells, use Shift-click.
Choose Border in Property Editor, then set the border properties:
Set Style to a solid line.
 Choose the button that shows the bottom border.
Add more space between the line and text above it. While the cells are still selected, choose the Padding properties in Property Editor, and set Bottom to 6.0 points.
Preview the report. A line appears at the end of each group, as shown in Figure 12-44.
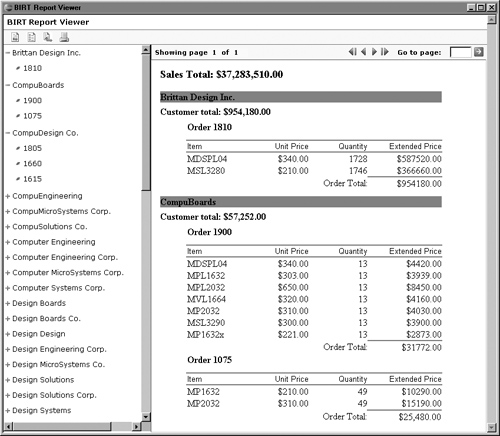
So far, you have been checking the report output in the BIRT Report Designer previewer. This time, you will use the report viewer to see what the report looks like when it is deployed. The report viewer provides additional functionality, including the capability of navigating to specific sections of a report using a table of contents. When you create groups in a report, BIRT automatically generates a table of contents, using the group values to show the hierarchy of the report.
Choose File → View Report in Web Viewer. The report appears in the report viewer.
 Choose the table of contents button, the left button at the top of the window, to display the table of contents. The table of contents displays the first value in each of the four credit limit groups. When you select a value, the report displays the corresponding section of the report. If you select 61100, for example, the report shows the customer rows in the 50000 - 99999 credit limit range, as shown in Figure 12-45.
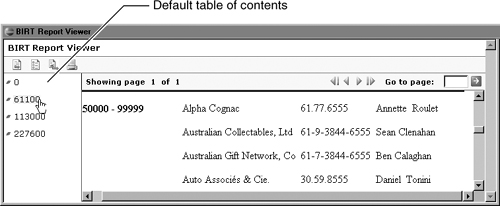
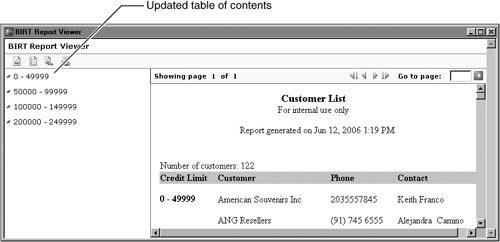
Rather than display the first value of each credit limit group, the table of contents makes more sense if it displays the same credit limit range values as the report. You accomplish this task by using the same JavaScript expression that you used previously to display credit limit ranges (0 - 49999, 50000 - 99999, and so on) in the group header.
Return to BIRT Report Designer.
In the layout editor, select the table, then choose the Groups tab in Property Editor.
Double-click credit_group in the list of groups. Edit Group displays the properties of the group. TOC Item Expression is set, by default, to the grouping field, row["CREDITLIMIT"].
Choose the ellipsis (...) button, and in Expression Builder, replace the row["CREDITLIMIT"] expression with the following expression. This is the same column-binding expression that is used by the data element in the group header. Rather than typing the expression again, you can copy it from the data element and paste it here.
for(i=50000; i<300000; i+=50000){
   if( row["CREDITLIMIT"] < i ){
      rangeStart = i-50000;
      rangeEnd = i-1;
      break;
   }
}
displayString=rangeStart + " - " + rangeEnd;
Choose OK.
Preview the report in the report viewer to verify the change in the table of contents. The table of contents displays the credit limit ranges, as shown in Figure 12-46.