You can build a report that contains multiple reports, called subreports, and you can lay out the subreports in a variety of configurations. For example, within a single report, you can
Display multiple reports, one after another. For example, you can display the top ten customers, top ten sales representatives, and top ten products.
Display multiple reports next to one another. For example, you can display general employee information and employee salary history.
Display one report within another. For example, you can display detailed mutual fund performance within general fund information.
Also, you can combine any of the report configurations that are in the preceding list.
A subreport is simply a report that appears inside another report. You already know how to create a report. Basically, it takes one additional step to create a report that contains subreports. You must set up the structure of the main report to organize the subreports.
Each subreport can access a different data source, its own set of tables and fields, and specify its own data selection criteria. Subreports can be linked to one another or be independent of each other. Two reports are linked when the data of one report determines what data appears in another.
Always create, lay out, and test each subreport before you create the next one, and verify that the subreport displays the correct data. If you create all the subreports before you test the entire report, it can be difficult to determine which subreport causes errors.
This section describes some general principles and provides a few examples for organizing subreports in a report. The three report elements that you use to organize subreports are the table, list, and grid. Reports with complex layouts typically use all three container elements.
The table iterates through the rows in a data set and displays the data in row and column format. For some reports, a subreport consists of data that is organized in a table.
Like the table, the list iterates through the rows in a data set. The list, however, provides much greater flexibility for arranging data. A report that contains multiple linked subreports typically uses a list as the top-level container. Within the list, subreport data can be organized in tables.
The grid is a static table that organizes elements in rows and columns. In a report with subreports, you can use a grid to align multiple tables horizontally or to add space between tables. For example, to display two subreports next to one another, you can create two tables to display the data for the subreports then insert both tables in a grid to align the subreports.
Figure 17-1 shows an example of a report with four unlinked subreports. Each Top 10 subreport displays a different set of data. Each subreport is a table with data elements. The tables are arranged in a grid so they can appear side by side.

Figure 17-2 shows the design for the report that appears in Figure 17-1.

The preceding section described creating subreports that are not linked to each other. The subreports run independently and do not coordinate their data. Sometimes, however, you need to create reports that coordinate data, such as a detailed customer issues report in a customer report, as shown in Figure 17-3.

As the example shows, one report is nested in another, creating a master report and detail report relationship. Each report accesses data from a different table or data source, and the reports are linked by a common field value, such as customer ID or mutual fund name. The value of the linking field in the master report determines the data that appears in the detail report. For example, if the customer ID in the master report is 112, the detail report displays the issues for the customer whose ID is 112.
The master-detail report examples in the previous section use the list element as the primary organizational structure. The list iterates through the data rows that the data set returns, and it supports the structure of nested reports.
Within the list, a grid aligns the data in both reports. The data for the master report is placed in the grid in the detail area of the list. The grid aligns the data in a column, and the list iterates through the master report’s data rows. The detail report uses a table to iterate through its data rows.
This structure assumes that the master and detail reports use different data sets and that each data set accesses data from a different table or data source. Figure 17-4 shows the report design for the customer-issue master-detail report that appears in the previous section.

An alternate design is to use two tables, one nested in the other. Place data for the master report in the detail rows of the outer table. Place data for the detail report in a table, and place the table in the detail row of the outer table. Figure 17-5 shows this alternate report design.
Master and detail reports must be linked by a common field. In the customer-issue example report, the linking field is the customer ID. To link the reports, perform the following tasks:
For the detail report’s data set, create a SELECT statement with a parameter marker in a WHERE clause. For example:
SELECT *
FROM issues
WHERE issues.customerNumber = ?
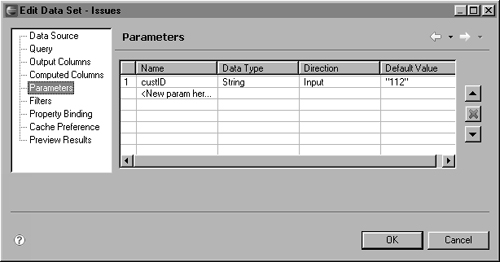
Create a data set parameter. Figure 17-6 shows the definition of a parameter in the data set that the detail report uses. You must supply a specific value as the parameter’s default value so that the query works properly during the report design process.
In the layout editor, bind the detail report’s data set parameter to the linking field in the master report. Figure 17-7 shows an example of this binding, which you perform using the property editor for the detail table.
When the report runs, BIRT performs the following tasks:
When the master report processes a customer row, it passes the customer number value to the data set parameter that you defined for the detail report.
The data set parameter passes this customer number value to the detail report’s query and dynamically updates the WHERE clause.
The detail report displays the issues data for that customer number.
The previous steps repeat until the master report processes all its customer rows.

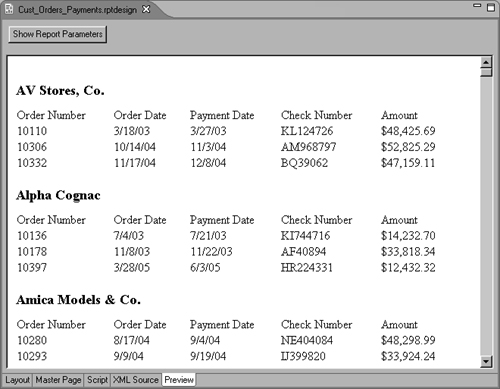
This section provides step-by-step instructions for building a report that displays a list of customers. For each customer, the report displays order and payment information. The order information and payment information are in separate subreports that appear next to one another. The customer report is the master report, which is also called the outer report. The order and payment subreports are the detail reports, which are also called the inner reports.
Each report accesses data from a different table in the sample database, Classic Models. The customer report uses data from the Customers table. The orders subreport uses data from the Orders table. The payments subreport uses data from the Payments table.
A common field, CUSTOMERNUMBER, links the reports. The value of the linking field in the master report determines what data appears in the detail reports. For example, if the customer number in the master report is 173, the detail reports display the order and payment information for the customer whose ID is 173.
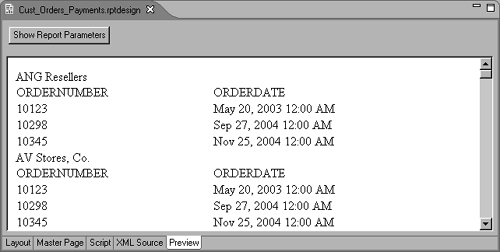
Figure 17-8 shows a portion of the finished report.

In this tutorial, you perform the following tasks:
If you are using BIRT Report Designer, this task assumes you have already created a project for your reports. If you are using BIRT RCP Report Designer, there is no requirement for a project.
Before you begin designing your report in the layout editor, you create a data source to connect your report to the Classic Models database.
Choose Data Explorer.
Right-click Data Sources, and choose New Data Source from the context menu.
Select Classic Models Inc. Sample Database from the list of data sources, use the default data source name, then choose Next. Connection information about the new data source appears.
Choose Finish. BIRT Report Designer creates a new data source that connects to the sample database. It appears within Data Sources in Data Explorer.
In this procedure, you build a data set to indicate what data to extract from the Customers table. The customer report that you create later uses this data set.
In Data Explorer, right-click Data Sets, and choose New Data Set.
On New Data Set, type the following text for data set name:
Customers
Use the default values for the other fields:
Data Source shows the name of the data source that you created earlier.
Data Set Type specifies that the data set uses a SQL SELECT query.
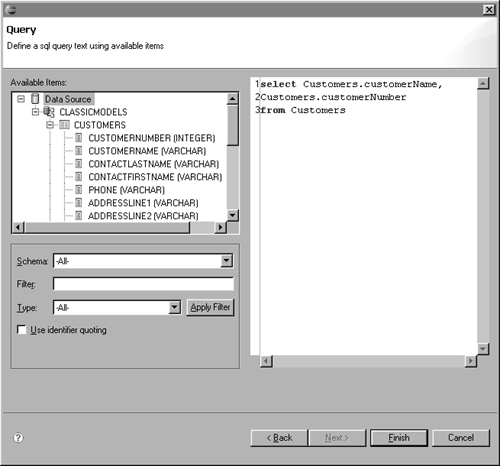
Choose Next. Query displays the information to help you create a SQL query. The text area on the right side shows the required keywords of a SQL SELECT statement.
Expand the CUSTOMERS table. The columns in the Customers table appear.
Use the following SQL SELECT statement to indicate what data to retrieve. You can type the column and table names, or you can drag them from the left side to the appropriate location in the SELECT statement.
SELECT Customers.customerName,
Customers.customerNumber
FROM Customers
This statement that you created, which is shown in Figure 17-9, gets values from the CUSTOMERNAME and CUSTOMERNUMBER columns in the CUSTOMERS table.
Choose Finish to save the data set. Edit Data Set displays the columns specified in the query, and provides options for editing the data set.
Choose Preview Results to confirm that the query is valid and that it returns the correct data. If you created the SELECT statement correctly, you should see the results that appear in Figure 17-10. These are the data rows that the query returns.

In this procedure, you build a data set to indicate what data to extract from the Orders table. The orders subreport that you create later uses this data set.
In Data Explorer, right-click Data Sets, and choose New Data Set from the context menu.
On New Data Set, type the following text for the data set’s name:
Orders
Use the default values for the other fields, then choose Next.
On Query, expand the Orders table to display the columns in the table.
Use the following SQL SELECT statement to indicate what data to retrieve:
SELECT Orders.orderNumber,
Orders.orderDate
FROM Orders
WHERE Orders.customerNumber = ?
This statement selects the ORDERNUMBER and ORDERDATE columns from the Orders table. The WHERE clause has a parameter marker for the value of CUSTOMERNUMBER. When the report runs, the orders subreport gets the current CUSTOMERNUMBER value from the customers report.
Choose Finish to save the data set. Edit Data Set displays the columns specified in the query, and provides options for editing the data set.
Create a data set parameter to supply the CUSTOMERNUMBER value in the WHERE clause:
Choose Parameters from the left side of the window. Edit Data Set displays parameters information.
Specify the following values in the first line of the table:
Name: CustID
Data Type: Integer
Direction: Input
Default value: 103
103 is one of the values in the CUSTOMERNUMBER column. A default value is required for BIRT Report Designer to run the query for testing purposes.
Edit Data Set should look like the one shown in Figure 17-11.
Choose Preview Results to confirm that the query is valid and that it returns the correct data. If you created the SELECT statement and created the data set parameter correctly, you should see the results that appear in Figure 17-12. These are the data rows that the query returns for customer number 103.
Choose OK to save the changes to the data set.


In this procedure, you build a data set to indicate what data to extract from the Payments table. The payments subreport that you create later uses this data set.
In Data Explorer, right-click Data Sets, and choose New Data Set from the context menu.
On New Data Set, type the following text for the data set’s name:
Payments
Use the default values for the other fields, then choose Next.
On Query, expand the Payments table to display the columns that are in the table.
Use the following SQL SELECT statement to indicate what data to retrieve:
SELECT Payments.paymentDate,
Payments.checkNumber,
Payments.amount
FROM Payments
WHERE Payments.customerNumber = ?
This statement selects the PAYMENTDATE, CHECKNUMBER, and AMOUNT columns from the Payments table. The WHERE clause has a parameter marker for the value of CUSTOMERNUMBER. When the report runs, the payments subreport gets the current CUSTOMERNUMBER value from the customers report.
Choose Finish to save the data set. Edit Data Set displays the columns specified in the query, and provides options for editing the data set.
Create a data set parameter to supply the CUSTOMERNUMBER value for the WHERE clause:
Choose Preview Results to confirm that the query is valid and that it returns the correct data. If you created the SELECT statement and created the data set parameter correctly, you should see the results that appear in Figure 17-13. These are the data rows that the query returns for customer number 103.

You use a list element to create the master report and organize the orders and payments subreports within it. The list iterates through the customer data rows and creates the related orders and payments subreports for each record. For the sake of simplicity, the customer report displays just the customer name. It can, of course, display additional data, such as customer address, phone number, and credit limit.
Choose Palette.
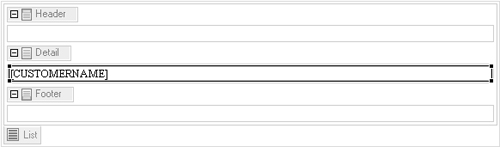
Drag a list element from the palette, and drop it in the report. The list element appears in the report, as shown in Figure 17-14.
Associate, or bind, the list with the Customers data set:
Choose Data Explorer, expand Data Sets, then expand Customers. The columns that you specified in the query appear below Customers.
Drag CUSTOMERNAME from Data Explorer, and drop it in the detail area of the list. BIRT Report Designer creates a named column, which is bound to the data set field. Select Data Binding displays this column binding.
Choose OK to accept the default column binding. In the layout editor, the list displays the field that you added, as shown in Figure 17-15.
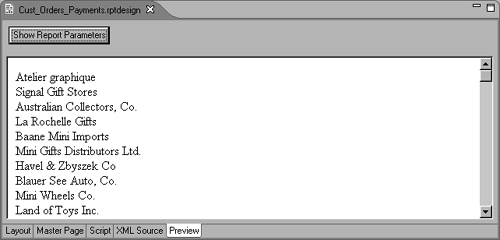
Choose Preview to preview the report. The report should look like the one shown in Figure 17-16. The report lists all the customer names in the order in which the query returns them.
Sort the customer names in ascending order:
Choose Layout to return to the layout editor.
In the layout editor, select the list element. Hover the mouse pointer over the bottom-left corner until you see the List tab, then choose the tab.
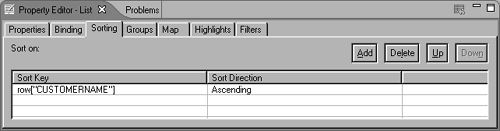
In Property Editor, choose the Sorting tab.
On the Sort page, choose Add to create a sort expression. A row appears under Sort on.
Click the area under Sort Key, then select the arrow button that appears, and select CUSTOMERNAME from the drop-down list.
Use the default value, Ascending, for Sort Direction, as shown in Figure 17-17.
Preview the report. Customer names appear in ascending order.

The orders subreport lists the orders for each customer in a row and column format. It displays the order number and date of each order. To iterate through the orders data set rows and display them in a row and column format, you use the table element.
Choose Layout to return to the layout editor.
Drag a table element from the palette, and drop it below the [CUSTOMERNAME] data element, in the detail area. Insert Table prompts you to specify the number of columns and detail rows to create for the table.
Indicate that you want to create 2 columns and 1 detail row, then choose OK. A table with two columns and one detail row appears in the layout editor.
Bind the table with the Orders data set.
Choose Data Explorer, expand Data Sets, then expand Orders. The columns that you specified in the query appear below Orders.
Drag ORDERNUMBER from Data Explorer, and drop it in the first cell of the table’s detail row. BIRT Report Designer creates a named column, which is bound to the data set field. Select Data Binding displays this column binding.
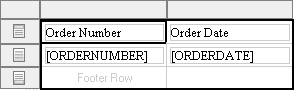
Choose OK to accept the default column binding. In the layout editor, the table cell in which you dropped the data set field contains a data element that displays [ORDERNUMBER]. Above this data element is a label element that the layout editor automatically adds to the header row. This label displays the field name as static text and serves as the column heading.
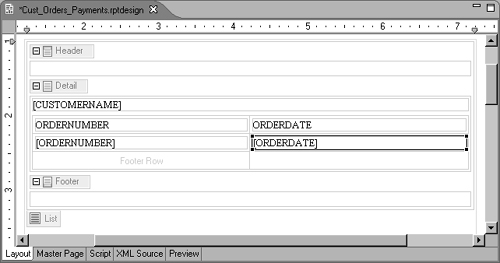
Drag ORDERDATE from Data Explorer, and drop it in the second cell in the detail row. Choose OK to accept the default column binding. The report page should look like the one shown in Figure 17-18.
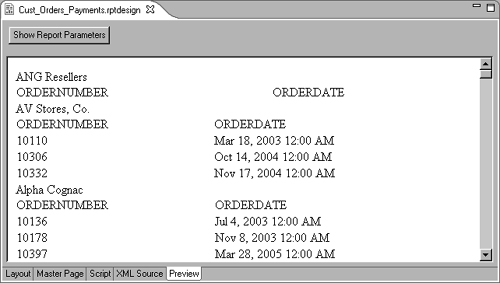
Preview the report. The report should look like the one shown in Figure 17-19.
The same order records appear for every customer, because you specified a default value of 103 for customerNumber when you created the data set parameter, CustID. Because of this default value, the orders subreport always displays the order records for customer 103. The solution is to dynamically update the value of the CustID parameter each time the customer row in the master report changes. This procedure is described in the following task.
You link the orders subreport to the customers master report by binding the CustID parameter to the CUSTOMERNUMBER data set field in the customers report. Each time the customers report reaches a new customer row, the CustID parameter is updated with the new CUSTOMERNUMBER value.
Before you can bind the CustID parameter to the CUSTOMERNUMBER data set field, you must create a column binding and bind it with the data set field. Parameters cannot access data set fields directly.
Choose Layout to return to the layout editor.
Create a column binding that binds to the CUSTOMERNUMBER data set field:
Select the list, and on Property Editor, choose Binding.
On the Binding page, choose Add.
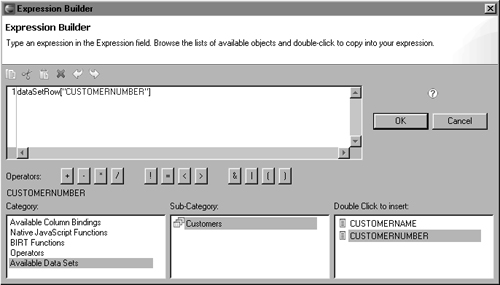
On Expression Builder, choose Available Data Sets, choose Customers, then double-click CUSTOMERNUMBER. Expression Builder displays the expression, dataSetRow["CUSTOMERNUMBER"], as shown in Figure 17-20.
Choose OK. The new column binding appears on the binding page of Property Editor with the column name highlighted.
Replace the name New Binding with the following name:
CUSTOMER_NUMBER
Select the orders table.
In Property Editor, choose Binding.
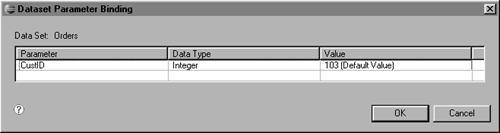
On the Binding page, choose Dataset Parameter Binding. Dataset Parameter Binding displays the CustID parameter, as shown in Figure 17-21. Its value is set to the default, 103, which you specified when you created the data set parameter.
Change the parameter value to the CUSTOMERNUMBER field in the customers report.
Click the Value field, then choose the button that appears on the right.
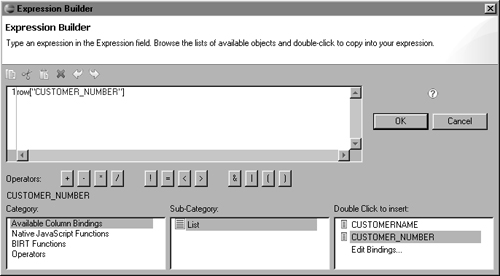
On Expression Builder, choose Available Column Bindings, choose List, then double-click CUSTOMER_NUMBER. Expression Builder displays the expression, row["CUSTOMER_NUMBER"], as shown in Figure 17-22.
Choose OK to save the expression. The Dataset Parameter Binding page displays the new value of row["CUSTOMER_NUMBER"] for the CustID parameter.
Choose OK to save the changed data set parameter binding.
Preview the report, which should look like the one shown in Figure 17-23.
Now different order records appear for different customers. Not all customers have order records. To display only customers that have orders, you change the query for the customers report. This task is described later in Task 11: “Display only customers that have orders or payments.”
The payments subreport shows, in a row and column format, the payments that each customer made. It displays the payment date, check number, and amount of each order. To iterate through the payments data set rows and display them in a row and column format, you use a table element.
Choose Layout to return to the layout editor.
Drag a table element from the palette, and drop it below the orders subreport, in the detail area. Insert Table prompts you to specify the number of columns and detail rows to create for the table.
Indicate that you want to create 3 columns and 1 detail row, then choose OK. A table with three columns and one detail row appears in the layout editor.
Bind the table with the Payments data set.
Choose Data Explorer, expand Data Sets, then expand Payments. The columns that you specified in the query appear below Payments.
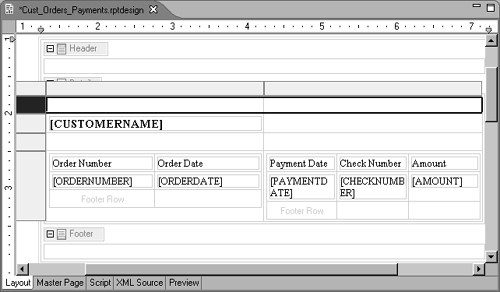
Drag the PAYMENTDATE, CHECKNUMBER, and AMOUNT fields from Data Explorer, and drop them in the first, second, and third cells, respectively, in the detail row of the table. Choose OK to accept the default column bindings for all the fields. The report page should look like the one shown in Figure 17-24.
The table shows the data set fields that you added. It also shows the labels that the layout editor automatically added to the header row. The labels display the field names as static text and serve as the column headings.
Sort the payment rows by payment date.
Select the payments table.
In Property Editor, choose Sorting.
On the Sorting page, choose Add to create a sort expression. A row appears under Sort on.
Click under Sort Key, choose the arrow button that appears, and select PAYMENTDATE from the drop-down list.
Use the default value, Ascending, for Sort Direction.
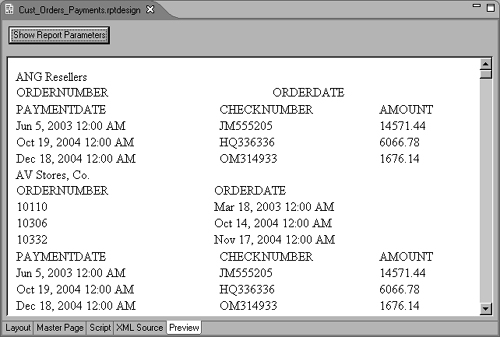
Preview the report. The report should look like the one shown in Figure 17-25.
As with the orders subreport when you first created it, the same payment records repeat for every customer, because you specified a default value of 103 for customerNumber when you created the parameter, CustID, for the Payments data set. Because of this default value, the payments subreport always displays the payment records for customer 103. Just as you did for the orders subreport, you need to dynamically update the value of the CustID parameter for each customer in the master report.

You link the payments subreport to the customers master report by binding its CustID parameter to the CUSTOMERNUMBER field in the customers report.
Choose Layout to return to the layout editor.
Select the payments table.
In Property Editor, choose the Binding tab.
On the Binding page, choose Dataset Parameter Binding. Dataset Parameter Binding displays the CustID parameter. Its value is set to the default, 103, which you specified when you created the data set parameter.
Change the parameter value to the CUSTOMERNUMBER field in the customers report:
Click the Value field, then choose the button that appears on the right.
On Expression Builder, choose Available Column Bindings, choose List, then double-click CUSTOMER_NUMBER. Expression Builder displays the expression row["CUSTOMER_NUMBER"].
Choose OK to save the expression. The Dataset Parameter Binding page displays the new value of row["CUSTOMER_NUMBER"] for the CustID parameter.
Choose OK to save the changed data set parameter binding.
Preview the report. Now the report displays different payment records for different customers. Not all customers have payment records. To display only customers that have payments or orders, you change the query for the customers report.
The database contains customers that do not have orders or payments. The query for the customers report returns all customers. When you run the report, there are customer rows that show only the column headings for the orders and payments tables, as shown in Figure 17-26.

You can exclude customers that do not have orders or payments by changing the query for the customers report.
Choose Layout to return to the layout editor.
In Data Explorer, expand Data Sets, right-click Customers, then choose Edit.
Add the following SQL lines to the end of the existing query:
WHERE
EXISTS
(SELECT Orders.customerNumber
FROM Orders
WHERE Customers.customerNumber =
Orders.customerNumber)
OR
EXISTS
(SELECT Payments.customerNumber
FROM Payments
WHERE Customers.customerNumber =
Payments.customerNumber)
The WHERE EXISTS clause checks the Orders and Payments tables for customerNumber values that match the customerNumber values in the Customers table. Only rows that have matching customerNumber values are selected. The complete query should look like the one shown in Figure 17-27.
Choose Preview Results to verify that the query returns rows, then choose OK.
Preview the report. Scroll down the report to check the output. The report no longer displays customers that do not have orders or payments.

Now that the subreports display the correct data, you can focus on laying out the subreports next to one another. You cannot place two tables next to one another, because BIRT Report Designer creates block-level elements, which means that each element starts on a new line. To display side-by-side tables, you insert the tables in a grid. The grid enables you to align elements easily.
Choose Layout to return to the layout editor.
Drag a grid element from the palette, and drop it into the Detail row above the orders table. Insert Grid prompts you to specify the number of columns and rows for the grid.
In Number of columns, type 2 and in Number of rows, type 1, then choose OK. A grid with two columns and one row appears in the layout editor.
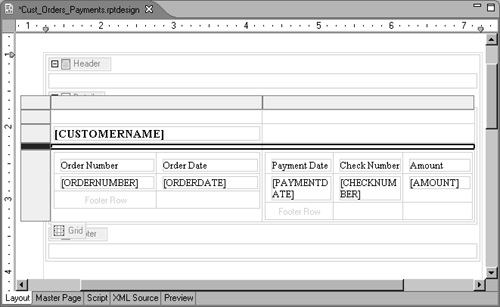
Move the orders table to the first grid cell. To do this, select the Table tab in the bottom-left corner, then drag the table and drop it in the grid cell.
Move the payments table to the second grid cell. The report layout should look like the one shown in Figure 17-28.
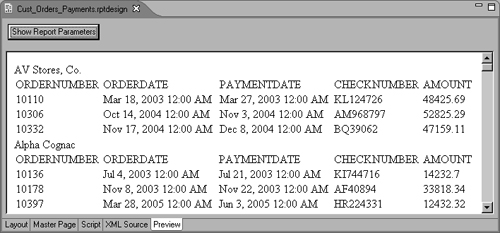
Preview the report. The report should look like the one shown in Figure 17-29.

Now that the report displays the correct data and layout, you can turn your attention to improving the report’s appearance. You perform the following tasks in this section:
Choose Layout to return to the layout editor.
In the layout editor, select the [CUSTOMERNAME] data element.
Choose the Properties tab of Property Editor.
Select General from the list under Properties. Property Editor displays the general formatting properties of the data element.
For Size, choose Large to display the element’s text in a larger size.
 Choose B to format the data as bold text.
When you insert a data set field in a table, BIRT Report Designer automatically adds a label with the data set field name in the header row. Often, data set field names are not in a form that is appropriate for reports, and need to be changed.
Double-click the first column heading in the orders table. The text is highlighted.
Replace ORDERNUMBER with the following text, then press Enter:
Order Number
Repeat the previous steps to change the rest of the column headings to the following text:
Order Date
Payment Date
Check Number
Amount
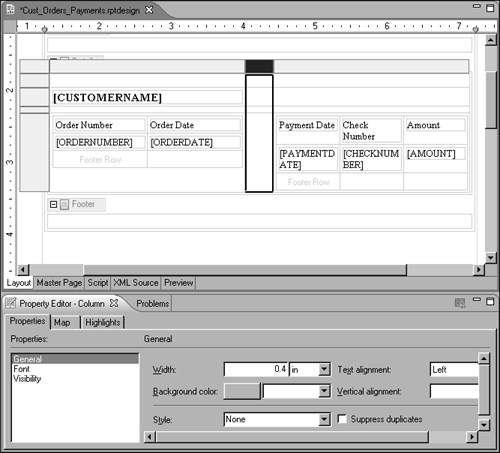
The report layout should look like the one shown in Figure 17-30.
Preview the report. The report should look like the one shown in Figure 17-31.

When you insert a data element of date data type, BIRT Report Designer displays dates according to your system’s locale setting. BIRT Report Designer provides many different date formats that you can select if you do not want to use the default format. In this procedure, you create a style that changes the format of ORDERDATE and PAYMENTDATE values from Jun 3, 2005 12:00 AM to 6/3/05.
Select the data element that displays [ORDERDATE].
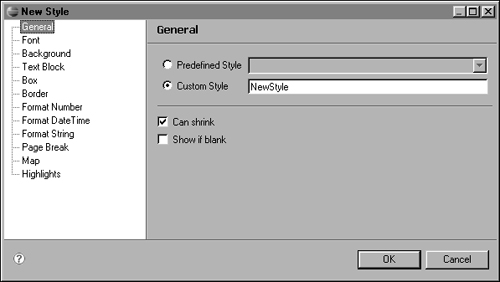
Choose Element→New Style from the main menu. New Style displays the properties you can set for a style, as shown in Figure 17-32.
For Custom Style, type:
Date_data
Choose Format DateTime from the list of style properties on the left.
Choose the m/d/yy format from the drop-down list, as shown in Figure 17-33. The values in the drop-down list dynamically update with the current date.
The Date_data style is applied to the [ORDERDATE] data element, as shown in Figure 17-34.
Apply the Date_data style to the payment date data element.
Preview the report. The dates have changed from Jun 3, 2005 12:00 AM format to 6/3/05.


When you insert a data element of integer data type, BIRT Report Designer displays numbers according to your system’s locale setting. BIRT Report Designer provides many different number formats that you can select if you do not want to use the default format. In this procedure, you create a style that changes the amount values format from 48425.69 to $48,425.69.
Choose Layout to return to the layout editor.
Select the data element that displays [AMOUNT] in the payments table.
Choose Element→New Style from the main menu. New Style displays properties in the general category.
For Custom Style, type:
Currency_data
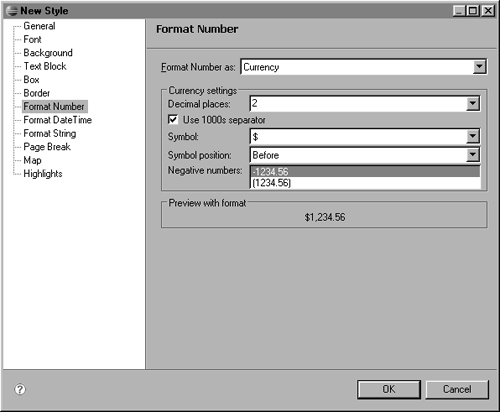
Choose Format Number from the list of style properties on the left.
Specify the following formatting attributes, as shown in Figure 17-35:
Choose OK. The Currency_data style is applied to the [AMOUNT] data element, as indicated by the element’s Style property in Property Editor.
Preview the report. The numbers appear in the currency format, as shown in Figure 17-36.

In this procedure, you increase the space between each customer name and the lines before and after it. You can adjust the vertical space between elements in several ways:
You can increase the top or bottom padding or margins of elements.
You can organize the elements in a grid and adjust the heights of the grid rows.
You can organize the elements in a grid and use empty rows with specified heights to provide space between elements.
Formatting with a grid is easier and provides more predictable results. Padding and margins property values can yield different results in different web browsers. In this procedure, you use the third method.
Choose Layout to return to the layout editor.
Place the [CUSTOMERNAME] data element in the grid that contains the two tables by completing the following steps:
Select the grid. Hover the mouse pointer over the bottom-left corner until you see the Grid tab, then choose the tab. Guide cells appear at the top and left of the selected grid.
The layout editor shows the borders of individual data elements, grids, tables, and cells, and it can sometimes be difficult to see where an element is placed. If you need a clearer view of the containers and the elements within the containers, use the Outline view to get a tree view of the report design. You can also use the Outline view to select a particular element if it is too difficult to select. For example, selecting the grid rather than the table within the grid can be difficult. To open the Outline view, choose Window→Show View→Outline.
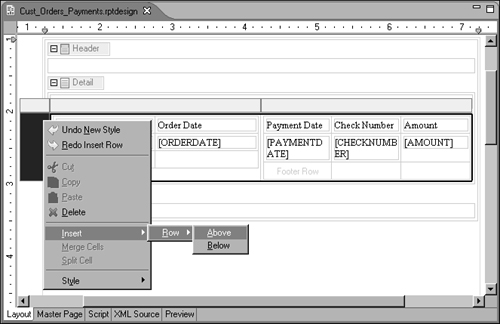
Right-click the guide cell on the left of the grid’s first row, then choose Insert→Row→Above, as shown in Figure 17-37.
A new row appears above the selected row.
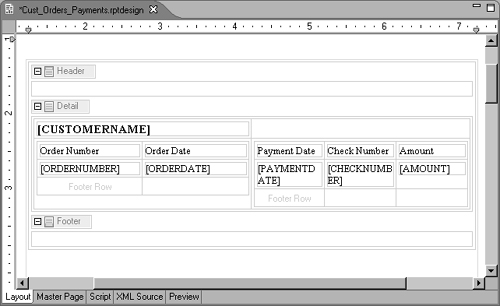
Move the [CUSTOMERNAME] data element from its current location to the first cell of the new grid row. Figure 17-38 shows the [CUSTOMERNAME] data element in the new location.
Add a new grid row above and below the row that contains the [CUSTOMERNAME] data element, using the procedures that were described earlier.
Select the grid, then select the first row in the grid, as shown in Figure 17-39.
To decrease the size of the row, in the General properties of Property Editor, set the row’s height to 0.2 in, as shown in Figure 17-40.
Select the third row in the grid, and set its height to 0.1 in. The report design should look like the one shown in Figure 17-41.
The custom row heights provide the exact amount of space you need between elements. If you prefer to work with a unit of measurement other than inches, you can select mm, points, or even pixels for very precise sizing control.
Preview the report. There is more space above and below the customer name. The report should look like the one shown in Figure 17-42.

In this procedure, you increase the space between the orders and payments tables. As with vertical spacing, you can adjust the horizontal space between elements in several ways:
You can increase the left or right padding or margins of elements.
You can organize the elements in a grid and adjust the widths of the grid columns.
You can organize the elements in a grid and use empty columns with specified widths to provide space between elements.
Again, formatting with a grid is easier and provides more predictable results. Padding and margins property values can yield different results in different web browsers. In this procedure, you use the third method.
Choose Layout to return to the layout editor.
Select the grid. Hover the mouse pointer over the bottom-left corner until you see the Grid tab, then choose the tab. Guide cells appear at the top and left of the selected grid.
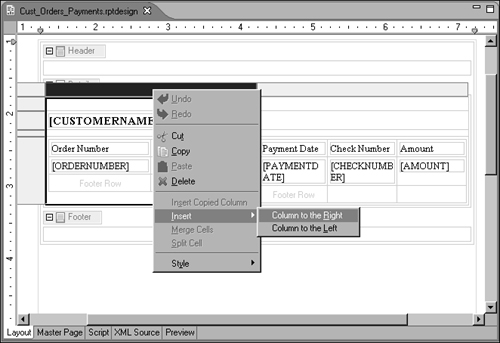
Right-click the guide cell above the first column, then choose Insert→Column to the Right, as shown in Figure 17-43.
A new column appears between the first and third columns. By default, BIRT Report Designer creates columns with the same widths.
Select the column that you just added, and use Property Editor to set its width to 0.4 in, as shown in Figure 17-44.
The width of the second column decreases.
Preview the report. There is more space between the orders and payments tables, as shown in Figure 17-45.

In this procedure, you add a box around the orders and payments tables to clearly identify them as two separate subreports.
Choose Layout to return to the layout editor.
Select the orders table. Hover the mouse pointer over the bottom-left corner until you see the Table tab, then choose the tab. Guide cells appear at the top and left of the selected table.
Choose Border in Property Editor, then set the border properties:
Set Style to a solid line, the default option.
Set Width to the thinnest line.
Set Color to black, the default color.
Choose all the buttons to add borders around the table, as shown in Figure 17-46.
Repeat the previous steps to draw a border around the payments table.
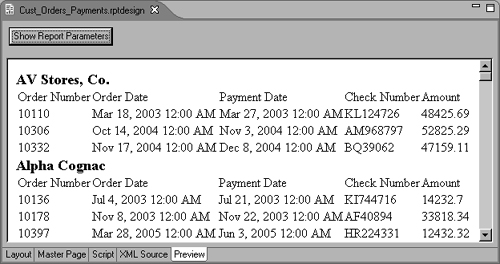
Preview the report. The report should look like the one shown in Figure 17-47.


The top and left borders of the tables are too close to the table content. In this procedure, you increase the space between the top and left borders and the content.
Choose Layout to return to the layout editor.
Select the first cell in the group header row of the orders table. Be careful to select the cell, as shown in Figure 17-48, and not the data element in the cell.
The title that appears in Property Editor shows the name of the element that you selected. Verify that it displays the following text:
Property Editor - Cell
Choose the Padding properties in Property Editor, then set Top and Left to 6 points. Figure 17-49 shows these property settings.
In the layout editor, extra space appears at the top and left of the cell, as shown in Figure 17-50.
Select the cell next to the cell that you just formatted, and set its Top and Left padding properties to 6 points.
Select the two cells in the detail row, and set the Left padding property to 6 points.
Select the cells that are in the same positions in the payments table, and apply the same settings that you used for the cells in the orders table.
Preview the report. The report should look like the one shown in Figure 17-51.