
![]()
Creating Tabular Data
This chapter and the next return to the DATA DIVISION to explore more data-declaration concepts. In this chapter, I discuss how to create and manipulate tabular data. I compare and contrast COBOL tables with the arrays used in many other programming languages. Chapter 12 covers more advanced data declaration using the USAGE, REDEFINES, and RENAMES clauses.
The chapter starts with a discussion of the similarities and differences between arrays and tables. You then see how COBOL tables are declared using the OCCURS clause and manipulated using subscripts. I introduce a scenario to explain why tabular data is required and end the scenario with an example program that uses a simple one-dimensional table as part of the solution.
The middle section of the chapter introduces the concept of group items as table elements and demonstrates this in an example program. Multidimensional tables are then introduced. You learn the best way to depict a multidimensional COBOL table graphically; and I again address the contrast between arrays and tables, which is more pronounced with multidimensional tables. I present an example program using a two-dimensional table as part of its solution and introduce a scenario requiring a three-dimensional table.
In the chapter’s final section, I show how to create prefilled tables using the REDEFINES clause. You see this demonstrated in an example program that uses a table prefilled with the names of the American states. I also discuss some of the table declaration changes introduced with the ANS 85 standard.
Tables vs. Arrays
Most programming languages have a facility to create tabular information. Tabular information consists of multiple occurrences of a homogeneous data item.
Most programming languages use the term array to describe these multiple-occurrence data items, but COBOL uses the term table. This is not just a difference of nomenclature. In most languages (including Basic, Pascal, Java, FORTRAN, and Ada), arrays look and work similarly; but COBOL tables, although they have some similarities to arrays, have a number of minor and major differences.
Table/Array Definition
Tables and arrays are so similar that you can use the same definition for them. A table/array may be defined as a contiguous sequence of memory locations that all have the same name and that are uniquely identified by that name and by their position in the sequence. The position index is called a subscript, and the individual components of the table/array are referred to as elements.
Table/Array Differences
If the same definition can be used for tables and arrays, what is the difference between them? The first difference affects the C language derivatives (C++, Java, and C#). In these languages, arrays start at element 0 and go to the maximum size of the array minus one. This arrangement is a rich source of programming errors for beginner programmers who have difficulty coming to grips with this displaced referencing: for instance, element[9] is the tenth element in the array. In COBOL, tables start at element 1 (not 0) and go to the maximum size of the table. In a COBOL table, element(9) is the ninth element of the table.
A major difference between COBOL tables and arrays is that COBOL tables are declared using record descriptions. The nature of a record description is that there is a hierarchical relationship between the items in the record. Consequently, one item in a multidimensional table must always be subordinate to another. Arrays have no such hierarchical relationship. An array is simply a matrix of cells that are referenced using row and column subscripts. The hierarchical structuring of COBOL tables allows data-manipulation opportunities that are not available to languages that use arrays.
Declaring Tables
Tables are declared using an extension to the PICTURE clause, called the OCCURS clause. The metalanguage for the basic OCCURS clause is as follows:
OCCURS TableSize#1 TIMES
To declare a table, you define the type and size of the table element, and then you use the OCCURS clause to specify how many times the element occurs. In the following NFL-Stadium example, the type and size of the element are defined by its subordinate data items. Each element is alphanumeric and 35 characters (30 + 5) in size:
01 SoccerStadiumName    PIC X(25) OCCURS 20 TIMES.

01 NFL-Stadium  OCCURS 31 TIMES.
   02 NFL-StadiumName       PIC X(30).
   02 NFL-StadiumCapacity   PIC 9(5).
OCCURS Clause Rules
Here are the rules for the OCCURS clause:
- Any data item whose description includes an OCCURS clause must be subscripted when referred to. For example:
DISPLAY SoccerStadiumName(15)
MOVE NFL-Stadium(12) TO NFL-Stadium(7)
- Any data item that is subordinate to a group item whose description contains an OCCURS clause must be subscripted when referred to. For example:
DISPLAY NFL-StadiumName(7)
DISPLAY NFL-StadiumCapacity(7)
Subscript Rules
Now let’s look at the subscript rules:
- A subscript is a bracketed numeric index (or something that evaluates to one) that points to a particular element (or part of an element) of the table. The subscript immediately follows the element name.
- The numeric index must be a positive integer, a data name that represents one, or a simple expression that evaluates to one.
- The numeric index is a value between one and the number of elements in the table, inclusive.
- When more than one subscript is used, they must be separated from one another by commas.
- One subscript must be specified for each dimension of the table. There must be one subscript for a one-dimensional table, two subscripts for a two-dimensional table, and three for a three-dimensional table.
- The first subscript applies to the first OCCURS clause, the second applies to the second OCCURS clause, and so on.
- Subscripts must be enclosed in rounded brackets: ().
Here are some examples:
MOVE ZEROS TO StateSalesTotal(35)
ADD BranchSales TO StateSalesTotal(StateNum)
ADD BranchSales TO StateSalesTotal(StateNum + 1)
ADD BranchSales TO StateSalesTotal(StateNum - 2)
ADD MonthlyBranchSales TO StateSalesTotal(StateNum, MonthNum)
DISPLAY "Stadium Name is " StadiumName(24)
DISPLAY "Stadium Capacity is " StadiumCapacity(24)
Why Use Tabular Data?
Let’s start this introduction to tabular data by setting up a hypothetical problem. In the course of exploring the problem and a number of variations, I will show how tables are defined and used in COBOL.
First Specification
YoreCandyShoppe is a franchise that sells old-time candy at branches all over the United States. A program is required that will sum the candy sales for all the YoreCandyShoppe branches in the country. The sales data is obtained from a sales file containing the candy sales for each branch. The sales file is a sequential file sequenced on ascending BranchId. Each record of the file may be described using the following record description:
01 BranchSalesRec.
   88 EndOfSalesFile  VALUE HIGH-VALUES.
   02 BranchId    PIC 9(7).
   02 StateNum    PIC 99.
   02 CandySales  PIC 9(7)V99.
To save file space, a two-digit numeric value is used to represent the state instead of a state name.
The program to perform this task is very simple. All you have to do is set up a variable to hold the total candy sales and then add CandySales from each record to TotalCandySales. A fragment of the program required to do this is given in Example 11-1.
Example 11-1. PROCEDURE DIVISION of a Program to Sum Total Candy Sales
PROCEDURE DIVISION.
Begin.
   OPEN INPUT SalesFile
   READ SalesFile
      AT END SET EndOfSalesFile TO TRUE
   END-READ
   PERFORM UNTIL EndOfSalesFile
      ADD CandySales TO TotalCandySales
      READ SalesFile
         AT END SET EndOfSalesFile TO TRUE
      END-READ
   END-PERFORM.
   DISPLAY "Total candy sales for the US : ", TotalCandySales
   CLOSE SalesFile
   STOP RUN.
Second Specification
The program to solve the problem set in the first specification is simple. But suppose the specification is changed so that instead of being asked for the country’s total candy sales, you are asked to calculate the total sales for each state.
One approach to this new problem would be to sort the file on StateNum. This would turn the requirement into a simple control-break problem (that is, process all the records for one state, output the result, and then go on to the next). But the issue with this solution is that sorting is a comparatively slow, disk-intensive procedure. You want to avoid having to adopt this solution if possible. Is there any other way to solve the problem?
You could create 50 variables (one for each state) to hold the sales totals. Then, in the program, you could use an EVALUATE statement to add CandySales to the appropriate total. For example:
EVALUATE StateNum
   WHEN      1      ADD CandySales TO State1SalesTotal
   WHEN      2      ADD CandySales TO State2SalesTotal
   WHEN      3      ADD CandySales TO State3SalesTotal
         ..... 47 more WHEN branches
END-EVALUATE
This solution is not very satisfactory. You need a specific WHEN branch to process each state, and you have to declare 50 data items to hold the sales totals. And when you want to display the results, you must use 50 DISPLAY statements:
DISPLAY "State 1 total is ", State1SalesTotal
DISPLAY "State 2 total is ", State2SalesTotal
DISPLAY "State 3 total is ", State3SalesTotal
        ..... 47 more DISPLAY statements
But this poor attempt at a solution does contain the germ of an idea of how to solve the problem. It is interesting to note that the processing of each WHEN branch is the same: CandySales is added to the sales total for a particular state. You could replace all 50 WHEN branches with one statement if you could generalize to something like this:
ADD the CandySales to the StateSalesTotal location indicated by the StateNum.
There is also something interesting about the 50 data items. They all have exactly the same PICTURE, and they all have, more or less, the same name: StateSalesTotal. The only way you can distinguish between one StateSalesTotal and another is by attaching a number to the name: State1SalesTotal, State2SalesTotal, State3SalesTotal, and so on.
When you see a group of data items that all have the same name and the same description and are only distinguished from one another by a number attached to the name, you know that you have a problem crying out for a table-based solution.
Using a Table for the State Sales Totals
In COBOL, you declare a table by specifying the type (or structure) of a single item (element) of the table and then specifying that the data item is to be repeated a given number of times. For instance, StateSalesTable may be defined as follows:
01 StateSalesTable.
   02 StateSalesTotal      PIC 9(8)V99  OCCURS 50 TIMES.
StateSalesTable can be represented diagrammatically as shown in Figure 11-1. All the elements of the table have the name StateSalesTotal; you can refer to a specific one by using that name followed by an integer value in brackets. So, StateSalesTotal(3) refers to the third element of the table, and StateSalesTotal(13) refers to the thirteenth element.
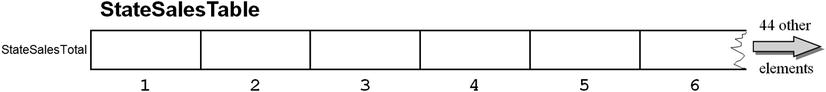
Figure 11-1. Diagrammatic representation of StateSalesTable
But when you refer to an element, you don’t have to use a numeric literal. You can use anything that evaluates to a numeric value between 1 and the size of the table—even a simple arithmetic expression.
So the solution to the problem of summing the candy sales for each state is to use a table to hold a StateSalesTotal for each state and to use StateNum to access the correct element in the table.
Once you realize that you can use a table to hold the sales totals and StateNum as an index into the table, the solution to the problem becomes very simple. A program to read the sales file, sum the sales, and display the results is given in Listing 11-1. In this example, to keep the program simple and focus on table creation and handling, I chose to display the results rather than write them to a print file.
Listing 11-1. Summing Candy Sales for Each State
IDENTIFICATION DIVISION.
PROGRAM-ID.  Listing11-1.
AUTHOR. Michael Coughlan
* Program to sum the CandySales for each branch of YoreCandyShoppe
* and display the results in StateNum order
* Using as input the Sequential BranchSalesFile ordered on ascending BranchId

ENVIRONMENT DIVISION.
INPUT-OUTPUT SECTION.
FILE-CONTROL.
   SELECT BranchSalesFile ASSIGN TO "Listing11-1BranchSales.dat"
          ORGANIZATION IS LINE SEQUENTIAL.

DATA DIVISION.
FILE SECTION.
FD BranchSalesFile.
01 BranchSalesRec.
   88 EndOfSalesFile  VALUE HIGH-VALUES.
   02 BranchId         PIC 9(7).
   02 StateNum         PIC 99.
   02 CandySales       PIC 9(7)V99.

WORKING-STORAGE SECTION.
01 StateSalesTable.
   02 StateSalesTotal  PIC 9(8)V99  OCCURS 50 TIMES.

01 StateIdx            PIC 99.
01 PrnStateSales       PIC $$$,$$$,$$9.99.

PROCEDURE DIVISION.
Begin.
   MOVE ZEROS TO StateSalesTable
   OPEN INPUT BranchSalesFile
   READ BranchSalesFile
      AT END SET EndOfSalesFile TO TRUE
   END-READ
   PERFORM UNTIL EndOfSalesFile
      ADD CandySales TO StateSalesTotal(StateNum)
      READ BranchSalesFile
        AT END SET EndOfSalesFile TO TRUE
     END-READ
   END-PERFORM
   DISPLAY "   YoreCandyShoppe Sales by State"
   DISPLAY "   ------------------------------"
   PERFORM VARYING StateIdx FROM 1 BY 1
           UNTIL StateIdx GREATER THAN 50
      MOVE StateSalesTotal(StateIdx) TO PrnStateSales
      DISPLAY "State ", StateIdx
              " sales total is " PrnStateSales
   END-PERFORM
   CLOSE BranchSalesFile
   STOP RUN.
Third Specification: Group Items as Table Elements
The elements of a table do not have to be elementary items. An element can be a group item. In other words, each element can be subdivided into two or more subordinate items.
Suppose the specification of the YoreCandyShoppe sales-report program changes so that in addition to summing the candy sales for each state, the program should count the number of branches and compute the average sales for the state. Final country totals should also be produced, showing Total-US-Sales, US-BranchCount, and Average-US-Sales.
One solution to this problem would be to set up two separate tables: one to hold state sales and another to hold the count of the number of branches in the state (see Example 11-2).
Example 11-2. The Two-Table Solution
01 StateSalesTable.
   02 StateSalesTotal      PIC 9(8)V99  OCCURS 50 TIMES.

01 StateBranchesTable.
   02 StateBranchCount     PIC 9(5)  OCCURS 50 TIMES.
Then all that would be required to calculate the average sales for the state would be a statement such as
COMPUTE AverageStateSales = StateSalesTotal(StateNum) / StateBranchCount(StateNum)
This is probably the way you would solve the problem in most languages. But in COBOL you can also set up a single table in which each element is defined as a group item that consists of the StateSalesTotal and the StateBranchCount (see Example 11-3).
Example 11-3. Solution Using the Group Item as a Table Element
01 StateSalesTable.
   02 StateTotals OCCURS 50 TIMES.
      03 StateSalesTotal    PIC 9(8)V99.
      03 StateBranchCount   PIC 9(5).
To calculate the average sales, you can use the same COMPUTE statement as before:
COMPUTE AverageStateSales = StateSalesTotal(StateNum) / StateBranchCount(StateNum)
A diagrammatic representation of this table description is shown in Figure 11-2. Each element of the table now consists of two parts: StateSalesTotal and StateBranchCount. These are subordinate to the StateTotals element. Data-manipulation opportunities abound. All these data names allow you to manipulate the data in the table at different levels of granularity. You can use the following commands:
- MOVE ZEROS TO StateSalesTable: See Figure 11-2. Fills the whole table with zeros.
- MOVE StateTotals(2) TO StateTotals(5): See Figure 11-2. Copies the contents of one element, including both subordinate items, to another element.
- DISPLAY StateBranchCount(3): Displays the contents of the StateBranchCount part of element 3.
- ADD CandySales TO StateSalesTotal(3): Adds CandySales to the contents of the StateSalesTotal part of element 3.

Figure 11-2. Table elements as group items. Element 3 is exploded to show details
Listing 11-2 is a solution to the problem posed by the changed specification. It uses the table defined in Example 11-3.
Listing 11-2. Table Elements as Group Items
IDENTIFICATION DIVISION.
PROGRAM-ID.  Listing11-2.
AUTHOR. Michael Coughlan
* Program that for each state and for the whole US
* sums the CandySales for each branch of YoreCandyShoppe
* counts the number of branches
* calculates the average sales per state and displays the results in StateNum order
* Uses as input the Sequential BranchSalesFile ordered on ascending BranchId

ENVIRONMENT DIVISION.
INPUT-OUTPUT SECTION.
FILE-CONTROL.
   SELECT BranchSalesFile ASSIGN TO "Listing11-2BranchSales.dat"
          ORGANIZATION IS LINE SEQUENTIAL.

DATA DIVISION.
FILE SECTION.
FD BranchSalesFile.
01 BranchSalesRec.
   88 EndOfSalesFile  VALUE HIGH-VALUES.
   02 BranchId              PIC 9(7).
   02 StateNum              PIC 99.
   02 CandySales            PIC 9(7)V99.

WORKING-STORAGE SECTION.
01 StateSalesTable.
   02 StateTotals OCCURS 50 TIMES.
      03 StateSalesTotal    PIC 9(8)V99.
      03 StateBranchCount   PIC 9(5).

01 StateIdx                 PIC 99.

01 ReportHeading1           PIC X(35)
                            VALUE "     YoreCandyShoppe Sales by State".
01 ReportHeading2           PIC X(35)
                            VALUE "     ------------------------------".
01 ReportHeading3           PIC X(47)
                            VALUE "State  Branches      StateSales    AverageSales".

01 DetailLine.
   02 PrnStateNum           PIC BZ9.
   02 PrnBranchCount        PIC B(3)ZZ,ZZ9.
   02 PrnStateSales         PIC B(5)$$$,$$$,$$9.99.
   02 PrnAveageSales        PIC BB$$$,$$$,$$9.99.

01 US-Totals.
   02 US-TotalSales        PIC 9(9)V99.
   02 US-BranchCount       PIC 9(6).
   02 PrnUS-TotalSales     PIC $,$$$,$$$,$$9.99.
   02 PrnUS-BranchCount    PIC B(9)ZZZ,ZZ9.
   02 PrnUS-AverageSales   PIC BBBB$$$,$$$,$$9.99.


PROCEDURE DIVISION.
Begin.
   MOVE ZEROS TO StateSalesTable
   OPEN INPUT BranchSalesFile
   READ BranchSalesFile
      AT END SET EndOfSalesFile TO TRUE
   END-READ
   PERFORM UNTIL EndOfSalesFile
      ADD CandySales TO StateSalesTotal(StateNum), US-TotalSales
      ADD 1 TO StateBranchCount(StateNum), US-BranchCount
      READ BranchSalesFile
        AT END SET EndOfSalesFile TO TRUE
     END-READ
   END-PERFORM
   PERFORM PrintResults

   CLOSE BranchSalesFile
   STOP RUN.

PrintResults.
   DISPLAY ReportHeading1
   DISPLAY ReportHeading2
   DISPLAY ReportHeading3
   PERFORM VARYING StateIdx FROM 1 BY 1
           UNTIL StateIdx GREATER THAN 50
      MOVE StateIdx TO PrnStateNum
      MOVE StateSalesTotal(StateIdx) TO PrnStateSales
      MOVE StateBranchCount(StateIdx) TO PrnBranchCount
      COMPUTE PrnAveageSales = StateSalesTotal(StateIdx) / StateBranchCount(StateIdx)
      DISPLAY DetailLine
   END-PERFORM
   MOVE US-TotalSales TO PrnUS-TotalSales
   MOVE US-BranchCount TO PrnUS-BranchCount
   COMPUTE PrnUS-AverageSales = US-TotalSales / US-BranchCount
   DISPLAY "YoreCandyShoppe branches in the US = " PrnUS-BranchCount
   DISPLAY "YoreCandyShoppe sales in the US    = " PrnUS-TotalSales
   DISPLAY "YoreCandyShoppe average US sales   = " PrnAveageSales.
Listing 11-2 uses a table in which each element is a group item that consists of the StateSalesTotal and the StateBranchCount. But the table is still a single-dimensional table. Sometimes the solution to a problem demands a multidimensional table approach. A multidimensional tableis one in which each element of the table is itself a table. This section considers multidimensional tables in the context of a specification change for the YoreCandyShoppe sales report.
Suppose each YoreCandyShoppe branch is asked to provide more granular sales data. Instead of reporting sales for the entire year, each branch must now report sales for each month. To do this, the sales record for each branch must be changed to accommodate a 12-element table of sales data. The new record description is given in Example 11-4.
Example 11-4. New Record Description That Records Candy Sales for Each Month
01 BranchSalesRec.
   88 EndOfSalesFile  VALUE HIGH-VALUES.
   02 BranchId              PIC 9(7).
   02 StateNum              PIC 99.
   02 SalesForMonth         PIC 9(5)V99 OCCURS 12 TIMES.
The report produced from the sales file must reflect this more granular data and is now required to show the following:
- Total sales for each state
- The count of the number of branches in the state
- Average sales per branch for each state
- Sales per month for each state
- Final country totals showing Total-US-Sales, US-BranchCount, and Average-US-Sales
In the program that implemented the previous specification, the sales for each state and the number of branches in each state were recorded in a 50-element table. In this version, instead of the total sales for the year, you have to record the sales per month. To do that, you need a two-dimensional table as described in Example 11-5.
Example 11-5. Two-dimensional Table to Record Sales per Month and the Number of Branches in the State
01 StateSalesTable.
   02 State OCCURS 50 TIMES.
      03 StateBranchCount   PIC 9(5).
      03 StateMonthSales    PIC 9(5)V99 OCCURS 12 TIMES.
COBOL DETAIL
If you wanted to manipulate the table at a further level of granularity, you could describe the table as
01 StateSalesTable.
   02 State OCCURS 50 TIMES.
      03 StateBranchCount   PIC 9(5).
      03 StateSales.
         04 StateMonthSales PIC 9(5)V99 OCCURS 12 TIMES.
The table description in Example 11-5 highlights a difference between COBOL tables and arrays. In other languages, two arrays would be required to record this information: a two-dimensional table to record the state sales per month and a one-dimensional table to record the number of branches per state. You can also record the data using two tables in COBOL, as shown in Example 11-6; but COBOL’s hierarchical structuring allows you to combine both tables so that each element of the first dimension consists of the BranchCount and a 12-element table containing the sales for each month.
Example 11-6. A Two-Table Solution
01 StateSalesTable.
   02 State OCCURS 50 TIMES.
      03 StateMonthSales    PIC 9(5)V99 OCCURS 12 TIMES.

01 StateBranchesTable.
   02 State OCCURS 50 TIMES.
      03 StateBranchCount   PIC 9(5).
Listing 11-3 is a solution to the changed specification that uses the two-dimensional table described in Example 11-5.
Listing 11-3. Using a Two-dimensional Table to Solve the Problem Posed by the Changed Specification
IDENTIFICATION DIVISION.
PROGRAM-ID.  Listing11-3.
AUTHOR. Michael Coughlan
* Program that for each state and for the whole US
* sums the Monthly Sales for each branch of YoreCandyShoppe, counts the number of
* branches and displays the State Sales per month in StateNum order
* Calculates the US sales, the number of branches in the US and the average US sales
* Uses as input the Sequential BranchSalesFile ordered on ascending BranchId

ENVIRONMENT DIVISION.
INPUT-OUTPUT SECTION.
FILE-CONTROL.
   SELECT BranchSalesFile ASSIGN TO "Listing11-3BranchSales.dat"
          ORGANIZATION IS LINE SEQUENTIAL.

DATA DIVISION.
FILE SECTION.
FD BranchSalesFile.
01 BranchSalesRec.
   88 EndOfSalesFile  VALUE HIGH-VALUES.
   02 BranchId              PIC 9(7).
   02 StateNum              PIC 99.
   02 SalesForMonth         PIC 9(5)V99 OCCURS 12 TIMES.

WORKING-STORAGE SECTION.
01 StateSalesTable.
   02 State OCCURS 50 TIMES.
      03 StateBranchCount   PIC 9(5).
      03 StateMonthSales    PIC 9(5)V99 OCCURS 12 TIMES.

01 ReportHeading.
   02  FILLER               PIC X(20)  VALUE SPACES.
   02  FILLER               PIC X(38) VALUE "YoreCandyShoppe Monthly Sales by State".

01 ReportUnderline.
   02  FILLER               PIC X(20)  VALUE SPACES.
   02  FILLER               PIC X(38) VALUE ALL "-".

01 ReportSubjectHeadings1.
   02 FILLER                PIC X(12)  VALUE "State   NOBs".
   02 FILLER                PIC X(63)
      VALUE  "     Jan        Feb        Mar        Apr        May        Jun".

01 ReportSubjectHeadings2.
   02 FILLER                PIC X(12) VALUE SPACES.
   02 FILLER                PIC X(63)
      VALUE  "     Jul        Aug        Sep        Oct        Nov        Dec".

01 DetailLine1.
   02 PrnStateNum           PIC BZ9.
   02 PrnBranchCount        PIC BBZZ,ZZ9.
   02 PrnMonthSales1        PIC B$$$,$$9.99 OCCURS 6 TIMES.

01 DetailLine2.
   02 FILLER                PIC X(11) VALUE SPACES.
   02 PrnMonthSales2        PIC B$$$,$$9.99 OCCURS 6 TIMES.

01 US-Totals.
   02 US-TotalSales        PIC 9(9)V99.
   02 US-BranchCount       PIC 9(6).
   02 PrnUS-TotalSales     PIC $,$$$,$$$,$$9.99.
   02 PrnUS-BranchCount    PIC B(9)ZZZ,ZZ9.
   02 PrnUS-AverageSales   PIC BB$$$,$$$,$$9.99.

01 StateIdx                PIC 99.
01 MonthIdx                PIC 99.

PROCEDURE DIVISION.
Begin.
   MOVE ZEROS TO StateSalesTable
   OPEN INPUT BranchSalesFile
   READ BranchSalesFile
      AT END SET EndOfSalesFile TO TRUE
   END-READ
   PERFORM UNTIL EndOfSalesFile
      ADD 1 TO StateBranchCount(StateNum), US-BranchCount
      PERFORM VARYING MonthIdx FROM 1 BY 1 UNTIL MonthIdx > 12
         ADD SalesForMonth(MonthIdx) TO
             StateMonthSales(StateNum, MonthIdx), US-TotalSales
      END-PERFORM
      READ BranchSalesFile
         AT END SET EndOfSalesFile TO TRUE
      END-READ
   END-PERFORM
   PERFORM DisplayResults
   CLOSE BranchSalesFile
   STOP RUN.

DisplayResults.
   DISPLAY ReportHeading
   DISPLAY ReportUnderline
   DISPLAY ReportSubjectHeadings1
   DISPLAY ReportSubjectHeadings2
   PERFORM VARYING StateIdx FROM 1 BY 1
           UNTIL StateIdx GREATER THAN 50
      MOVE StateIdx TO PrnStateNum
      MOVE StateBranchCount(StateIdx) TO PrnBranchCount
      PERFORM VARYING MonthIdx FROM 1 BY 1 UNTIL MonthIdx > 6
         MOVE StateMonthSales(StateIdx, MonthIdx) TO PrnMonthSales1(MonthIdx)
      END-PERFORM
      PERFORM VARYING MonthIdx FROM 7 BY 1 UNTIL MonthIdx > 12
         MOVE StateMonthSales(StateIdx, MonthIdx) TO PrnMonthSales2(MonthIdx - 6)
      END-PERFORM
      DISPLAY DetailLine1
      DISPLAY DetailLine2
      DISPLAY SPACES
   END-PERFORM
   MOVE US-TotalSales TO PrnUS-TotalSales
   MOVE US-BranchCount TO PrnUS-BranchCount
   COMPUTE PrnUS-AverageSales = US-TotalSales / US-BranchCount
   DISPLAY "YoreCandyShoppe branches in the US = " PrnUS-BranchCount
   DISPLAY "YoreCandyShoppe sales in the US    = " PrnUS-TotalSales
   DISPLAY "YoreCandyShoppe average US sales   = " PrnUS-AverageSales.
Correct Depiction of COBOL Tables
Two-dimensional tables are often depicted using a grid of rows and columns. This is an accurate representation for arrays, but for COBOL tables it has the flaw that it does not accurately reflect the data hierarchy.1
The table described in Example 11-5 allows you to manipulate the table using statements such as MOVE ZEROS TO State(1) and MOVE 123 TO BranchCount(2). In a row-and-column grid depiction, it is not clear how such manipulations are possible.
The diagram in Figure 11-3 uses the correct representation for StateSalesTable. This diagram expresses the data hierarchy inherent in the table description where one OCCURS clause is subordinate to another. With this representation, you can see how statements such as MOVE ZEROS TO State(1) and MOVE 123 TO StateBranchCount(2) affect the values in the table.
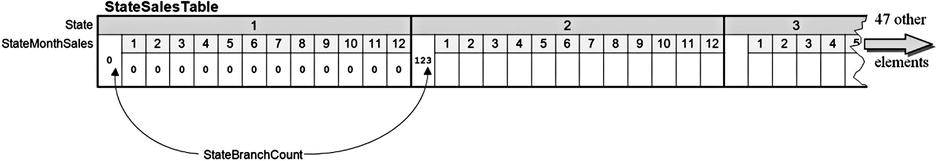
Figure 11-3. Diagram showing the hierarchy in a COBOL table description
In COBOL, multidimensional tables rarely have more than three dimensions. Prior to the ANS 85 version of COBOL, a maximum of three dimensions were permitted; the restriction on PERFORM..VARYING that allows only three counting variables harks back to those days. In the ANS 85 and ISO 2002 COBOL standards, the maximum number of dimensions is seven.
A discussion of how three-dimensional tables are created and processed should help to solidify your understanding of multidimensional tables. This time, however, I present the problem specification and show the declarations necessary to create the three-dimensional table, but I don’t write a full program. I leave that as an exercise for you at the end of the chapter.
Keep in mind that this specification is designed with an eye toward what is easy to present diagrammatically rather than toward realism.
Problem Specification
The U.S. Census Bureau has provided you with a subset of census data in a file containing the age category, gender, state number, and car-ownership information of every person in the country. The CensusFile is an unordered sequential file, and its records have the following description:
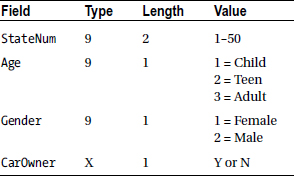
You are required to write a program to process the CensusFile and display the number of males and females in each AgeCategory (Child, Teen, and Adult) in each state, as shown in Figure 11-4.

Figure 11-4. Report template
To accumulate the population totals for each state, you use the three-dimensional table defined in Example 11-7.
Example 11-7. Three-dimensional Table to Hold Population Totals
01 US-PopulationTable.
   02 State OCCURS 50 TIMES.
      03 AgeCategory OCCURS 3 TIMES.
         04 GenderCategory OCCURS 2 TIMES.
            05 PopTotal   PIC 9(8).
For each record that you read from the CensusFile, you execute the following statement:
ADD 1 TO PopTotal(StateNum, Age, Gender)
Depicting a Three-dimensional Table
Figure 11-5 is a depiction of the three-dimensional table defined in the Example 11-7.
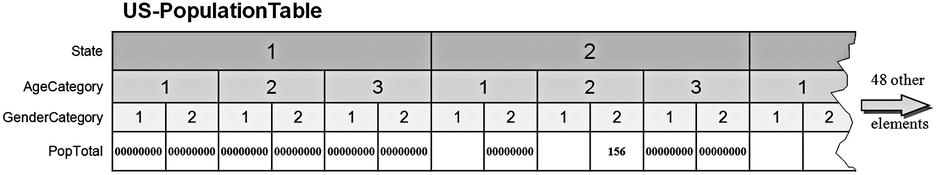
Figure 11-5. Structure of a three-dimensional table
The data in the table has been changed by executing the following statements:
MOVE ZEROS TO State(1)
MOVE ZEROS TO AgeCategory(2,3)
MOVE ZEROS TO GenderCategory (3,1,1)
MOVE ZEROS TO PopTotal(2,1,2)
MOVE 156 TO PopTotal(2,2,2)
As you can see from these statements, the data names defined in the table allow you to manipulate the table at various levels of granularity. When you refer to the State data item, you must use one subscript because it is a data item whose description contains an OCCURS clause. When you refer to AgeCategory, you must use two subscripts because AgeCategory is subordinate to an item that contains an OCCURS clause, and it itself contains an OCCURS clause. Finally, when you refer to GenderCategory and PopTotal, you must use three subscripts: GenderCategory is subordinate to two items that contain an OCCURS clause, and it contains an OCCURS clause itself; and PopTotal is subordinate to three items that contain an OCCURS clause. PopTotal and GenderCategory are data names that refer to the same area of storage. The US-PopulationTable could have been defined as
01 US-PopulationTable.
   02 State OCCURS 50 TIMES.
      03 AgeCategory OCCURS 3 TIMES.
         04 GenderCategory PIC 9(8) OCCURS 2 TIMES.
However, the PopTotal data item was added for clarity, as documentation.
Prefilled Tables
In all the examples in this chapter, the table used has been filled with data in the course of running the program. Sometimes, however, the table needs to be prefilled with data values. When the program starts, the table must already have been instantiated with the data values.
For instance, in Listing 11-3, when you display the results, you display a state number instead of the name of the state. Obviously it would be better to display the actual state name. A simple way to do this is to set up a prefilled table containing the names of the states and then display the appropriate name using a statement such as DISPLAY StateName(StateIdx).
REDEFINES Clause
To set up a prefilled table in COBOL, you have to use a special data-description clause called the REDEFINES clause. The REDEFINES clause is not limited to creating prefilled tables. It is a powerful data-manipulation language element that is used for a number of purposes. I discuss the REDEFINES clause in detail in Chapter 12, including its full syntax, the semantic rules that apply to it, and the many ways it may be used. In this chapter, I discuss the REDEFINES clause only in the context of creating prefilled tables.
When a file contains different types of records, a record description is created for each record type in the FILE SECTION. However, all these record descriptions map on to the same area of storage. They are, in effect, redefinitions of the area of storage. The REDEFINES clause allows you to achieve the same effect for units smaller than a record and in the other parts of the DATA DIVISION—not just the FILE SECTION.
Creating Prefilled Tables of Values
You can use the REDEFINES clause to create a prefilled table by applying the following procedure:
- Reserve an area of storage, and use the VALUE clause to fill it with the values required in the table.
- Use the REDEFINES clause to redefine the area of memory as a table.
For instance, to create a table prefilled with the names of the months, the first step is to reserve an area of storage and fill it with the names of the months (see Example 11-8). The diagram in Example 11-8 depicts the undifferentiated area of storage filled with the month names.
Example 11-8. Setting Up an Area of Storage Containing the Month Names
01 MonthTable.
   02 MonthValues.
      03 FILLER       PIC X(18) VALUE "January  February".
      03 FILLER       PIC X(18) VALUE "March    April".
      03 FILLER       PIC X(18) VALUE "May      June".
      03 FILLER       PIC X(18) VALUE "July     August".
      03 FILLER       PIC X(18) VALUE "SeptemberOctober".
      03 FILLER       PIC X(18) VALUE "November December".
![]()
The next step is to redefine the area of storage to impose a table definition on it, as shown in Example 11-9. Now MonthName(3) contains the value "March", and MonthName(6) contains "June".
Example 11-9. Redefining the Area of Storage as a Table
01 MonthTable.
   02 MonthValues.
      03 FILLER       PIC X(18) VALUE "January  February".
      03 FILLER       PIC X(18) VALUE "March    April".
      03 FILLER       PIC X(18) VALUE "May      June".
      03 FILLER       PIC X(18) VALUE "July     August".
      03 FILLER       PIC X(18) VALUE "SeptemberOctober".
      03 FILLER       PIC X(18) VALUE "November December".
   02 FILLER REDEFINES MonthValues.
      03 MonthName OCCURS 12 TIMES PIC X(9).

Creating a Prefilled Two-dimensional Table
To set up a two-dimensional table prefilled with data values, you use the same procedure as for a one-dimensional table. First you create an area of storage that contains the values you want in the table, and then you redefine the area as a table.
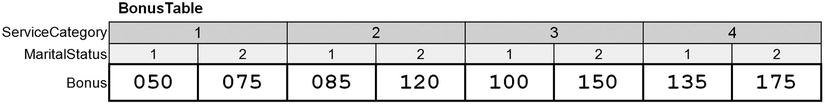
Suppose a company pays a bonus depending on ServiceCategory and MaritalStatus, as shown in Table 11-1. You can set up a prefilled table as shown in Example 11-10. In this table, Bonus(4,1) = 135 and Bonus(2,2) = 085. The data items MaritalStatus and Bonus refer to the same area of storage. The Bonus data item has been added for purposes of clarity.
Table 11-1. Bonus Table
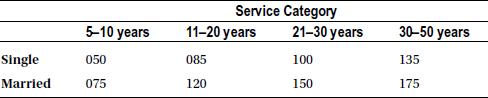
Example 11-10. Two-dimensional Bonus Table
01 BonusTable.
   02 BonusValues   PIC X(24) VALUE "050075085120100150135175".
   02 FILLER REDEFINES BonusValues.
      03 ServiceCategory OCCURS 4 TIMES.
         04 MaritalStatus OCCURS 2 TIMES.
            05 Bonus  PIC 9(3).
Prefilled Table Program
The program in Listing 10-1 in Chapter 10 implemented a three-level control break. In the discussion of that program, I noted that in order to reduce the amount of storage occupied by the data file, the normal practice would be to use a state number instead of a state name. I mentioned that in such a program, when it is necessary to print out the state name, the state number is converted to a name by means of a lookup table.
So let’s write a program to the same specification as Listing 10-1, except that now the records in the Sales file should use a state number rather than the full state name. The revised program specification follows.
Revised Specification
Electronics2Go has branches in a number of American states. A program is required to produce a report showing the total sales made by each salesperson, the total sales for each branch, the total sales for each state, and a final total showing the total sales for the entire United States. The report must be printed by ascending SalespersonId within ascending BranchId within ascending StateName.
The report is based on the Electronics2Go sales file. This file holds details of sales made in all the branches of the company. It is a sequential file, ordered on ascending SalespersonId within ascending BranchId within ascending StateNum. Each record in the sales file has the following description:

The report format should follow the template shown in Figure 11-6.
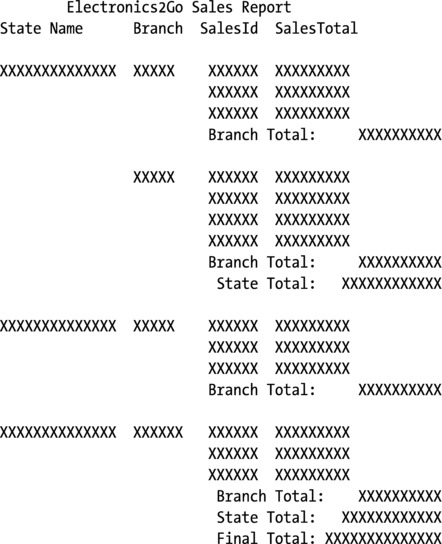
Figure 11-6. Template for the Electronics2Go sales report
Final Prefilled Table Program
The program in Listing 11-4 implements the final specification.
Listing 11-4. Report with Three Control Breaks, Using a State Name Table (Changes from Listing 10-1 Shown in Bold)
IDENTIFICATION DIVISION.
PROGRAM-ID. Listing11-4.
AUTHOR. Michael Coughlan.
* A three level Control Break program to process the Electronics2Go
* Sales file and produce a report that shows the value of sales for
* each Salesperson, each Branch, each State, and for the Country.
* The SalesFile is sorted on ascending SalespersonId within BranchId
* within StateNum.
* The report must be printed in SalespersonId within BranchId
* within StateName.  There is a correspondence between StateNum order
* and StateName order such that the order of records in
* the file is the same if the file is ordered on ascending StateNum
* as it is when the file is ordered on ascending StateName

ENVIRONMENT DIVISION.
INPUT-OUTPUT SECTION.
FILE-CONTROL.
SELECT SalesFile ASSIGN TO "Listing11-4TestData.Dat"
                 ORGANIZATION IS LINE SEQUENTIAL.

SELECT SalesReport ASSIGN TO "Listing11-4.RPT"
                   ORGANIZATION IS LINE SEQUENTIAL.

DATA DIVISION.
FILE SECTION.
FD  SalesFile.
01  SalesRecord.
    88 EndOfSalesFile VALUE HIGH-VALUES.
    02 StateNum          PIC 99.
    02 BranchId          PIC X(5).
    02 SalesPersonId     PIC X(6).
    02 ValueOfSale       PIC 9(4)V99.

FD SalesReport.
01 PrintLine             PIC X(55).

WORKING-STORAGE SECTION.
01  StateNameTable.
    02 StateNameValues.
       03 FILLER  PIC X(14) VALUE "Alabama".
       03 FILLER  PIC X(14) VALUE "Alaska".
       03 FILLER  PIC X(14) VALUE "Arizona".
       03 FILLER  PIC X(14) VALUE "Arkansas".
       03 FILLER  PIC X(14) VALUE "California".
       03 FILLER  PIC X(14) VALUE "Colorado".
       03 FILLER  PIC X(14) VALUE "Connecticut".
       03 FILLER  PIC X(14) VALUE "Delaware".
       03 FILLER  PIC X(14) VALUE "Florida".
       03 FILLER  PIC X(14) VALUE "Georgia".
       03 FILLER  PIC X(14) VALUE "Hawaii".
       03 FILLER  PIC X(14) VALUE "Idaho".
       03 FILLER  PIC X(14) VALUE "Illinois".
       03 FILLER  PIC X(14) VALUE "Indiana".
       03 FILLER  PIC X(14) VALUE "Iowa".
       03 FILLER  PIC X(14) VALUE "Kansas".
       03 FILLER  PIC X(14) VALUE "Kentucky".
       03 FILLER  PIC X(14) VALUE "Louisiana".
       03 FILLER  PIC X(14) VALUE "Maine".
       03 FILLER  PIC X(14) VALUE "Maryland".
       03 FILLER  PIC X(14) VALUE "Massachusetts".
       03 FILLER  PIC X(14) VALUE "Michigan".
       03 FILLER  PIC X(14) VALUE "Minnesota".
       03 FILLER  PIC X(14) VALUE "Mississippi".
       03 FILLER  PIC X(14) VALUE "Missouri".
       03 FILLER  PIC X(14) VALUE "Montana".
       03 FILLER  PIC X(14) VALUE "Nebraska".
       03 FILLER  PIC X(14) VALUE "Nevada".
       03 FILLER  PIC X(14) VALUE "New Hampshire".
       03 FILLER  PIC X(14) VALUE "New Jersey".
       03 FILLER  PIC X(14) VALUE "New Mexico".
       03 FILLER  PIC X(14) VALUE "New York".
       03 FILLER  PIC X(14) VALUE "North Carolina".
       03 FILLER  PIC X(14) VALUE "North Dakota".
       03 FILLER  PIC X(14) VALUE "Ohio".
       03 FILLER  PIC X(14) VALUE "Oklahoma".
       03 FILLER  PIC X(14) VALUE "Oregon".
       03 FILLER  PIC X(14) VALUE "Pennsylvania".
       03 FILLER  PIC X(14) VALUE "Rhode Island".
       03 FILLER  PIC X(14) VALUE "South Carolina".
       03 FILLER  PIC X(14) VALUE "South Dakota".
       03 FILLER  PIC X(14) VALUE "Tennessee".
       03 FILLER  PIC X(14) VALUE "Texas".
       03 FILLER  PIC X(14) VALUE "Utah".
       03 FILLER  PIC X(14) VALUE "Vermont".
       03 FILLER  PIC X(14) VALUE "Virginia".
       03 FILLER  PIC X(14) VALUE "Washington".
       03 FILLER  PIC X(14) VALUE "West Virginia".
       03 FILLER  PIC X(14) VALUE "Wisconsin".
       03 FILLER  PIC X(14) VALUE "Wyoming".
02 FILLER REDEFINES StateNameValues.
   03 StateName PIC X(14) OCCURS 50 TIMES.

01  ReportHeading.
    02 FILLER               PIC X(35)
       VALUE "        Electronics2Go Sales Report".

01  SubjectHeading.
    02 FILLER               PIC X(43)
       VALUE "State Name      Branch  SalesId  SalesTotal".

01  DetailLine.
    02 PrnStateName         PIC X(14).
       88 SuppressStateName VALUE SPACES.
    02 PrnBranchId          PIC BBX(5).
       88 SuppressBranchId  VALUE SPACES.
    02 PrnSalespersonId     PIC BBBBX(6).
    02 PrnSalespersonTotal  PIC BB$$,$$9.99.

01  BranchTotalLine.
    02 FILLER               PIC X(43)
       VALUE "                         Branch Total:    ".
    02 PrnBranchTotal       PIC $$$,$$9.99.

01  StateTotalLine.
    02 FILLER               PIC X(40)
       VALUE "                         State Total :  ".
    02 PrnStateTotal        PIC $$,$$$,$$9.99.

01  FinalTotalLine.
    02 FILLER               PIC X(39)
       VALUE "                         Final Total :".
    02 PrnFinalTotal        PIC $$$,$$$,$$9.99.

01  SalespersonTotal        PIC 9(4)V99.
01  BranchTotal             PIC 9(6)V99.
01  StateTotal              PIC 9(7)V99.
01  FinalTotal              PIC 9(9)V99.

01  PrevStateNum            PIC 99.
01  PrevBranchId            PIC X(5).
01  PrevSalespersonId       PIC X(6).


PROCEDURE DIVISION.
Begin.
   OPEN INPUT SalesFile
   OPEN OUTPUT SalesReport
   WRITE PrintLine FROM ReportHeading  AFTER ADVANCING 1 LINE
   WRITE PrintLine FROM SubjectHeading AFTER ADVANCING 1 LINE

   READ SalesFile
      AT END SET EndOfSalesFile TO TRUE
   END-READ
   PERFORM UNTIL EndOfSalesFile
      MOVE StateNum TO PrevStateNum,
      MOVE StateName(StateNum) TO PrnStateName
      MOVE ZEROS TO StateTotal
      PERFORM SumSalesForState
              UNTIL StateNum NOT = PrevStateNum
                    OR EndOfSalesFile
      MOVE StateTotal TO PrnStateTotal
      WRITE PrintLine FROM StateTotalLine AFTER ADVANCING 1 LINE
   END-PERFORM

   MOVE FinalTotal TO PrnFinalTotal
   WRITE PrintLine FROM FinalTotalLine AFTER ADVANCING 1 LINE

   CLOSE SalesFile, SalesReport
   STOP RUN.

SumSalesForState.
    WRITE PrintLine FROM SPACES AFTER ADVANCING 1 LINE
    MOVE BranchId TO PrevBranchId, PrnBranchId
    MOVE ZEROS TO BranchTotal
    PERFORM SumSalesForBranch
            UNTIL BranchId NOT = PrevBranchId
                  OR StateNum NOT = PrevStateNum
                  OR EndOfSalesFile
      MOVE BranchTotal TO PrnBranchTotal
      WRITE PrintLine FROM BranchTotalLine AFTER ADVANCING 1 LINE.

SumSalesForBranch.
    MOVE SalespersonId TO PrevSalespersonId, PrnSalespersonId
    MOVE ZEROS TO SalespersonTotal
    PERFORM SumSalespersonSales
            UNTIL SalespersonId NOT = PrevSalespersonId
                  OR BranchId   NOT = PrevBranchId
                  OR StateNum  NOT = PrevStateNum
                  OR EndOfSalesFile
    MOVE SalespersonTotal TO PrnSalespersonTotal
    WRITE PrintLine FROM DetailLine AFTER ADVANCING 1 LINE
    SET SuppressBranchId TO TRUE
    SET SuppressStateName TO TRUE.

SumSalespersonSales.
    ADD ValueOfSale TO SalespersonTotal, BranchTotal, StateTotal, FinalTotal
    READ SalesFile
      AT END SET EndOfSalesFile TO TRUE
    END-READ.
ANS 85 Table Changes
The ANS 85 COBOL standard introduced a number of changes to tables. Among these changes is a method that lets you create prefilled tables without using the REDEFINES clause, as long as the number of values is small. For large amounts of data, the REDEFINES clause is still required.
The new method works by assigning the values to a group name defined over a subordinate table. For instance, in Example 11-11, the data item Day actually declares the table, but I have given the table the overall group name DayTable. Assigning the values to this group name fills the area of the table with the values.
Example 11-11. Creating a Prefilled Table Without the REDEFINES Clause
01 DayTable VALUE "MonTueWedThrFriSatSun".
   02 Day OCCURS 7 TIMES PIC X(3).

The ANS 85 COBOL standard also introduced some changes to the way tables are initialized. In the previous versions of COBOL, initializing a table was never a problem if the elements of the table were elementary items. All that was required was to move the initializing value to the table’s group name. For instance, the statement MOVE ZEROS TO DriverTable initializes the following table to zeros:
01 DriverTable.
   02 StateDrivers  PIC 9(7) OCCURS 50 TIMES.
But initializing a table was much more difficult if each element was a group item that contained different types of data. For instance, in the following table, the StateDrivers part of the element had to be initialized to zeros, and the StateName part had to be initialized to spaces. The only way do this was to initialize the items, element by element, using iteration:
01 DriverTable.
   02 State OCCURS 50 TIMES.
      03 StateDrivers  PIC 9(7).
      03 StateName     PIC X(14).
The ANS 85 standard introduced a new way to initialize table elements that solves this problem. A table cannot be initialized by assigning an initial value to each part of an element using the VALUE clause. The following description initializes the StateDrivers part of the element to zeros and the StateName part to spaces:
01 DriverTable.
   02 State OCCURS 50 TIMES.
      03 StateDrivers  PIC 9(7)  VALUE ZEROS.
      03 StateName     PIC X(14) VALUE SPACES.
This example shows the ANS 85 changes that allow table elements to be initialized when a program starts; but sometimes data items need to be reinitialized while a program is running. The ANS 85 standard added the INITIALIZE verb for this purpose. The INITIALIZE verb sets data items, including table elements, either to their MOVE fill value (zero for numeric items, spaces for alphabetic or alphanumeric items) or to a specified compatible replacement value. The metalanguage for the INITIALIZE verb is given in Figure 11-7.
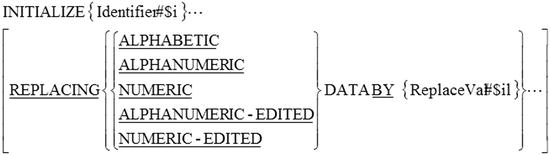
Figure 11-7. Metalanguage for the INITIALIZE verb
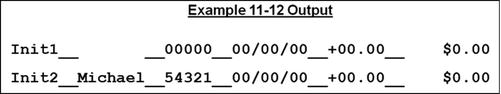
A large number of rules govern the operation of the INITIALIZE verb. For full details, please consult your COBOL manual. To get a feel for how INITIALIZE operates, examine output produced by the code in Example 11-12.
Example 11-12. Example Uses of the INITIALIZE Verb
01 GroupItem.
   02 Data1    PIC X(7).
   02 Data2    PIC 9(5).
   02 Data3    PIC 99/99/99.
   02 Data4    PIC +99.99.
   02 Data5    PIC $$,$$9.99.
:  :  :  :  :  :  :  :  :  :  :  :
PROCEDURE DIVISION.
Begin.
   MOVE ALL "-" TO GroupItem
   INITIALIZE GroupItem
   DISPLAY "Init1__" Data1 "__" Data2 "__" Data3 "__" Data4 "__" Data5.

   INITIALIZE GroupItem REPLACING ALPHANUMERIC BY "Michael"
                                  NUMERIC BY 54321.

   DISPLAY "Init2__" Data1 "__" Data2 "__" Data3 "__" Data4 "__" Data5.

   STOP RUN.
Summary
This chapter introduced the concept of tabular data. You learned how to create tables using the OCCURS clause and were introduced to the notion of group items as table elements. I discussed multidimensional tables and showed how to create, use, and graphically depict them. In the final section, you saw how to use the REDEFINES clause to create a table prefilled with table values, and I discussed the table declaration changes that were introduced with the ANS 85 standard.
The next chapter discusses the other uses of the REDEFINES clause and introduces the similar but ill-favored RENAMES clause. You learn about the importance of decimal arithmetic for the business and enterprise programming domains and discover the use and purpose of the USAGE clause.
PROGRAMMING EXERCISE
Earlier in this chapter, I presented a problem specification and suggested an approach to solving the problem that involved using a three-dimensional table. Although the table was defined in Example 11-7, no solution was given. Because you have a problem and no solution, this is an excellent opportunity for you to get some practice using three-dimensional tables.
A subset of the U.S. census data has been made available to you by the U.S. Census Bureau (not really—this is just the specification scenario) in an unordered sequential file called the CensusFile. The CensusFile contains the age category (adult, teen, child), gender, state number, and car-ownership information of every person in the country. Each record in the file has the following description:
Write a program to process the CensusFile and produce a Population Details Report that displays the number of males and females in each AgeCategory (Child, Teen, and Adult) in each state. The report format should be as shown in Figure 11-8.

Figure 11-8. Template for the Population Details Report
Specification Extension
Change the three-dimensional table so that it can be used to accumulate the number of car owners in each state. Change the program so that the format of the report now conforms to the template in Figure 11-9.
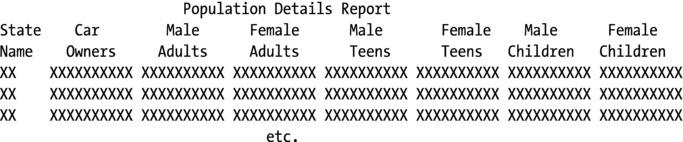
Figure 11-9. Template for the Population Details Report that includes car ownership details
References
1. Fowler GC, Glorfeld LW. COBOL tables: A proposed standard of presentation. SIGCSE Bull. 1983; 15(1): 200-203. http://doi.acm.org/10.1145/952978.801046
doi=10.1145/952978.801046