
This chapter covers an introduction to monitoring, including why it is needed and how it helps in a real-time environment. This chapter also covers the monitoring that is included by default with each cloud vendor. The cloud vendors provide different types of monitoring, so you just need to differentiate among them when choosing the right monitoring. This chapter includes virtual machines and PostgreSQL services for each vendor.
Monitoring with Amazon Cloud
Amazon Cloud offers several services that let you build your databases, applications, or your entire infrastructure ecosystem. It is very important to have one service that lets you monitor the ecosystem built using AWS. As we are mainly concerned about PostgreSQL on AWS in this book, we need a service that helps us monitor instances. As you probably guessed, Amazon offers a service called CloudWatch that helps you monitor your RDS and EC2 instances. One of the important features needed in an infrastructure is historic data. CloudWatch Service helps you look into historic data and analyze the resource utilization so you can rightsize your AWS instances. All the data collected by monitoring will be retained for 15 months, even if the instance was terminated. This helps you look back at a certain point in history.
Monitoring an RDS or an EC2 Instance
Monitoring is enabled for all the RDS and EC2 instances by default. Statistics or diagnostic data about every RDS Instance is collected every minute or every five minutes as subscribed and made available for CloudWatch.
Enabling monitoring
Searching for CloudWatch
Basic Monitoring: This is free. You get seven metrics that are collected every five minutes free of charge. You also get three status check metrics for free.
Detailed Monitoring: Collects the same metrics as the Basic Monitoring option , but at a frequency of every minute.
- 1.
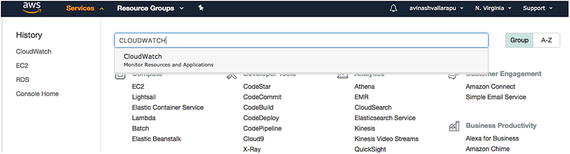
After logging in to the AWS Console, search for EC2 Under Services and click on it.
- 2.Now click on Instances to see the list of running EC2 instances on your account, as shown in Figure 12-3.
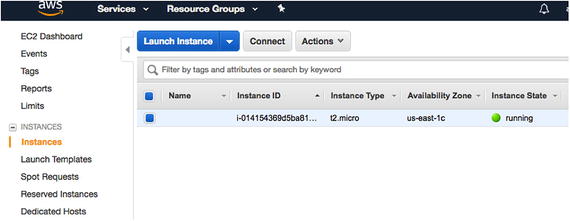 Figure 12-3
List of running EC2 instances on the account
- 3.Choose the instance for which you need to enable detailed monitoring . Click on Actions. Under the Actions dropdown, click on CloudWatch Monitoring and Enable Detailed Monitoring, as shown in Figure 12-4.
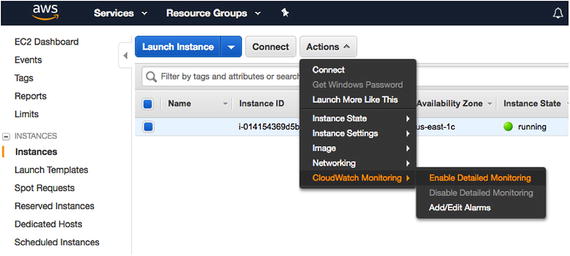 Figure 12-4
Enable detailed monitoring
- 4.
You have now enabled detailed monitoring, so let’s see how you can create alarms.
Choose the instance for which you need to create alarms and click on the Actions dropdown. Choose CloudWatch Monitoring and click on Add/Edit Alarms (see Figure 12-5).
You do not have to enable detailed monitoring to create alarms. It is just an option to enable granular debugging.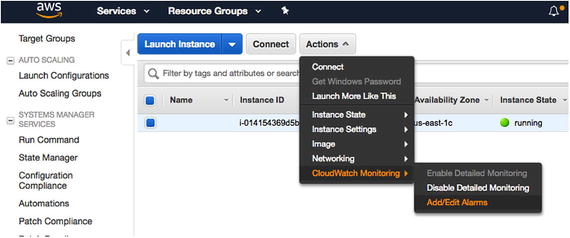 Figure 12-5
Creating an alarm
- 5.Once you click on Add/Edit Alarms, you get an option to Create Alarm , as shown in Figure 12-6. Click on it to proceed.
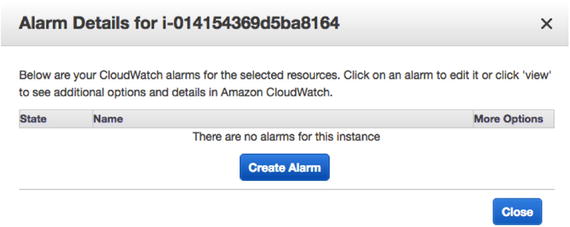 Figure 12-6
Create an alarm by clicking the button
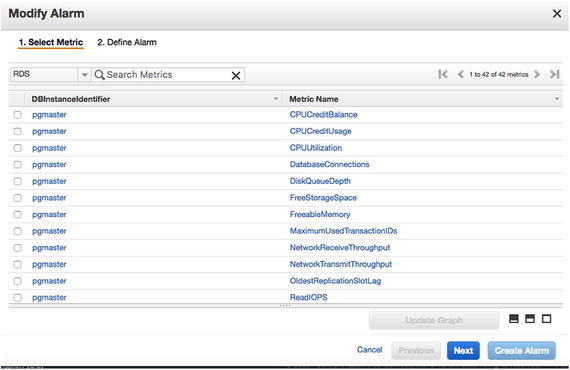
- 6.Now you can choose a title for your alarm and pick the recipients who should be notified about it. You can choose the metric for which you need an alarm or notification to be sent . Alarms are not free. There is a charge involved, depending on the alarms you create. Choose the threshold at which you should be notified and then click on Create Alarm, as shown in Figure 12-7.
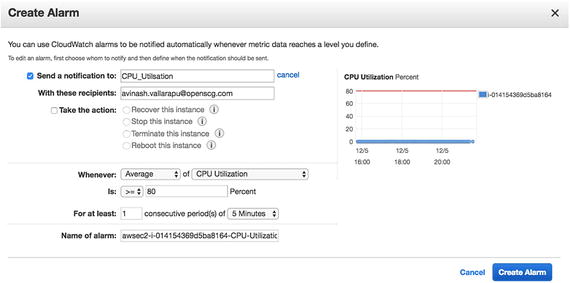 Figure 12-7
Pick your thresholds for the alarm
- 7.Here is a list of alarms that you can create (see Figure 12-8).
CPU Utilization
Disk Reads
Disk Read Operations
Disk Writes
Disk Write Operations
Network In
Network Out
Status Check Failed (Any)
Status Check Failed (Instance)
Status Check Failed (System)
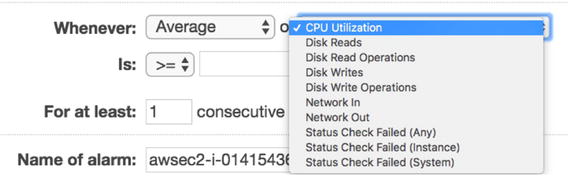 Figure 12-8
The dropdown list of alarms that you can create
- 8.Once you have created your alarm, you should get a popup that says that you need to confirm your subscription within three days , as shown in Figure 12-9.
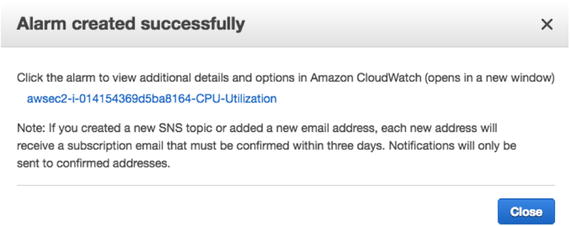 Figure 12-9
Alarm created successfully message
You should also receive an email that asks you to confirm the subscription, as shown in Figure 12-10. Click on Confirm Subscription .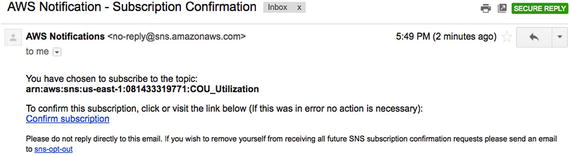 Figure 12-10
Email confirming the subscription
- 9.If you need to add more alarms, you can search for CloudWatch Service and click on Alarms. You’ll see an option to create an alarm (see Figure 12-11). You can then create an alarm for another metric.
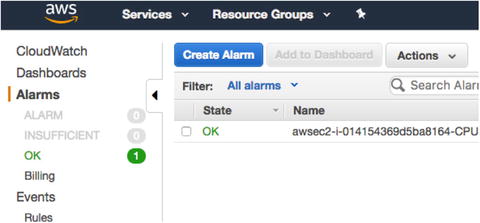 Figure 12-11
You can create more alarms through the CloudWatch service
- 10.
There are several metrics available for creating alarms. These alarms are not restricted to an EC2 instance (see Figure 12-12).
You can have alarms created for:EBS volumes
EC2 instances (per-instance and across all instances)
Logs metrics
RDS instances (per-database and across all databases)
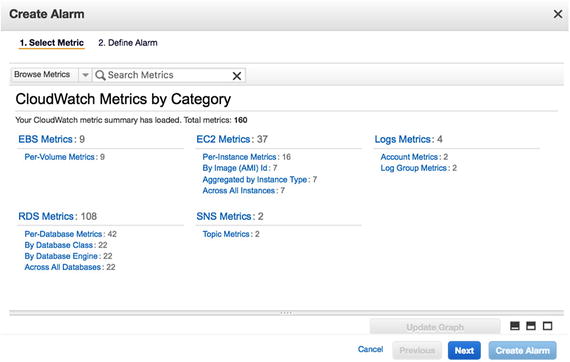 Figure 12-12
Metrics by category
You can set an alarm for your RDS instances as well
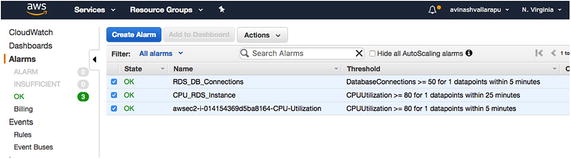
Checking the state of the alarms
AWS CloudWatch Dashboard
The Amazon Dashboard enables you to view all the resource utilization in a graphical view. These dashboards can be created or customized as you like.
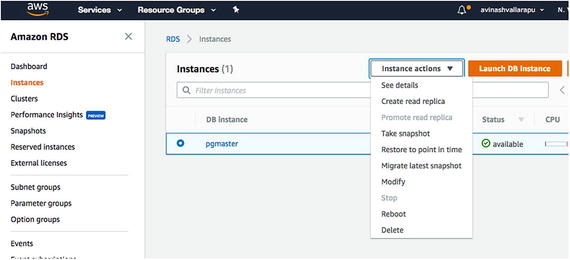
Looking at the instances
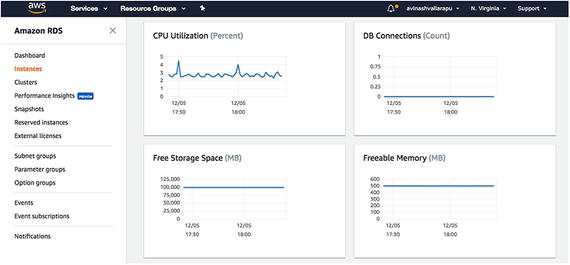
The dashboard showing various metrics
Create a Customized Dashboard for an EC2 Instance
- 1.Click on Dashboards and then click on Create Dashboards (see Figure 12-17). You’ll see a popup where you choose a dashboard name. Click Next to proceed.
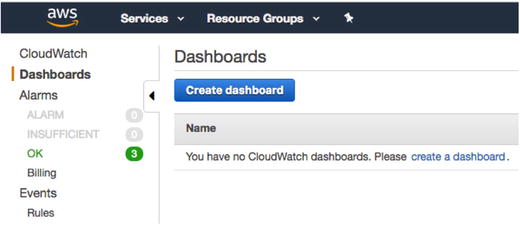 Figure 12-17
Name the dashboard
- 2.You can choose a widget type of your choice, as shown in Figure 12-18. Choose a widget type and click on Configure .
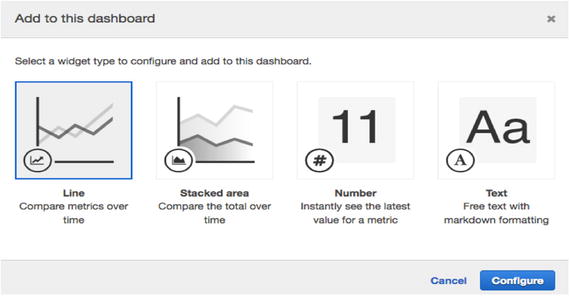 Figure 12-18
Choose a widget type for your dashboard
- 3.Choose the service for which you need to create a dashboard, as shown in Figure 12-19.
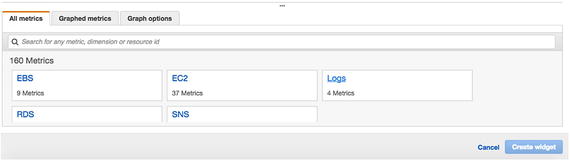 Figure 12-19
Choose a service for the dashboard
- 4.If you selected EC2, you can select Per-Instance Metrics or Metrics for All, as shown in Figure 12-20.
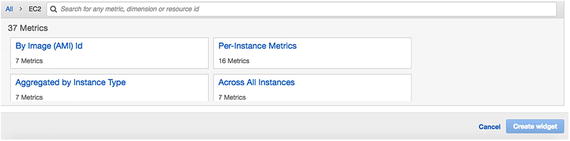 Figure 12-20
Choose the type of metrics
- 5.Let’s say you choose per-instance metrics. If so, you’ll get an option to choose the metric to be displayed on the dashboard. Click on the metric and Create Widget. See Figure 12-21.
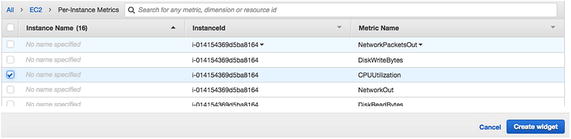 Figure 12-21
Creating the widget
- 6.Proceed to create as many widgets as you need. You may finally see a dashboard. This dashboard shown in Figure 12-22 includes RDS and EC2 instances. However, it is wise to have multiple dashboards for each instance or instance type.
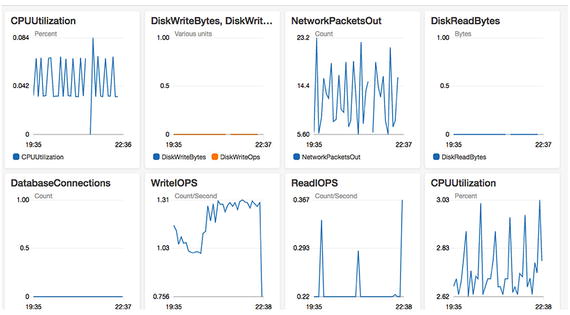 Figure 12-22
Dashboard with RDS and EC2 instances
Monitoring for Rackspace Cloud Servers
- 1.On the Rackspace portal, you can see your server created (see Figure 12-23). The Monitoring column shows green dots , which indicates monitoring of each metric.
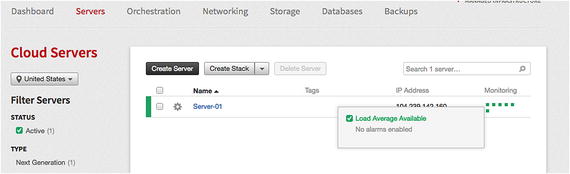 Figure 12-23
The Rackspace portal, with monitoring shown
- 2.Click on the server that you want to see and you will see the Monitoring Checks section, as shown in Figure 12-24.
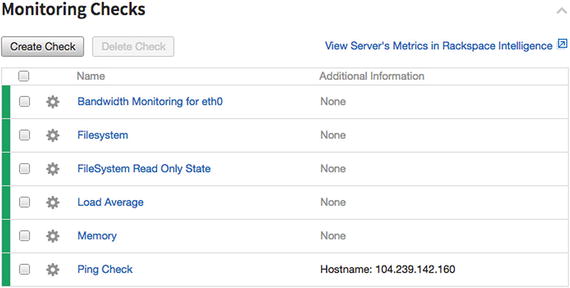 Figure 12-24
Monitoring checks section
- 3.If you click on each metric, you will see details with graphs. See Figure 12-25.
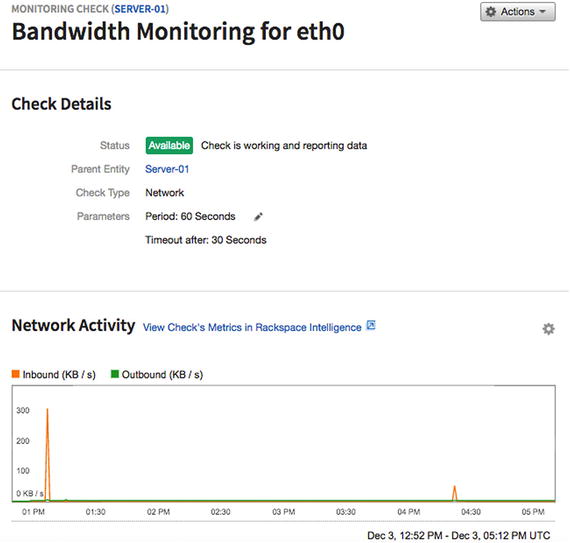 Figure 12-25
Graphs of the monitoring process
- 4.If you click on View Check's Metrics in Rackspace Intelligence , you can some detailed graphs if you scroll down. See Figure 12-26.
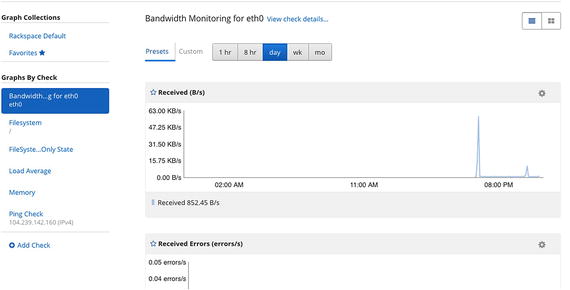 Figure 12-26
Detailed graphs of the monitoring process
- 5.You can create alarms for each metric. You need to click on Create Alarm , as shown in Figure 12-27.
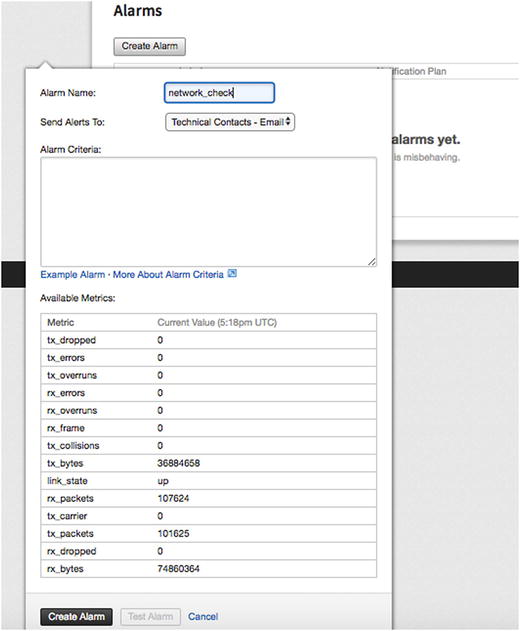 Figure 12-27
You can create alarms for each metric
You can find more about alarms at https://developer.rackspace.com/docs/rackspace-monitoring/v1/tech-ref-info/alert-triggers-and-alarms .
- 6.
You can set up mobile monitoring as well. For more details, go to https://support.rackspace.com/how-to/introducing-rackspace-monitoring-on-mobile-devices .
- 7.
You can set up notifications and a notifications plan for your alarms . For more information, visit https://developer.rackspace.com/docs/rackspace-monitoring/v1/getting-started/create-first-monitor/ .
Monitoring Google Cloud Instances
By default, Google Cloud monitors Compute Engine VM instances and cloud SQL instances. There are different kinds of monitoring depending on your needs, such as monitoring activities for your project, monitoring the VM instance, or monitoring your PostgreSQL instance. Let’s look at each in detail.
Monitoring Your Project Activities
- 1.
Log in to your console using your credentials. https://console.cloud.google.com
- 2.Select Logging from the StackDriver section on the left panel, as shown in Figure 12-28.
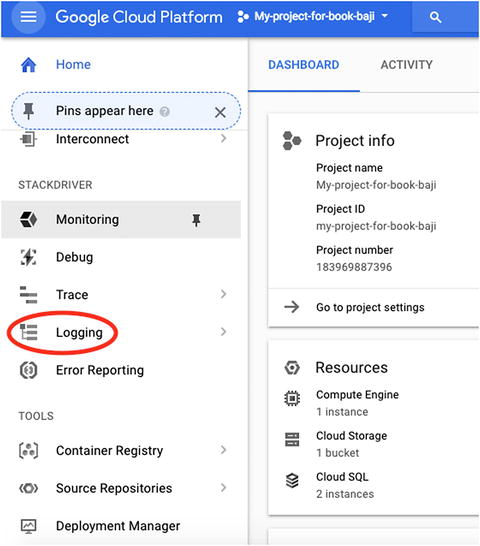 Figure 12-28
Choose Logging
- 3.Select the project that you want to monitor. You will see the activities performed under that project . See Figure 12-29.
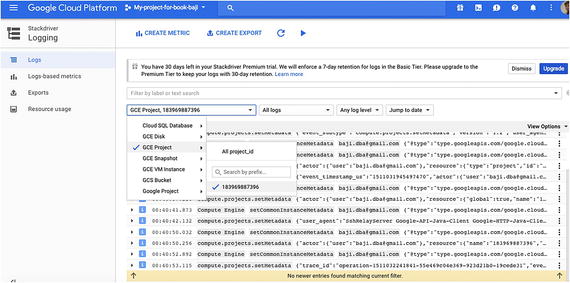 Figure 12-29
Select the project you want to monitor
- 4.You can create your own metrics for a specific period of time. Then you can see the metrics from Logs-Based Metrics on the left panel, as shown in Figure 12-30.
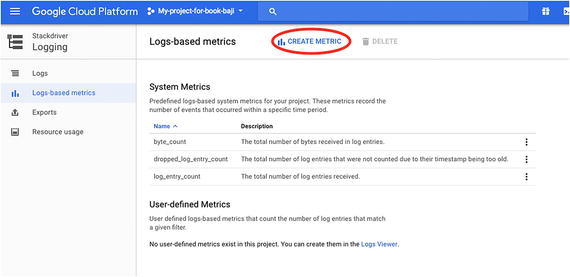 Figure 12-30
Create your own metrics here
- 5.
Logging usage can be viewed from the Resource Usage tab on left panel of the same page.
Monitoring VM Instances
- 1.
Log in to the console at https://console.cloud.google.com .
- 2.
Select VM Instances from Compute Engine on the left panel.
- 3.Click on the instance that you want to monitor. You will see nice graphs of monitoring, as shown in Figure 12-31.
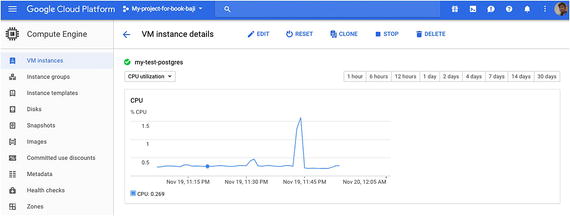 Figure 12-31
Monitoring graphs
- 4.You can see these metrics in the monitoring report :
CPU utilization
Disk bytes
Disk operations
Network bytes
Network packets
- 5.
You can see graphs captured for 30 days.
Monitoring PostgreSQL Instances
- 1.
Log in to the console at https://console.cloud.google.com .
- 2.
Select SQL from the left panel.
- 3.Select the instance that you want to see monitoring and you will see the monitoring graphs in the Overview tab, as shown in Figure 12-32.
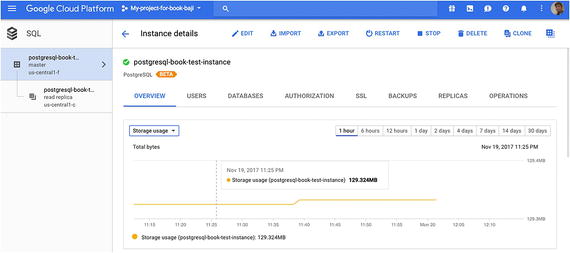 Figure 12-32
The monitoring graphs in the Overview tab
- 4.This provides operating system and database metrics. Figure 12-33 shows the metrics captured for the PostgreSQL instance.
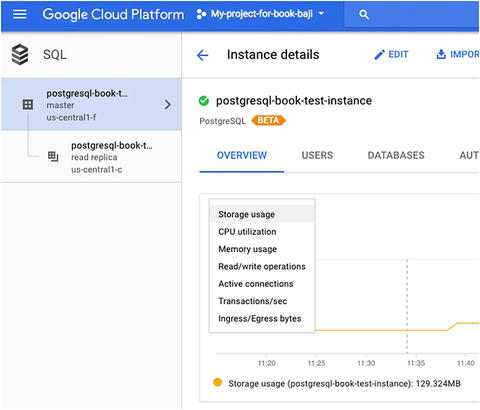 Figure 12-33
Metrics captured for the PostgreSQL instance
- 5.If you click on the Operations tab on the same page, you can see the operations performed for particular instances, such as shown in Figure 12-34.
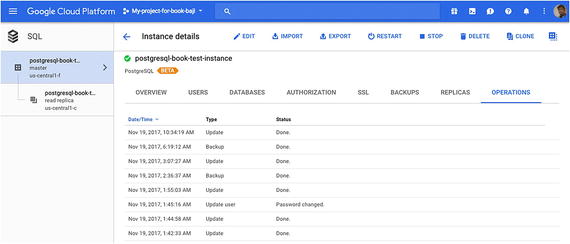 Figure 12-34
Operations for particular instances
- 6.You can also see the PostgreSQL database logs by choosing the View PostgreSQL Error Logs option from the the Operation and Logs section. See Figure 12-35.
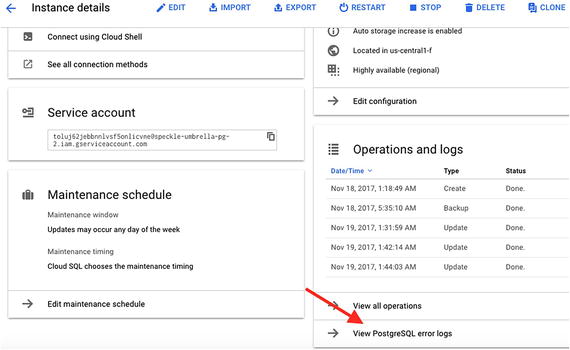 Figure 12-35
Viewing the PostgreSQL database logs
- 7.
If you want to monitor more metrics of PostgreSQL apart from the metrics that are provided by default, you can look at the PostgreSQL plugin at https://cloud.google.com/monitoring/agent/plugins/postgreSQL .
- 1.
You need to provide your Gmail ID to log in and then create an account, which come with 30-day free trail. See https://app.google.stackdriver.com/ .
- 2.
Add a project that you want to monitor.
- 3.A typical StackDriver window is shown in Figure 12-36.
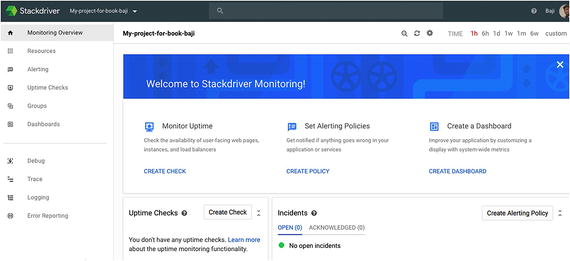 Figure 12-36
Typical StackDriver window
- 4.
You can set up alerting policies , monitor uptime of applications and instances, and more.
Monitoring Azure Cloud Instances
Virtual machines
Azure Database for PostgreSQL
Virtual Machines
- 1.
Click on All Resources on the left panel of your Azure Portal.
- 2.
Click on the virtual machine that was already created.
- 3.You can see Monitoring section once you click on the virtual machine, as shown in Figure 12-37.
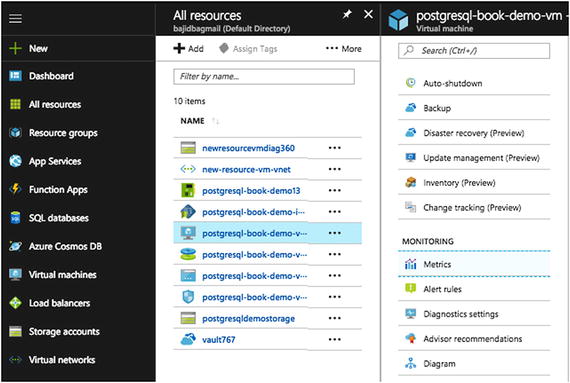 Figure 12-37
Monitoring section of the Azure Portal
- 4.If you click on Metrics under the Monitoring section, you can see the list of metrics that you can monitor, as shown in Figure 12-38.
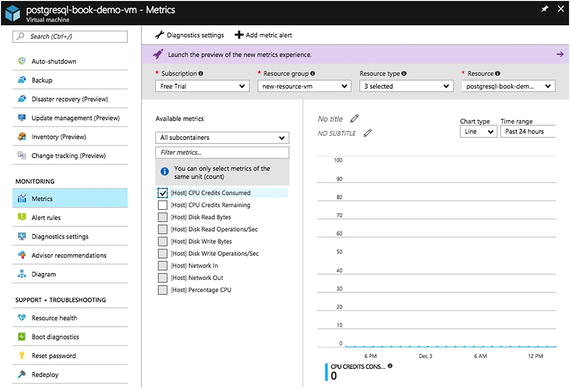 Figure 12-38
Metrics that you can monitor
- 5.
You can select the metric that you want to monitor. Be sure to select the metric of same unit.
- 6.You can create alerts on each metric. For that, you need to click on Alert Rules on the same page. Then click on Add Metric Alert, as highlighted in Figure 12-39.
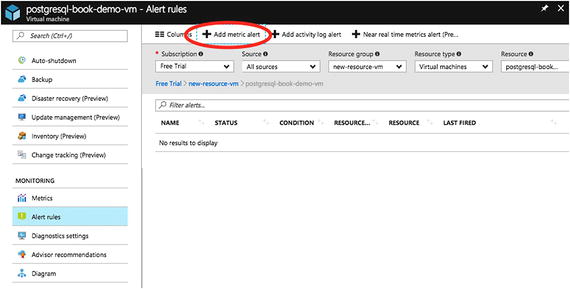 Figure 12-39
Choose to add a metric alert
- 7.Once you click on Add Metric Alert , you will see a window where you need to provide the details to create an alert on a metric. See Figures 12-40 and 12-41.
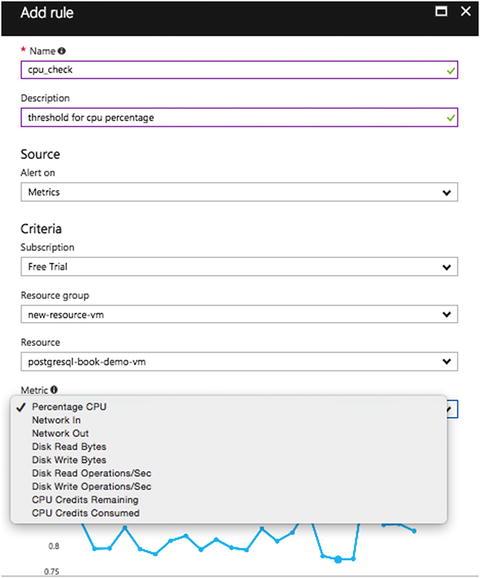 Figure 12-40
Provide details to create the alert on a metric
Name: Specify a name to identify this rule
Description: Describe the rule
Subscription: Select the subscription
Resource group: Select the resource group that you want to create an alert on
Resource: Select the resource for creating the alert
Metric: Select the metric that you want this alert rule to monitor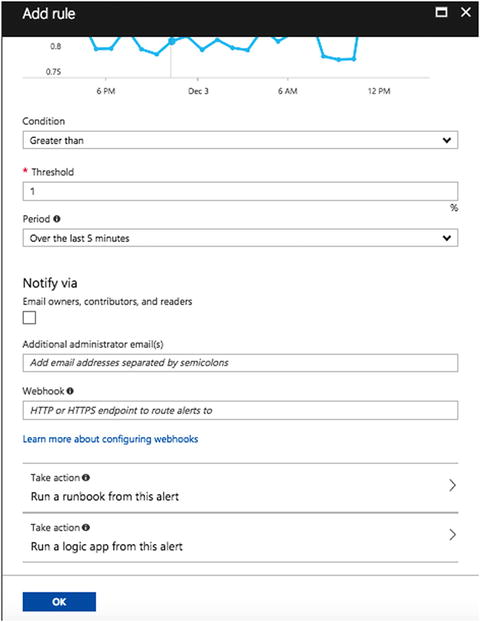 Figure 12-41
Set up the alert
Condition: Condition for the alert
Threshold: Threshold to send the alert
Period: Select a time span during which to monitor the metric data specified by this alert rule
Webhook: Choose the HTTP or HTTPs endpoint that will route the Azure alerts to other notification channels
Take action: Select an automation runbook to run each time the alert is triggered (see Figure 12-42)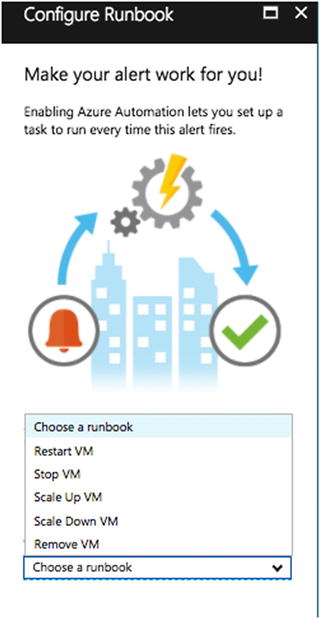 Figure 12-42
Select an automation runbook
- 8.You can also look at advisor recommendations from Azure to set up metrics and alerts, as shown in Figure 12-43.
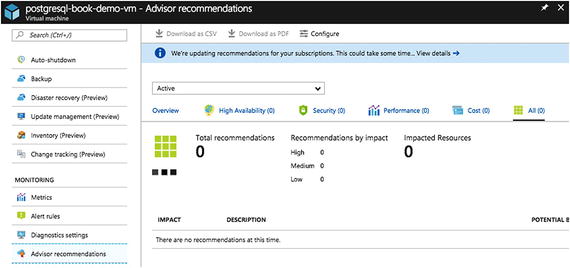 Figure 12-43
Advisor recommendations from Azure
Azure Database for PostgreSQL
- 1.Select the PostgreSQL instance and select Metrics from the Monitoring section. You will see the OS metrics, as shown in Figure 12-44.
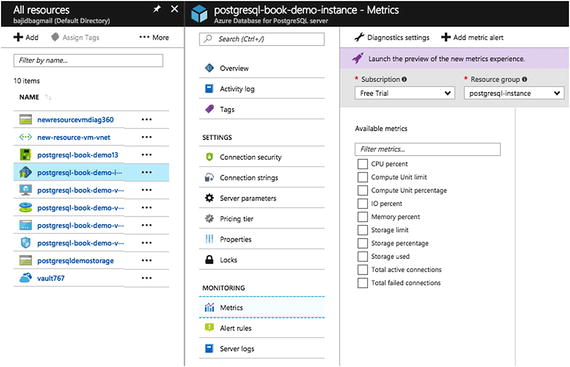 Figure 12-44
Viewing the OS metrics
- 2.You can also look at the Activity Log, where you’ll see Log Analytics and Operation Logs . See Figure 12-45.
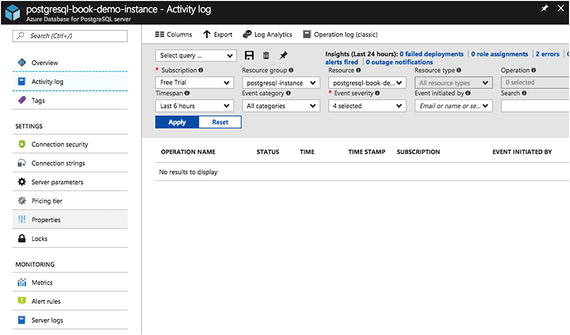 Figure 12-45
The Activity Log shows log analytics and operation logs
- 3.Check the PostgreSQL database logs from the Server Log option, as shown in Figure 12-46.
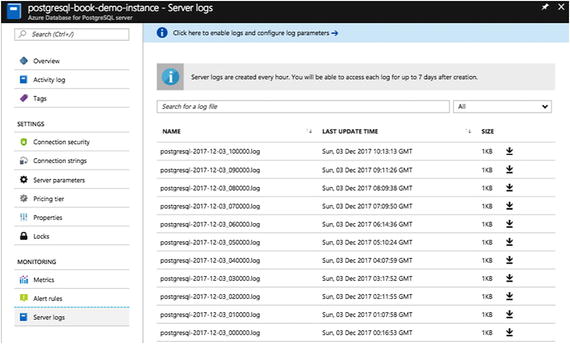 Figure 12-46
PostgreSQL database logs
Summary
This chapter covered why monitoring is needed and how it helps. It talked about the monitoring services available from each vendor by default and where to find monitoring for cloud solutions. We hope this chapter helps you understand monitoring your servers and databases on the cloud, regardless of the cloud vendor you’re using.