
Now that you have learned the basic building blocks for constructing a wireless sensor network with the Arduino and Raspberry Pi, you can turn your attention to some of the more intricate details of designing and implementing sensor networks. This chapter explores considerations for planning sensor networks, discusses some advanced sensor network topics, and offers tips for designing databases.
Sensor Networks Best Practices
Let’s begin with a discussion of some best practices1 you can employ to make your sensor network projects more successful. In this section, I discuss practices for planning data-aggregate nodes, designing databases, and a number of tips and techniques for building sensor networks.
Considerations for Data-Aggregate Nodes
This section examines some important considerations for planning data-aggregate nodes. I discuss placement of the nodes in the network as well as design considerations for data storage.
Network Type and Node Placement
An important consideration is the type of network connection available for the data-aggregate node. This may be dictated by the node’s use or physical placement.
If you plan to have a data-aggregate node that you want to have access to via your computer, you must consider placing that node where you can connect it to your Ethernet network. This may be via a wireless Ethernet (WiFi) connection or via a cabled connection.
On the other hand, if your data-aggregate node communicates with sensor nodes via XBee modules, the range of the modules may dictate where you place your data-aggregate node. For example, if your sensor nodes are located in outbuildings or in or near ponds that are some distance from a building with a network connection or even too far away for WiFi, you may not be able to connect to the node with your computer and therefore will have to periodically physically visit the node to retrieve the data.
That doesn’t mean you have to jump on your ATV or golf cart to run down to the old chicken house to get your data every night! In fact, there are alternatives you can and should consider. First, you can use intermediate XBee router nodes placed in series until you reach a location with a network connection where your data-aggregate node can be placed.
How does this work? It is one of the advantages of the ZigBee protocols—to create networks on the fly and relay information from one router to another to extend the maximum range. It comes as a consequence of using the API mode, but you can also control this easily with the AT mode and send your data to a specific router, which then sends the data to another (and another) until you reach your data-aggregate node.
Another possibility is to use a directional WiFi connection that focuses the WiFi signal using a line-of-sight, point-to-point connection. You don’t have to spend a fortune to do it! In fact, if you or someone you know likes Pringles, you can use a Pringles can to create a directional WiFi antenna (www.makeuseof.com/tag/how-to-make-a-wifi-antenna-out-of-a-pringles-can-nb/).
A more extreme solution involves using a cellular modem on the data-aggregate node to send data to another node via the Internet. Most cellular carriers frown on setting up web or database servers accessible from the Internet (some forbid it). Thus, you are limited to sending data from the data-aggregate node out of your home network to a web or database server. This option can incur recurring costs for the connection (you need a SIM card and a data plan from your carrier of choice).
Although there is no pluggable cellular solution for the Raspberry Pi, you can use a cellular module with it. Doing so requires more work and perhaps building more complex software but should be possible.

LTE CAT M1/NB-IoT Shield (courtesy of SparkFun)
If you find that none of these solutions will work because your sensor nodes and data-aggregate nodes are just too far away for any practical (and affordable) networking alternative, you may have to consider leaving those data-aggregate nodes as local storage nodes and collecting the data periodically to use in your analysis.
Storing Data
One major consideration for designing a data-aggregate node is the type of data it will store: that is, what sensors the node will support. It is typically better to use a data-aggregate node to store data for the same sensors or sensor nodes that generate the same type of data.
For example, if you are collecting temperature data from several locations as well as water levels from several ponds, the data produced by these two events differs. Temperature is normally a floating-point value; water level is most often a Boolean value (1 = water level ok, 0 = water level low), which corresponds to the most common form of measuring water level: a float and switch.4
Clearly, storing these two sets of sensor data together would require more work because you would be mixing different data types. This might require choices such as storing the data in different files or even in different databases. Furthermore, consuming the data and detecting what the data represents (the type of sensor) would require more logic, because you would need some way to detect what sensor node went with what data type.
Although the problem of storing water level and temperature may be easy to code around, consider storing samples from two sensors that produce the same data type but are interpreted differently. Recall the examples of reading barometric pressure. It too is represented as a floating-point number. For example, how would you know which sensor generated a value of 65.71929—the barometric or temperature sensor? It may be possible to write code specific to the sensor itself, but what if the sensor data is being relayed to another node? How then would you know how to interpret the data?
One solution to this problem is to use a different data-aggregate node for each group of like sensor nodes. In the example of using temperature and water-level sensor nodes, you would have one data aggregator for the temperature sensor nodes and another for the water-level sensors.
Storing Additional Data with the Sample
Notice in the listing that the data is formatted as a comma-separated-value (CSV) file. This is an implementation choice (you could have chosen to use tabs, semicolons, and so on) that makes reading the file easier on a computer. If you use Python, you can read the file using only a few library calls.
If you examine the data, you see that you have to know something about the sensor number to be able to interpret the data. If the sensor number is 1 or 2, you know it is temperature; but if it is 3 or 4, it is water level. Again, this may not be that big of an issue, but if you have a data-aggregate node receiving samples from dozens of sensors (or worse, from sensors that have been added to the network after the code was written for the data-aggregate node), you could end up with unknown values in the sensor number—that is, values you don’t know how to interpret because you don’t know what kind of sensor generated them. You can solve this by having a separate data-aggregate node for each type of sample (sensor).
Notice also how the data is arranged. Do you see anything that suggests conformity? If you have knowledge and experience with databases, no doubt you have already realized this, but consider for a moment what a table in a database is made of: rows and columns, where the columns are the fields and the rows are data. In this case, you can define two tables, each with four columns. The water temperature data could be in one table, because its value is an integer (or Boolean, perhaps), and the water temperature data is a floating-point number.
Clearly, storing this data in a database makes sense. That’s what databases are for—storing logically related groups of data for a single row (in this case, an event or a sample). With that in mind, let’s look at considerations for using databases to store sensor data.
Considerations for Sensor Network Databases
In-depth, full coverage of the topic of database design is well beyond the scope of this book. Indeed, entire tomes and even several sets of volumes have been written about database design. Rather than go into all the theory and then relate that to practice, let’s look at the subject from a slightly different angle: how you can best design your databases for easy storage and retrieval.
I assume no prior knowledge of database design. If you have database design experience, you may want to skim this section.
As you saw in Chapter 8, you use the MySQL database system as the database server. Not only is it open source (it is free, as in free beer), but it is also the most popular choice for developers because it offers large database system features in a lightweight form that can run on just about any consumer computer hardware. MySQL is also very easy to use, and its popularity has given rise to many online and printed resources for learning and using the system. Despite this, the following examples and suggestions can be used with any relational database server (but may require slight changes to syntax for some).
How Data Is Organized
Let’s begin by discussing how data is grouped in a database server. As you know, the server permits you to create any number of databases for storing data. Typically, you want to create a separate database for each of your sensor networks. This makes working with the data a logical whole so that data for one sensor network isn’t intermixed with data from another.
Notice the sample_collected_on field. You define this as timestamp, which MySQL will fill in with the date and time when a row is inserted in the table. Unless you need absolute accuracy, setting this value shortly after the sample is collected will suffice to record the date and time at which the sample was taken.
So, what have you done here? First, you designed two tables to store data from two different types of sensors (as defined by what data types are collected), and you added a lookup table to help eliminate duplicate data (storing Water Temp Pond 1 over and over again wastes space).
But what does this mean for the data-aggregate node? If you consider Listing 11-1 again, you see that the node has to write the sensor number, calculate and write the timestamp (perhaps from an onboard RTC or RTC module), write the value from the sensor, and (based on a lookup code) store a string for the comment (to make it easier for a human to read).
However, if you implement the previous tables, the data-aggregate node need only send the sensor number and the sample value to the database server. Sound familiar? That is exactly what you did in the project in Chapter 10.
Table Design Notes
Let’s return to designing tables. When you design your tables, you should keep a few things in mind. First, consider what data types are needed for storing your samples. You should consider not only how many values each sample contains but also their format (data type). The basic data types available include integer, float, double, character, and Boolean. There are many others, including several for dates and times as well as binary large objects (blobs) for storing large blocks of data (like images), large texts (the same as blobs, but not interpreted as binary), and much more. See the online MySQL reference manual for a complete list and discussion of all data types (https://dev.mysql.com/doc/refman/8.0/en/data-types.html).
You can also consider adding additional columns such as a timestamp field, the address of the sensor node, perhaps a reference voltage, and so on. Write all of these down, and consider the data type for each.
Once you have decided on your table columns, the next thing you should consider is whether to allow duplicates in the table—that is, two or more rows that contain the same data. To avoid this, you can define a primary key (a special index) by specifying one or more columns as the key. You want to choose a column (or columns) that ensures that no two rows will have the same data for that column(s).
For example, if you choose sensor_number from the previous example as a primary key, you most certainly have a problem. Indeed, the database server will complain the instant you try to save a second value for each sensor. Why? Because to become the primary key, the sensor_number column must contain a unique value for every row in the table!
But the layout of the tables does not contain any column that is guaranteed to be unique. You may be thinking the timestamp field can be unique, but although that may be true, you typically do not use timestamp fields for the primary key. So, what do you do in this case?
Here you add a new column named id that is an auto-incrementing field and is the primary key. You add the first modifier because primary key columns should be the first column in a table (not that order matters normally, but here it does).
Auto-Increment Fields
You may be thinking that this new field adds an artificial primary key to the table and doesn’t really do anything. For the most part, you are correct.
This example is for illustration purposes and therefore teaches the concept of using a primary key as a practice you should consider whenever you design a table. The fact that the auto-increment key isn’t used to reference another table or that it relates to the rows themselves is overlooked for the sake of practice.
Let’s return to the lookup table. Although this table is unlikely to have many rows (it depends on the number of sensors), it is also true that one row in this table matches one and only one sensor. So, you can use the sensor_number column here as a primary key. I leave the ALTER TABLE statement for you to consider.
Database designers sometimes forego the use of primary keys on tables with only a few rows, citing the additional overhead needed to maintain indexes and so on. The truth is it matters little either way because lookup tables are seldom modified (changed or data added) and if used frequently can result in the table being cached in its entirety. That being said, it does no harm to add a primary key.
Adding Indexes for Query Efficiency
A primary key is a special type of index. It is an index, but when used with auto-increment fields, it is a nice way of identifying a given row and allowing duplicate rows (among the other columns). However, there is another aspect of indexes that can make your data access much easier (and possibly faster).
Because the table has an index (the primary key on the column id that you added), it uses this to systematically read each and every row in order, choosing (returning) those rows that match the WHERE clause (in this case, sensor_number = 2). This is bad because the server does not know if these rows appear in the first N rows or even if sensor_number = 2 is in the last row in the table. Thus, it must read each and every row. This is called a table scan and is best avoided when working with tables with a lot of rows.
The CREATE INDEX command allows you to name the index (s_num) and specify the table (ON pond_water_temp) and the column(s) you want to index in parentheses, (sensor_number). You can see a complete syntax explanation for this and all other commands supported by MySQL in the online MySQL reference manual.
Now when you issue the earlier SELECT, the server uses the new index to read the rows in a different order. Note that the rows are not reordered on disk; rather, the index creates an alternate map or access method to find the rows in a specific order.
Notice that the auto-increment column is defined first, then your sensor number, the timestamp for when the sample was collected, the value (temperature), and the primary key and secondary index definitions. This statement replaces the three you just used—CREATE TABLE, ALTER TABLE, and CREATE INDEX. Cool, eh?
As you can see, creating tables in MySQL is easy once you understand the syntax (and know what you want to do). You can find all the syntax and many examples of each in the online MySQL reference manual (https://dev.mysql.com/doc/refman/8.0/en/sql-statements.html).
Once again, there is far more to consider for designing tables, but these at least are the things you need to know to make the most of your database system and to store and retrieve your data effectively.
Other Considerations
This section explores some additional best practices that can be helpful in making your work with sensor networks more enjoyable.
Stay Within Range of XBee Modules
Indoor/urban: Up to 133 feet
Outdoor line of sight: Up to 400 feet
However, these maximums are very much influenced by interference from devices on similar frequencies and the composition of the building you are in.6 For example, suppose your house is very old and has plaster walls and a tin roof. Wireless of any kind in your home operates well below the specified ranges. You need to test your XBee range in your own location to find your maximum range. If that is impractical, I recommend that you cut the specification values in half when planning your network to ensure that you don’t place XBee-based sensor nodes out of range.
- 1.
Connect the coordinator node to the laptop.
- 2.
Connect to the coordinator via XCTU.
- 3.
Place the sensor node in its intended location.
- 4.
Hold your laptop near the sensor node (within a few feet), and power on the sensor node.
- 5.
Wait until the XBee network is formed and you start receiving data.
- 6.
Move slowly away, watching the data as the coordinator receives it.
- 7.
When the coordinator starts presenting error packets or stops receiving data, you’ve gone too far.
This method is hardly scientific, but it can give you a rough gauge as to whether your sensor nodes are close enough (within range) to your data-aggregate node.
Keep an Engineering Logbook
Many developers, engineers, and scientists keep notes about their projects in paper notebooks or digital notebooks using apps like Evernote (http://evernote.com/). A voice recorder can also be handy in catching those impromptu ideas when you don’t have time or it is too dangerous to use pen and paper.7 Some people are more detailed than others, but most take notes during meetings and phone conversations, thereby providing a written record of verbal communications.
The best notetakers write down their ideas when they occur. Sometimes the mind works best when you are performing menial tasks and ideas come to you out of the blue. When this occurs, good engineers know to write down these ideas—even if they later turn to so much dirt—because the best ideas often start with a simple concept. Failure to write down these tidbits can often lead to more experimentation and even wasted time working on alternatives.
If you aren’t in the habit of keeping an engineering logbook, you should consider doing so. I have found a logbook to be a vital tool in my work. Yes, it does require more effort to write things down, and the log can get messy if you try to include all the various drawings and emails you find important (my notebooks are often bulging with clippings from important documents taped in place like some sort of engineer’s scrapbook). The payoff is potentially huge, however.
This is especially true when designing sensor networks and the myriad of sensors and electronic circuits involved. You may be at a trade show (or a Maker Faire) and see something that really sparks an idea. Or maybe you see a circuit in a magazine or find a really cool sensor but need to design a circuit to host it. Writing down these ideas can enable you to achieve your goals.
It also helps you to remember concepts and critical information such as which way a sensor is wired, to avoid rework (or guesswork) that could lead to failed components and frustration. I am very thankful I keep a logbook of those times when I double-check my wiring, only to discover a misplaced jumper or wire routing. It has saved me time and money (not having to replace fried components).
Naturally, you can use any type of notebook you desire; but if you want to class up your notes a bit, you can purchase a notebook made especially for keeping engineering notes. These typically have subdued gridlines and sometimes text areas for recording key information like the project name and page number. One of my favorite notebooks is the Maker’s Notebook from Maker Shed (www.makershed.com/products/makers-notebook-hard-bound).
This notebook features 150 numbered pages of graph paper, each with a special header for noting the project name, date, and page reference pointers. It also includes such nice additions as a space for a table of contents, a pocket for those small notes you write to yourself but later cannot read due to your own handwriting,8 and stickers with electronic components for making circuits. This notebook is a bit more expensive than a run-of-the-mill lined or grid-filled notebook, but it is worth a look if you desire a good tool to help manage notes for multiple projects.
One of the challenges of keeping a single notebook for multiple projects underway is how to manage pages. That is, if you are working on project X and write down some really cool ideas in the middle of working on project Y, how do you keep track of what pages belong to each project?
The Maker’s Notebook solves this by allowing you room to note which page number is next at the bottom of each page. This can be really helpful when your project notes start to interleave (and they will). Think of it as a sort of manual linked list.
Another solution is to keep a living index at the front of your notebook that lists the page numbers for each project. This is not as nice as the Maker Shed solution, but it works.
Putting It All Together: Testing and Deploying Your Sensor Network
The projects in this book are designed to teach you how to build sensor networks by breaking the tasks into smaller components that you can combine. With the exception of the projects in Chapter 10 (they are complete sensor network examples), you can implement each in relative isolation from the other projects. Some are alternative implementations, like the examples that show the same project first using an Arduino and then using a Raspberry Pi.
In some cases, especially in the “For More Fun” sections, I’ve suggested certain modifications and alternative solutions for you to experiment with. Experimentation is an excellent way to learn, but you should consider moving to a more formal evaluation of the solution when preparing your own sensor network.
In other words, test your network before deploying it. I cannot tell you how many times a well-planned hardware design has failed due to some unexpected consequence unrelated to the design. For example, you may find a physical obstruction that wasn’t there or wasn’t considered when you planned your network; or the cabling available or power in the area may be faulty; or you may find that the actual range of your radios in the target environment is shorter than anticipated. Whatever the case, usually bench-testing the solution prior to deploying it can help eliminate problems with the nodes themselves, allowing you to focus on what is different—the physical environment.
What I mean by bench-testing is to assemble the components in one location and power everything on as if it were deployed in the field. Not only does this allow you to ensure that the sensor network is working, but it also permits you to monitor the nodes themselves for anomalies. For example, incorrectly wiring a component may destroy it, but sometimes you can salvage the component by cutting power quickly.
- 1.
Starting with the database node, power it on and test connectivity from your network. Ensure that you can connect to MySQL as the user account you plan to use (and from the machines—IP addresses—that will need to access it) and that the user has privileges to update the databases you’ve designed. For more information about granting privileges to users, see the online MySQL reference manual.
- 2.
Move to the data-aggregate node, and modify the sketch to insert dummy data into the database. Go back to the database, and ensure that the data has been inserted.
- 3.
Power down your data-aggregate node, and move the coordinator XBee module to a USB XBee adapter. Connect it to your laptop, open a terminal application, and connect to the USB port with the XBee module.
- 4.
Power on each of your sensor nodes, one at a time, and observe the terminal window. Ensure that each of the sensor nodes sends data and that the data is received (echoed in the terminal). Power down all XBee nodes, and remove the coordinator node from your laptop.
- 5.
Return the data-aggregate node to its operational state (including running the final sketch or script), and power it up. Wait about 5 minutes, and then power on your sensor nodes. Connect to your database server, and ensure that data is being inserted into the table.
Once you have your sensor network assembled and running correctly, you can begin considering deployment. I prefer to deploy the sensor nodes first and (if possible) move my data-aggregate node and database server closer to the sensor nodes. I then power everything on, starting with the database server and then the data-aggregate node; then I wait 5 minutes and power on the sensor nodes.
Moving the data-aggregate node close to the actual location of the sensor nodes helps minimize any issues with ranges or obstructions. When I see that the network is operating correctly, I power everything off and deploy my data-aggregate node to its proper location and start the process again. Once that stage works, I deploy the database server and test the network one more time. When everything is working correctly, I power it all down again, erase the data (use DELETE SQL statement) the sample data, and power everything up. At this point, my deployment is complete, and I can work on the next stage: consuming the accumulated data for analysis.
With these best practices and considerations in mind, let’s look at a topic that can sometimes lead to impromptu tinkering.9
The projects in this chapter are intended for demonstration purposes and therefore do not include all the steps for building each project. However, given your knowledge level at this point, you can easily fill in the missing parts.
Choosing Sensor Nodes
When you consider how to host a sensor, you have some choices to make. Sometimes this decision is based on the type of sensor and the data it produces. For example, you can host almost any sensor with an Arduino. With some additional hardware, you can do so with the Raspberry Pi; and you can also host certain sensors with XBee modules (see Chapter 2).
But other things can determine the configuration of your sensor nodes and your data-aggregate nodes. These include the type of networking to use and whether the sensor node will use Ethernet or XBee (ZigBee) to communicate. There are also a number of alternative configurations for your sensor nodes that you have not explored thus far. I discuss each of these aspects in more detail in this section.
Wired or Wireless?
I mentioned in Chapter 10 that I consider a wired Ethernet connection a requirement for a data-aggregate node. But that is just the most typical case. It may be that you have WiFi Ethernet instead.
The main reason is that the data-aggregate node is typically accessed much more frequently than the sensor nodes. You may include data-aggregate nodes that have web servers, as you saw in Chapter 10, or you may decide to have the data-aggregate nodes send the data to another node (such as a database) for storage. In these cases, having a fast and reliable network is a must.
Typically, you use XBee modules and the ZigBee protocols to connect a data-aggregate node to sensor nodes. However, you can use the API protocols in ZigBee to communicate with your data-aggregate nodes. The challenge is to build a set of routines to match how you intend to interact with the data-aggregate nodes. It is not impossible (and I have seen proof of people who have designed such networks), but it takes a lot more work and eliminates a number of possibilities for data access.
The main consideration is to place your data-aggregate nodes on the most reliable network medium. Wired Ethernet is the most robust, followed by WiFi and then ZigBee. If the data will be stored locally and retrieved manually, then the choice of network medium may not matter. However, if you need to access the data remotely or store it on a remote node (such as a database server), then wired Ethernet is definitely the right choice.
Arduino or Raspberry Pi?
Choosing an Arduino or a Raspberry Pi should be based on a number of factors. These include cost, security, functionality, expandability, and connectivity. Your choice will likely be based on one or more of these and may dictate (or limit) your implementation of your sensor or data-aggregate node.
Cost
If you are planning a large network or have a limited budget, cost may be a primary concern. This is likely to be seen in the per-node cost. Sensors are typically commodities, and the prices normally don’t vary much from one vendor to another. But the price of the host itself may make a difference. Let’s look at each board with cost in mind.
The current average cost of the Raspberry Pi 3B (in the United States) is about $40. This is about $5.00 more than the MSRP should be for these boards, but given the high demand and somewhat limited supply, it is no surprise vendors are charging more.
The cost for an Arduino is a bit harder to pin down. Because the Raspberry Pi is closed source whereas the Arduino is open source, you can find a lot of different vendors selling a variety of Arduino-compatible boards. Although you can buy a Raspberry Pi from different vendors, there are no Raspberry Pi clones. As a consequence, you can find any number of varieties of Arduino-compatible boards starting from as low as $15.00. Currently, the average price (on eBay and Amazon) for an Uno or Leonardo clone is about $20.00.
If you are planning 20 sensor nodes (and none are XBee-based), your cost savings through choosing an Arduino over a Raspberry Pi could be significant. For example, if you find Raspberry Pi boards for $40.00 each and Arduino-compatible boards for $20.00 each, it will cost you $400.00 more to use Raspberry Pi boards than Arduino boards.
However, if you must augment your Arduino boards with shields, the cost of the shield could bring your total outlay much closer to the cost of the Raspberry Pi (unless you buy the Uno WiFi version). In some cases, it could even cost more to buy an Arduino and a shield than a Raspberry Pi. On the whole, the takeaway is that if cost is an issue, the Arduino is often the less expensive choice.
Security
I have not said much about security or securing your sensor and data-aggregate nodes in this book. Let’s take a moment to briefly consider this topic.
We generally can agree that a database node should be secure with a modicum of password security and access restrictions,10 what about the sensor nodes themselves? Theft may be less of a concern, but you should at least consider securing your sensor nodes against theft. The average thief looking for a target of opportunity is not likely to steal your sensor node.11
However, physical access to the nodes is a concern. Although it is possible for someone to exploit an Arduino node if they have direct access, it is much harder to do so with an Arduino than a Raspberry Pi. The primary reason is that the Arduino is loaded electronically; someone could reprogram the microcontroller, but there is little they can do without knowing how the sketch was written. But all that is needed to exploit a Raspberry Pi node is an SD card with a fresh OS loaded.12 Thus, you should consider making it as difficult as possible for someone to get physical access to your Raspberry Pi nodes—especially if they are connected to your local network or the Internet.
Sadly , there is another concern—electronic intrusion. Because the Arduino is a microcontroller, it is not likely that someone will attempt to connect to it for nefarious activities. There is a much greater likelihood that someone will attempt to exploit a Raspberry Pi node. This means you have to be more careful when deploying Raspberry Pi–based nodes. Basic security practices go a long way, but if you don’t take care and plan against intrusion, your Raspberry Pi nodes could be vulnerable.
If you are concerned about the security of your nodes, you should consider reading more about sensor network security. However, the bottom line here is that Raspberry Pi nodes tend to be easier to exploit than Arduino nodes.
Functionality
The functionality provided by the host is another area where you may want to focus. If you are looking to add functionality, such as a web server, a local database server, or remote access via SSH, or connectivity to peripherals such as hard disks, keyboard, display, and so on, there is really no choice. The Raspberry Pi is a fully functional personal computer (and mini server).
On the other hand, the Arduino is very easy to program and has a much wider hardware support base, making it possible to host a much wider array of sensor options and even electronic circuits. This is because the Arduino has a more robust hardware interface than the GPIO of the Raspberry Pi.
For example, consider that the Raspberry Pi requires an ADC to interface with analog sensors. Thus, if you plan to use only analog sensors but still need the features of the Raspberry Pi, the cost of your sensor will be a bit higher (for the price of the ADC module).
The decision rests on whether you need computer-like features or better hardware support options. If you require personal computer or server features for your node, you should choose a Raspberry Pi. If you need to support a more diverse set of sensors and related hardware, you should choose the Arduino.
Expandability
Expandability (can also be called scalability) is closely related to functionality. I focus on this as a separate consideration because it has a bearing on sensor networks. There are two aspects of expandability that you should consider: the availability of pluggable modules and the ability to add more features to the node.
The clear winner in the availability of pluggable modules is the Arduino. There are dozens of shields that support all manner of hardware features. From simple sensor boards to XBee hosting to advanced motor control and robotics, there is a shield for just about anything you want to do for a sensor network.
That doesn’t mean you should count the Raspberry Pi out. If you need to store a lot of data on a node, you are less likely to choose the Arduino because it is very easy to add a local hard disk to the Raspberry Pi. Similarly, if you need complex display capabilities, the Raspberry Pi requires no additional hardware (just use a monitor).
You can indeed use small to medium-sized LCD panels on the Arduino. There are many examples, including example sketches, in the Arduino IDE. However, it is a lot easier to write a Python script to produce screen output than it is to try to cram a lot of information on a small LCD.
Thus, if you need expandability from an electronics perspective, you should choose the Arduino. If you need more expandability for attaching storage devices or displaying a lot of data, you should choose the Raspberry Pi.
Connectivity
The last area to consider is connectivity. Once again, this depends on your perspective. If you want to connect your node to other nodes via XBee modules, the platforms are equally capable.
If you plan to connect your node to an Ethernet network, you must consider the fact that the Raspberry Pi 3B, 3B+, and 4B comes Internet-ready with a LAN port (Ethernet) as well as WiFi, whereas the Arduino (excluding the Yun and Arduino Uno Ethernet variant) requires an Ethernet or WiFi shield; therefore, the cost may be much closer. For example, you can purchase a basic Arduino Ethernet clone shield for about $30.00. Given that the Arduino costs about $20.00 for an older clone board, your cost has exceeded that of the Raspberry Pi.
However, the Arduino currently has one advantage over the Raspberry Pi for when it comes to connectivity: it is much easier to interface specialized hardware. Recall the discussion earlier on the use of cellular modems to connect your nodes to the Internet for collecting data. Because there is no pluggable solution for the Raspberry Pi, the Arduino is the better choice in this case. This may also apply to other forms of connectivity provided by the use of specialized shields.
Thus, the consideration of connectivity for Ethernet and Bluetooth gives the advantage to the Raspberry Pi, whereas specialized communication such as a cellular modem gives the advantage to the Arduino.
There may be cases where you want to have the power of a Raspberry Pi but the flexibility and expandability of an Arduino. I’ll reveal one such solution in the next section.
Now that you have seen some considerations for choosing what host to use, let’s look at a couple of alternative solutions that you may want to consider—starting with a purpose-built sensor node.
Alternative Hosts
This section considers two alternatives for basing your sensor and data-aggregate nodes. You see an Arduino-compatible board designed expressly for sensor networks and outdoor operation as well as a daughter board designed to create a hybrid node combining a Raspberry Pi with an Arduino.
Seeed Studio Wireless Sensor Kit
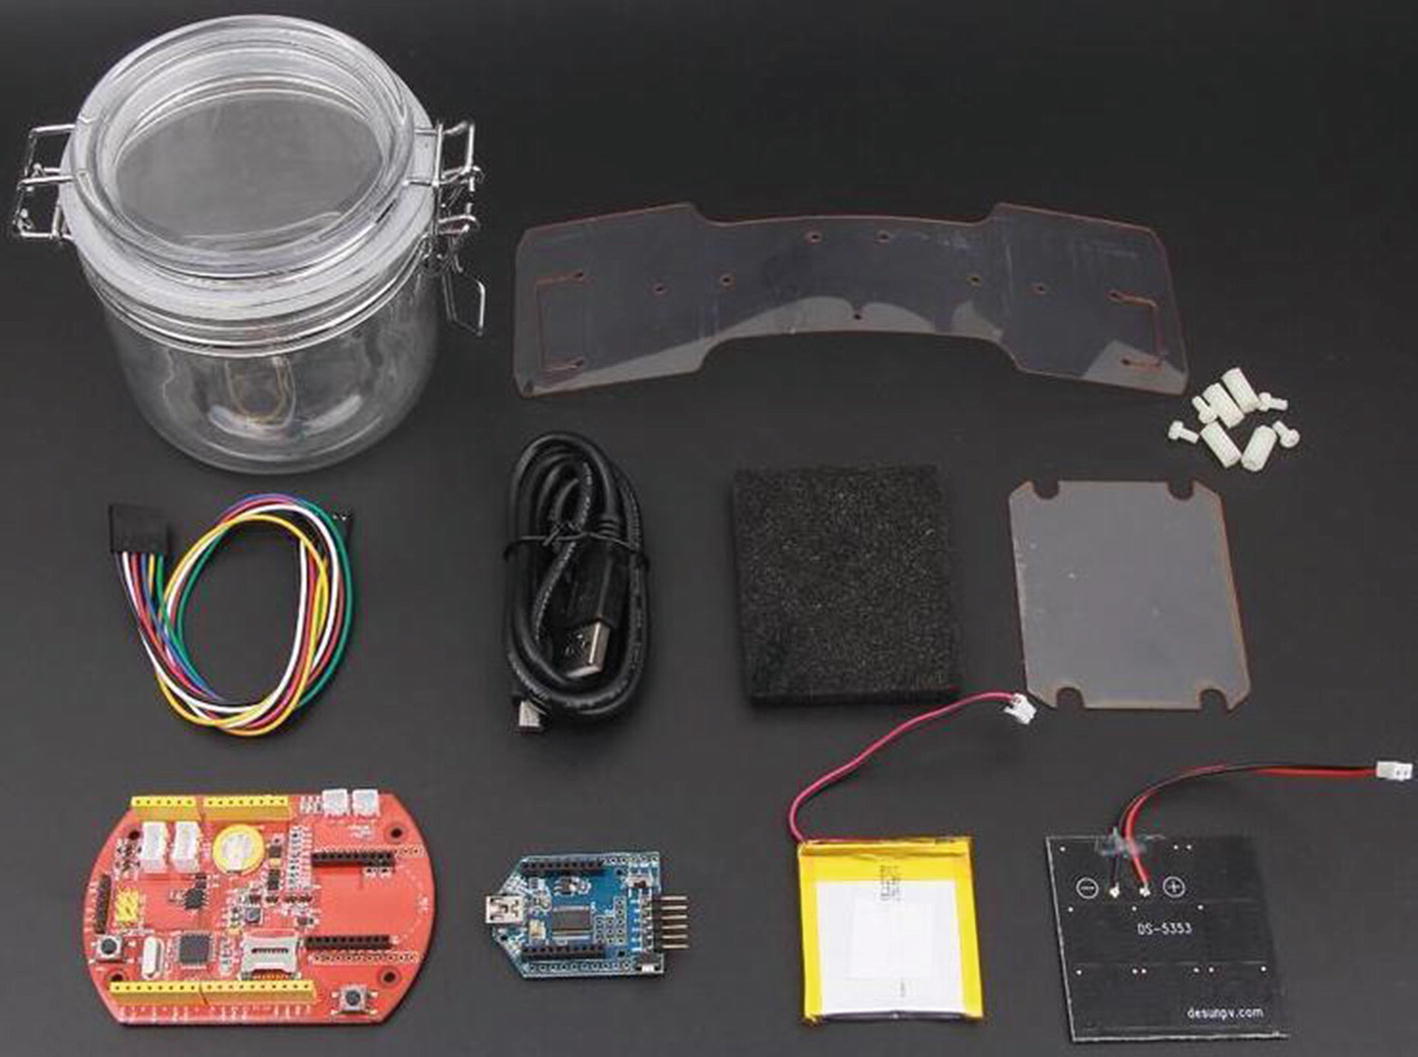
Seeed Studio Stalker wireless sensor node (courtesy of Seeed Studio)

Seeeduino Stalker Arduino-compatible board (courtesy of Seeed Studio)
The Stalker is marketed as a wireless sensor node based on its onboard XBee support. You may be wondering why I have left the discussion of this board to the end of the book. Simply put, the Stalker is a specialized board that requires building your sensor nodes with very specific hardware and software. Although it can indeed make building sensor networks easier by taking away a lot of the harder work of connecting modules and interfacing with them, this very nature makes it less valuable for learning how sensor nodes are built.
It is better to learn the basic building blocks of putting together sensor nodes so that when you begin working with more advanced sensor networks or incorporating advanced sensors into your sensor nodes, you have the proper experience and knowledge to use them. Besides, it is a lot more fun to build something from scratch.13
However, if the features of the board are what you need, then you should consider using as many of these as you require. The cost is a bit higher, as you can imagine. The cost of the kit is about $59.50, and the board itself is $39.00. If you consider that the board has an RTC as well as XBee headers, the $39.00 cost is less than buying an Arduino, separate XBee shield, and RTC module combined.
All the onboard features can be used in your sketches. For example, you can read temperature from the onboard RTC (the DS3231 chip has a temperature sensor) using only a single method call. To get this functionality, you must download and install the DS3231 library from https://jeelabs.org/pub/docs/rtclib/.
The DS3231 library and the Stalker make building and deploying a temperature sensor node very easy. All you need to do is add the XBee code you’ve explored in previous projects, and you can quickly build a solar-powered wireless temperature sensor node. Cool.
You can find a lot more information about programming the Seeed Studio Stalker on the company wiki for this board (http://wiki.seeedstudio.com/Seeeduino_Stalker_V3.1/).
Getting back to the solar part of the kit, the Stalker has a lithium polymer (LiPo) battery-charging circuit designed specifically for attaching a solar panel and a LiPo battery. The solar panel charges the battery during the day, providing adequate power for the node to run overnight (assuming your XBee is utilizing sleep mode and you don’t have a lot of circuitry drawing power). This means you can build this kit and use it outdoors to communicate sensor data to your sensor network without worry of providing power or network connections. If you have a property with outbuildings without power (or ponds), this kit has the features you need to install a remote sensor.
The thing I like most about the Seeed Studio Stalker is that it is a fully compatible Arduino clone. If you do not use the Stalker in its waterproof case, you can use it in place of one of your Arduino nodes (because it is an Arduino). With the onboard RTC, XBee headers, and microSD card drive, you may even be able to use this board for all of your sensor nodes—data aggregators included.
If you are planning a home temperature-monitoring sensor network, you should consider using this board for your remote sensors at the least. However, considering all the goodies you get in the wireless sensor kit, it is an excellent value.
Raspberry Pi Alamode
Another variant you may want to consider is the Raspberry Pi Alamode. This board is a very special piece of hardware designed to bridge the gap between the Arduino and the Raspberry Pi. While originally developed for earlier versions of the Raspberry Pi, the Alamode is a daughter board for the Raspberry Pi that plugs into the GPIO header and features a fully compatible Arduino clone.
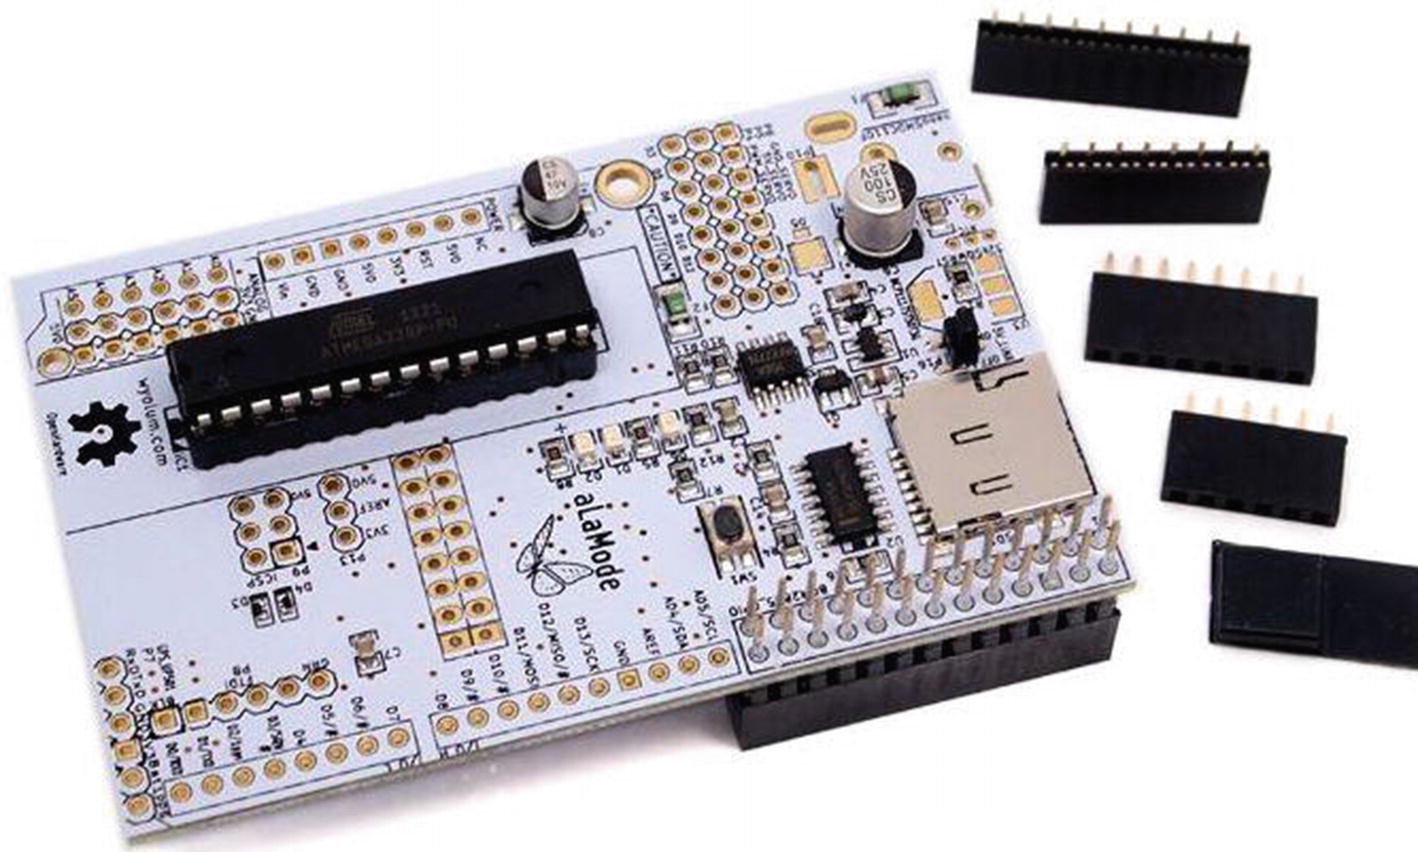
Raspberry Pi Alamode (courtesy of Seeed Studio)
Arduino compatible
Connects to the Raspberry Pi via the GPIO header
Automatically controls voltage on the GPIO header, providing 3.3V safe voltage on the GPIO but powering the Alamode with 5V
Has a separate micro-USB port for powering the Alamode
Supports headers for controlling servos
MicroSD drive
Onboard RTC that can be used by the Raspberry Pi
Supports additional headers for FTDI, ICSP, and a GPS module
The Alamode represents a unique hardware solution for sensor nodes. It permits you to use the best of both platforms on a single node. Let’s say you need to use a special component or feature that is only available for the Arduino, but you also need computer resources such as a full-featured web server and lots of storage for your data-aggregate node. To solve this problem, you must find a way to connect the Arduino to your Raspberry Pi. The Alamode is that bridge. You can write sketches for the Alamode (even directly from the Raspberry Pi!) that provide the data from whatever shield, sensor, or other hardware you connect to the Alamode Arduino headers.
For example, you can access the RTC on the Alamode from the Raspberry Pi. To do this, you must have the I2C drivers on the Raspberry Pi. Fortunately, you achieved this earlier in the book. The setup is not overly complicated and involves adding a new module to the Raspberry Pi so that it can get its date and time from the RTC on the Alamode via the I2C interface. In fact, you access it as you would any I2C RTC module. A complete walk-through of accessing an RTC via I2C is available from Adafruit (http://learn.adafruit.com/adding-a-real-time-clock-to-raspberry-pi).
Once you complete these steps and restart the IDE, you see the Alamode listed under the Board submenu. To set up the Alamode, select it from this menu and then select the /dev/ttyS0 serial port.
A complete walk-through of getting started with the Alamode can be found at http://wyolum.com/projects/alamode/alamode-getting-started/.
Communication between the Alamode and the Raspberry Pi can be accomplished using the Firmata library, which is built into the Arduino IDE. Fortunately, there are a number of examples you can explore in the Arduino IDE. There are also walk-throughs on the Alamode wiki (http://wyolum.com/projects/alamode/).
The Raspberry Pi Alamode is still a very new product and as yet has not been used (or at least reported or documented) enough to realize its full potential. However, I believe that if you need a special piece of hardware that is available for the Arduino, but you need to use it directly on a Raspberry Pi (like that cellular shield), this product may provide an excellent solution.
Project: Home Temperature-Monitoring Network
This chapter would not seem complete if I didn’t have a project to discuss. By this point, though, you have all the knowledge you need to build sensor networks using Arduino boards, Raspberry Pi computers, and even dedicated XBee sensor nodes. Thus, rather than provide yet another step-by-step example, this section presents a walk-through of the planning stages of creating a home temperature-monitoring network.
This project will seem a lot like the projects from Chapter 10. That is intentional. Everything you need to build this network was demonstrated in that project. What I am discussing here are the considerations for actually designing and deploying such a sensor network. The intent of the project is to provide one possible practical example for how to get started planning and implementing a sensor network.
Planning Considerations
The first question you need to ask when planning a sensor network is “Why?” The second question is “What do I expect to get from the data?” The reasons for creating a home temperature network are many and varied, but generally you expect to be able to track the ambient temperature of the home so that you can either plan changes to the heating and cooling systems or verify that they are working correctly (the thermostat settings match the actual temperatures measured).
As for why you would create the network, consider cases where the house is large, has several heating and air conditioning systems (HVAC), or was expanded over time to include rooms that are isolated or poorly supported by different HVAC systems. Or perhaps you have more personal reasons like differing opinions of hot/cold among family members or the need to protect sensitive medical equipment. Whatever the reasons, they should be considered a design element.
For this example, suppose the reason is that your home has multiple HVAC systems and has been expanded over the years in such a way that some rooms are noticeably warmer or cooler during different seasons of the year. In this case, you want to be able to predict the effects of outside climate (temperature) on the inside of the home.
Planning the Nodes
The next thing you should do is evaluate the resources available for a sensor network. Let’s assume the home has two floors and only the first floor and one room on the second floor are wired for Ethernet, but there is a wireless Ethernet router (wireless access port) that can be accessed from anywhere in the home. There are four bedrooms, a den, a kitchen, a formal dining room, three bathrooms, and a sunroom (enclosed porch). The construction of the home limits radio signals to no more than 30–40 feet.
These criteria mean you must design the sensor network following a specific model. Namely, you need to collect data over time from multiple sensors. You could use as many as 12 (11 inside and 1 outside), but let’s say you identify 5 zones in the home representing key areas where the temperature can differ from the rest of the home.
If you take sensor samples six times every 24 hours, you will be storing 36 samples per day (6 per sensor), more than 256 per week, and more than 91,000 per year. If you are measuring temperature, this could result in as much as a few megabytes of data per year. Although this isn’t too much data to store on an SD card, if you want to compute averages over time compared to an outside variable (the outside climate), you must read the data and calculate the comparisons at some point (perhaps several times a month). Thus, you would be better suited to use a database server to store the data. Also, because you want to know when each sample was taken, you need to design the database table to store a timestamp for each sample.
If you consider the radio limitations of the home and the fact that it has multiple floors and a number of rooms, you can expect to require at least one data-aggregate node that is centrally located in the home. However, it is possible you could need more, depending on the placement of the sensors and the effects of the limited range.
For this project, assume that a centrally located data-aggregate node will suffice. In addition, you decide the data-aggregate nodes will connect to the database node via Ethernet, but the sensor nodes will communicate with the data-aggregate node using XBee modules.
You will implement the five internal sensor nodes using XBee modules (to which you can connect the TMP36 directly), but for the outside node, you will use the Seeed Studio Wireless Sensor Kit discussed earlier.
As for powering the nodes, you can use common 5V–9V wall wart power supplies for all sensor nodes. Also assume that the peripherals for the Raspberry Pi database node are gathered from on-hand surplus components.
Cost Considerations
Finally, you want to limit the cost of the network as much as possible. You also want to keep the samples relative in scale. The best way to do this is to use the same temperature sensor for each node. The most cost-effective solution is to use a sensor like the TMP36.
Sample Shopping List for the Home Temperature Sensor Network
Description | Qty | Cost USD | Ext. Cost USD |
|---|---|---|---|
Raspberry Pi (database server) | 1 | $35.00 | $35.00 |
TMP36 sensors with resistor | 6 | $1.50 | $9.00 |
Seeed Studio Wireless Sensor Kit | 1 | $59.50 | $59.50 |
XBee-ZB (ZB) Series 2 or 2.5 | 7 | $25.00 | $175.00 |
Arduino-compatible boards | 1 | $21.00 | $21.00 |
Power adapters (1 for each node) | 8 | $6.95 | $55.60 |
Ethernet shields | 1 | $45.00 | $45.00 |
Arduino XBee shield | 1 | $24.95 | $24.95 |
Total | $425.10 |
I leave out some of the finer details for brevity, but the more costly items are listed. That is, I omit the cost of breadboards, cases, and so on for the sensor nodes because these are only one way to implement the circuitry. You could just as easily build a circuit on a preprinted circuit prototyping board and place each in a small enclosure (bits like this are called vitamins in the 3D printing world—an appropriate description I think).

Prototyping circuit board (courtesy of SparkFun)

Big Red Box enclosure (courtesy of SparkFun)
What About Implementation?
Recall that at the start of this project, I said you have all the knowledge you need to implement this project. If you consider the nodes you need, you can find examples of how to build each one in previous chapters. The database node is found in Chapter 8, the Arduino data-aggregate node is also in Chapter 10, the XBee sensor nodes are in Chapters 3 and 4, and an example of the outdoor sensor node is included in this chapter (the Seeed Studio Wireless Sensor Kit).
I therefore leave the implementation to you; you can study those examples and implement them. Fortunately, little or no modification should be necessary. Other than perhaps substituting prototype circuit boards for the breadboards and sturdy enclosures for all the nodes, your implementation should be the same as the examples.
Conclusion
Once you have purchased all the components and assembled the sensor nodes in their final form, you can bench-test the entire network and then deploy the sensor nodes, testing for reliable connections between the sensor nodes and the data-aggregate node. Once all this checks out, you secure the sensor nodes in their locations, the data-aggregate node is installed in the central location, and the database node is installed in a secure area.
Returning to what you expect to get from the network, after it has run for some time—a week perhaps—without errors or problems, you can start issuing queries on the database to check for differences observed between the outside sensor values and the indoor sensor values. Once you have several months’ worth of data, you can start to consider grouping the data by season (through a selection on the timestamp column).
I hope this example has reinforced the material in the book as way to validate your efforts in constructing all the projects and experimenting with them. I am fully confident that doing so will mean, should you follow this example to form a similar network, you succeed handily.
For More Fun
The total cost of these components is approximately $425.00, not including miscellaneous vitamins and shipping costs. This may sound like a lot, but consider substituting other components such as using fewer XBee sensor nodes and more Arduino sensor nodes with WiFi shields or the use of a Raspberry Pi for the data-aggregate node.
Optional Component Shopping List
Optional Components
Item | Vendors | Est. Cost USD |
|---|---|---|
Seeed Studio Stalker Wireless Sensor Kit | http://wiki.seeedstudio.com/Seeeduino_Stalker_V3-Waterproof_Solar_Kit/ | $59.50 |
Seeed Studio Stalker Board | $39.00 | |
Raspberry Pi Alamode | www.seeedstudio.com/Alamode-Arduino-Compatible-Raspberry-Pi-Plate-p-1285.html | $35.00 |
LTE CAT M1/NB-IoT Shield | $79.95 | |
Perma-Proto Boards | $2.50 and up | |
Enclosure | $8.95 |
Summary
This chapter explored some of the nuances of designing and implementing wireless sensor networks. I discussed some of the more popular best practices for sensor networks, considerations for planning databases to store the sensor data, how best to retrieve and use the data from a database, and how to choose what type of host to use for each sensor node. You also explored the design of a whole home temperature-monitoring system with special considerations for selecting hardware for the sensors.
Now that you have a basic (and some more advanced) understanding of wireless sensor networks, you can put down this book in triumph and start thinking of some really cool ways you can implement what you have learned. Perhaps you want to monitor the temperature in your house, workshop, or garage. Or perhaps you want to design a more complex network that monitors sound, movement, and ambient temperature changes (like a home security system).
An even more ambitious project would be to build your own weather station from discrete components, with a sensor node for each data sample (wind speed, temperature, gas readings, rain gauge, and so on). All that and more is possible with what you have learned in this book. Good luck, and happy sensor networks!