
WHAT YOU WILL LEARN IN THIS CHAPTER:
The different types of business intelligence tool sets available in SharePoint
Work with the out-of-the-box business insight features to configure charts, graphs, and spreadsheets
Use Visio to publish content to a Visio Services web part
Business intelligence (BI) and insights are the ways that you can help provide tools that bring information directly to the users through a single interface. There are several different concepts that you will dig into throughout this chapter. We will look at how to get started and how to start bringing immediate value to the organization. In case you are just getting started with business intelligence, we will also look at ways to progressively incorporate these features into your organization. Once you have completed this chapter, you should have a good handle on the following topics:
Defining business intelligence
Working with Excel Services
Using the Chart web part
Working with Visio Services
Working with KPI features
Understanding PerformancePoint features
The first step to getting started with business insights is understanding what they are and how you are planning to use them within your organization. Business insights is a very common buzz phrase, the type that your CEO will hear in a demonstration and march directly into your office explaining that you must have KPI and charts and dashboards and you need them immediately. While it is true that all of those things will bring value to the organization, it is also true that there must be a plan in place and an end goal in sight. Having charts to have charts is never going to provide any business value. Instead, having charts that solve specific business problems or that provide information to a group of users will provide value and a return on investment. So, when faced with the CEO who has been bitten by the "demo bug," be sure to help him refocus what he has seen with your organization in mind. Once you have the end goal in mind, you can then select the tools to help you get there. The following list shows some common goals or phrases that can be used to describe different scenarios that can be resolved with the business insight tools within SharePoint. This list should give you some ideas and serve as a checkpoint that you can use to verify your goals.
Show a visual representation of the task breakdown for our project.
Show a visual indicator of issues that are present within a project, report, or collection of data.
Provide information to the sales team from last year's sales numbers, so that they can make decisions for this year.
Provide a single entry point into legacy business data so that users from one single location can drill into the specific information that they need for their current tasks.
There are many different reasons to deploy insights within your environment. The key thing is that you understand your end goal and then work together with the business to provide the proper tool set to meet their specific needs. The tools available within SharePoint, specific to insights are:
Chart web parts: These web parts allow you to easily create a visual representation of list data or data from Excel Services. These web parts can be added to pages to create a dashboard.
KPI lists and web parts: These lists and web parts allow you to configure specific items that you want to monitor through performance indicators. As an example, you could be notified when more than one task in a task list is overdue.
Visio Services web part: This web part allows you to display a Visio document directly within a web part.
Excel Services: These features include web parts that allow you to display data from an Excel workbook directly within a SharePoint web part. Within this web part you can also configure parameters which allow the data to be displayed based on the selections of the user.
PerformancePoint: The PerformancePoint features allow you to easily create dashboards based on date that are distributed across various enterprise systems.
Like most things in SharePoint, there is a level of progression when working with these features. If you are just getting started, it is recommended that you first start with the Chart web parts and the KPI lists. Once you are familiar with those elements, you should move on to Excel Services and Visio Services. Finally, once you have become familiar with those elements you could begin working with the PerformancePoint features.
One final note that we should cover is the concept that working with PerformancePoint features will require the involvement of several key roles within the organization. The idea of PerformancePoint is that you are pulling data from many locations and bringing it together via dashboards and web parts. This is a great tool that can provide tremendous value to the organization. However, it is important to note that the quality of the data returned is dependent on the quality of the data that is available. Don't be surprised if part of your process of moving to a solution that utilizes PerformancePoint features also includes an element of restructuring and verifying your current data structure.
Throughout the rest of the chapter, you will be reviewing examples and learning the details of each of the components discussed above. You will start with the Chart web parts and end with PerformancePoint Services. Each section will build on various examples, which will show you how you can combine all elements together to build a solution for your users.
Excel Services is the tool within SharePoint that allows users to interact with Excel workbooks directly from the browser. These features allow a workbook to be published to a SharePoint library and then displayed using a collection of Excel Services web parts. These web parts allow you to build dynamic dashboards through web part connections. Before we get into the details of working with Excel Services within a SharePoint site, it would be good to cover some of the basics of Excel Services. Once you understand this basic foundation, you will be able to easily see how Excel Services can be combined to build business solutions. At the core level, Excel Services consists of the following three components:
These three components work together to provide the overall end user experience. The Calculation Services engine is responsible for running all the calculations within the workbook. These calculations are run directly on the server without direct interaction from the users. This service is also responsible for maintaining sessions and refreshing data within each session. The web access components are the web parts that allow you to display the Excel information within SharePoint sites. These web parts also allow connections, allowing you to pass information to the web part that changes the data displayed, based on the input. Finally, there is the Web Services component. This component is new with SharePoint Server 2010 and provides an application programming interface (API) that can be used by developers that want to write custom applications to interact with the Excel workbook.
Once the workbook has been published to the SharePoint site, the site administrator can configure the web parts to display the Excel workbook. The Excel web parts can be configured to display the entire workbook or just a named region within the workbook. Once the workbook is displayed on the site, users can interact with it through preconfigured parameters. These parameters are created within Excel prior to its being published to the SharePoint site. Users will only be able to read the Excel document from the Excel web parts, but if they need to edit the content within the workbook, they can always use the Excel Office web application to make browser-based changes to the workbook.
Now that you have briefly covered the basics, you are going to work through the steps required to publish a workbook to SharePoint using Excel Services. You will start by publishing a workbook and then using a web part to display the workbook on a dashboard page. Once you have completed that, you will return to the workbook and add a named region and some parameters that you can use to filter the workbook from the dashboard. Finally, you will open the workbook using the Excel web app so that you can experience the process of users who have to edit the workbook through the browser.
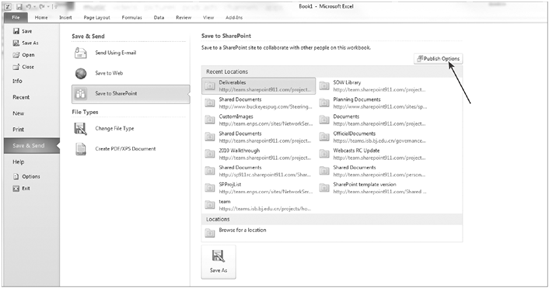
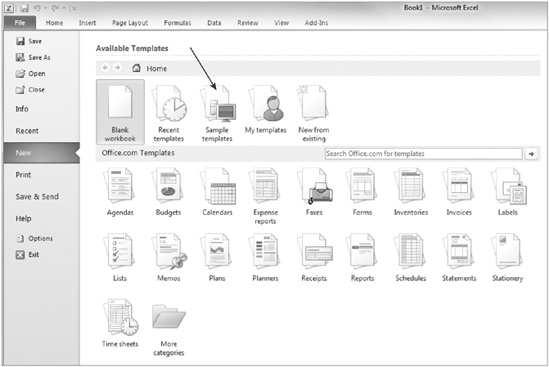
To get started, you will open an Excel workbook and then save it to a SharePoint library. When you use the Office Backstage view to save to the SharePoint library, you will see additional links for publishing options, as shown in Figure 16-1.
Since this book focuses on SharePoint, we are not going to spend a lot of time on configuring the workbook. Instead, you will use one of the Microsoft samples that comes with Excel 2010. This sample contains several pivot tables that you can use for the remainder of the examples. The first Try It Out in this chapter will be creating an Excel document based on this template.
TRY IT OUT: Create a Site Using the Business Intelligence Template
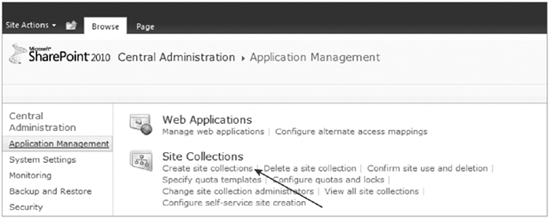
The first thing that you will do in this chapter is create a site based on the Business Intelligence site template. You will do this from the Central Administration site; however, the steps can also be completed from any site that has the Enterprise Features enabled. You are creating this site collection so that you have a location to add content to for the remaining chapter demos.
Open the Central Administration site.
Select the Create Site Collections link within the Application Management grouping, as shown in Figure 16-2.
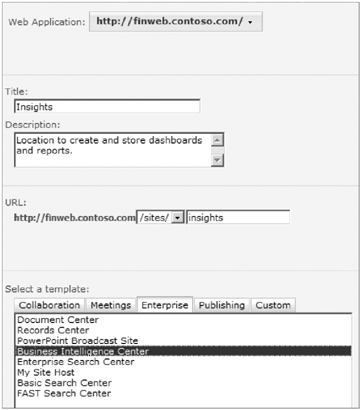
Enter the following properties for the new site collection as shown in Figure 16-3, and then click OK:
PROPERTY
VALUE
Web Application
Accept the default option, unless directed otherwise by your server administrator.
Title
Insights
Description
Location to create and store dashboards and reports.
URL
/sites/insights
Template Selection
Business Intelligence Center
Primary Site Collection Administrator
Your Username
Quota Template
No Quota
Click on the URL to open the new site collection. You will see that the site collection comes preconfigured with several different lists and libraries that are built to hold BI data, as shown in Figure 16-4.
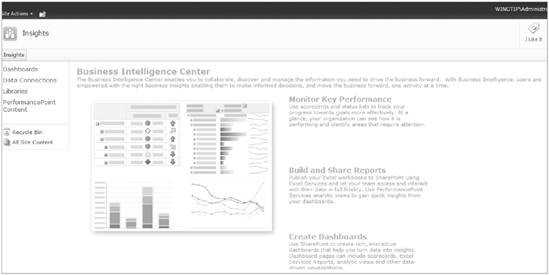
When you create a site collection in Central Administration, you provide all of the details for your site collection and then the site is provisioned for you and a link is returned.
TRY IT OUT: Create and Publish an Excel Workbook to the SharePoint Library
In this Try It Out, you will be publishing an Excel document to the SharePoint site you created in the previous example. You will be starting in Excel and will complete the demo by viewing the published Excel document in the browser.
Open Excel from the Windows Start Menu.
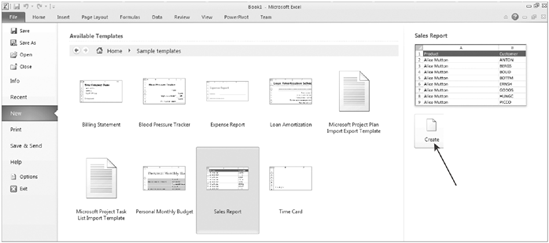
Create a New Document based on the Sales Report sample template, as shown in Figures 16-5 and 16-6.
Once the sales template loads, take a few minutes to review the content in the document.
Select the File option to open the Backstage view.
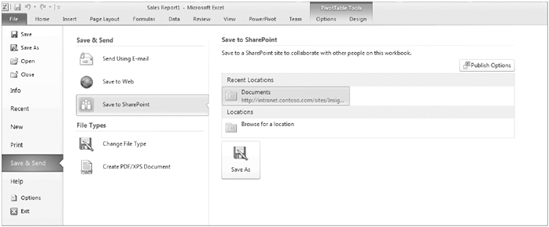
Select the Save & Send menu option, shown in Figure 16-7, and select Save to SharePoint.
Select the Option to Browse for a location, and click Save As.
In the File Name field, enter the URL for the site collection that was created in the preceding example and press Enter. If prompted, enter your user credentials to gain access to the site collection.
When the site loads, double-click the Documents item to open the Documents library.
Click on "Publish Options..." to see the different settings you can configure for publishing. In this example, you are going to accept the default options. Select OK to close the options box.
Enter the file name of Sales Report, and click Save.
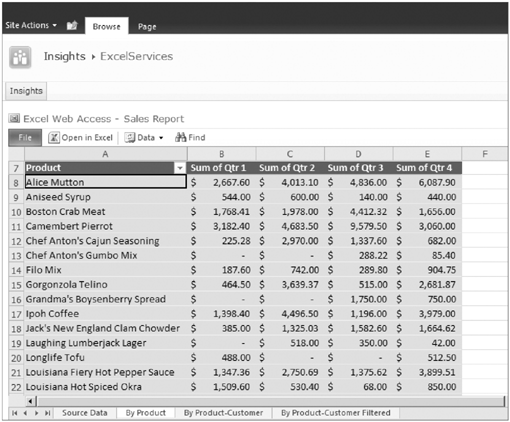
The document will be saved to SharePoint, and the browser view of the form will be opened for you to review, as shown in Figure 16-8.
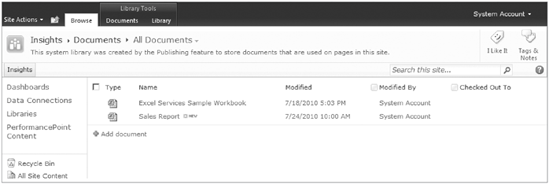
Browse to the URL of the SharePoint Document library, as shown in Figure 16-9, to verify that the document was uploaded. You will also notice a document called Excel Services Sample Workbook in your library. This is a sample that is created when the site is created.

How It Works
When you select the option to save to SharePoint, Excel publishes the document to the SharePoint library using the configurations you set under the publish options. Once the document is published successfully, you will see a browser view displayed for you.
Now that you have the workbook published to a SharePoint library, you will be able to add a web part to display the workbook information. To get started, you will create a new dashboard page. A little later in the chapter we will discuss this in greater detail, but for now you are going to create it in order to get started. Once you have the dashboard created, you will add and configure the Excel workbook. There are many different configuration options available, so before you complete the examples, we will review the different options you have.
The toolbar and title bar options allow you to supply values for the various ways that you can configure the display of the web part. For the title bar, the web part is set to auto-generate the title and the link by default. If you would like to use your own title instead, you can deselect the option in this section and enter a custom title in the appearance settings. If you have this option selected, then the title in the appearance settings will be ignored and the web part title will be auto-generated. The toolbar options allow you to select which commands you would like to make available to the users and include the following options:
It is likely that each workbook you display using a web part could require a different combination of settings. By default, all the settings listed above are enabled, so if you don't want to use those features, you will need to update the configuration of your web part.
The navigation and interactivity options allow you to configure how the users are able to navigate and interact with the workbook. The table that follows describes each of the different settings available for configuration.
The remainder of the configuration options are the standard web part properties. When working with Excel Services web parts, one of the most common web part settings used is located within the Appearance options. In many cases, you will want to manually configure the size of the web part so that your worksheet is displayed correctly on the page. Often the charts, tables, and graphs from the worksheet are larger than the default size of the web part, and when that occurs, scroll bars are displayed within the web part. To eliminate the need for the scroll bars, you can either shrink the content within Excel and republish the web part or you can configure the web part to be large enough so you don't need the scroll bars.
TRY IT OUT: Create a New Dashboard
Within the Business Intelligence site template, dashboards can easily be created. These dashboards are basically web part pages that you can use to create dashboards. You are going to create a dashboard in this example so that you can have a location in which to add the Excel Services web part. Throughout the remainder of this chapter, you should refer to this exercise whenever you need to create an additional dashboard.
Open the site you created in this chapter's first Try It Out.
Select the Dashboards link in the Quick Launch Toolbar.
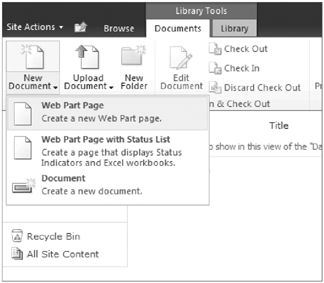
In the Documents Ribbon, select the New Document drop-down.
Select the New Web Part Page option, as shown in Figure 16-10.
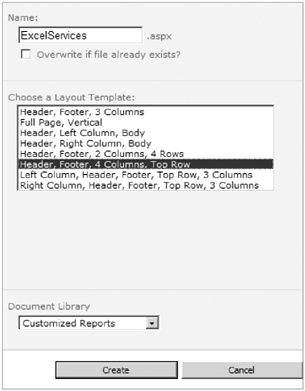
Enter the following properties for the dashboard, as shown in Figure 16-11.
PROPERTY
VALUE
Name
ExcelServices
Choose a Layout Template
Header, Footer, 4 Columns, Top Row
Document Library
Customized Reports
Click Create, and you will be directed to the new dashboard page, as shown in Figure 16-12.
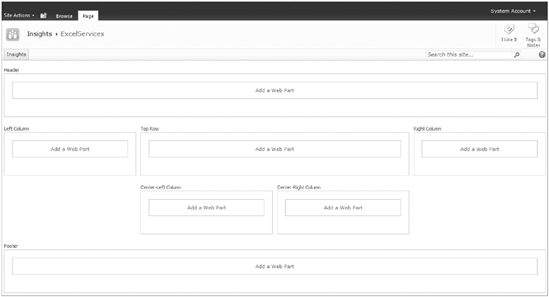
How It Works
A new dashboard page is created and stored in the Customized Reports library. You can access this page by accessing the library or by adding the link to the navigation.
TRY IT OUT: Configure the Excel Services Web Part
In this Try It Out, you will add web parts to the dashboard page you created in the previous example. If you have already closed the page you created above, you can access it through the View all Site Content page. Once you open the library, you can select the item you want to modify. The page will load and then you can use the site actions menu to access the Edit Page option.
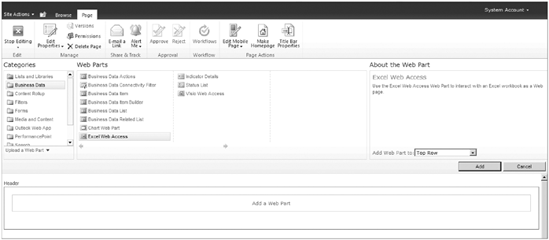
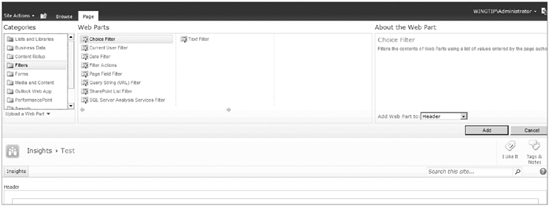
Click the Add Web Part option in any of the web part zones.
In the Business Data category list, select the Excel Web Access web part, as shown in Figure 16-13, and click Add.
When the web part is added to the page, click the "Click here to open the tool pane" link within the web part.
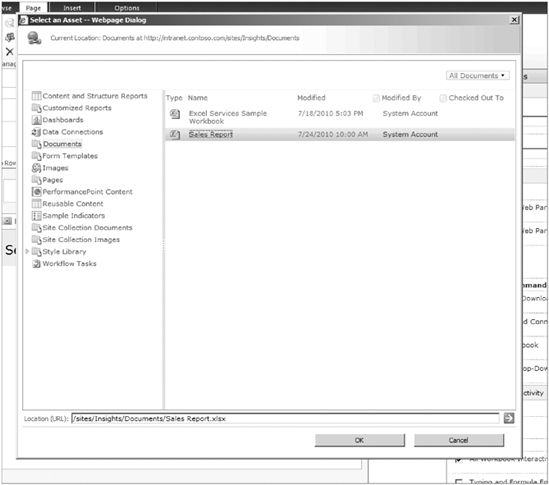
Click the ellipse next to the Workbook field to browse for the location of the document you published in the previous example, as shown in Figure 16-14. Click OK once you have selected the document.
When you click OK, the document link will be displayed in the Workbook field. Notice the remaining tool pane options. Each of the options was described previously in detail. For this example, you will accept the default configuration. Click OK.
Select the Stop Editing option in the Ribbon to view the page as shown in Figure 16-15.
How It Works
The web part is configured to reference the document that you published to the site. The document's contents will be displayed within the web part and will be in sync with the data that is being published.
Parameters are values that are configured within the workbook that can be used to change the view of the data. An example of this is a parameter that represents the Product name. You would create and configure the parameter within the workbook. Once you have created the parameter, end users could use it to modify the display of the data within the web part. The parameters can be configured within the web part through the parameters tool pane, or they can be configured through a web part connection. In the example of a parameter based on the Product name, users could in theory select only the products that they are interested in. Once those products were selected, the Excel data would then be filtered based on the product selection.
TRY IT OUT: Configure a Parameter Based on Product Name and Connect with a Filter Web Part
In this Try It Out, you are going to configure a parameter within an Excel document so that you can use a filter to modify the display of the web part. You will create a parameter within the Excel Services Sample Workbook, which is loaded to the site when the site is created.
Open the Documents library in the site collection you created earlier in this chapter.
Open the Sales Report document that you created earlier in the chapter.
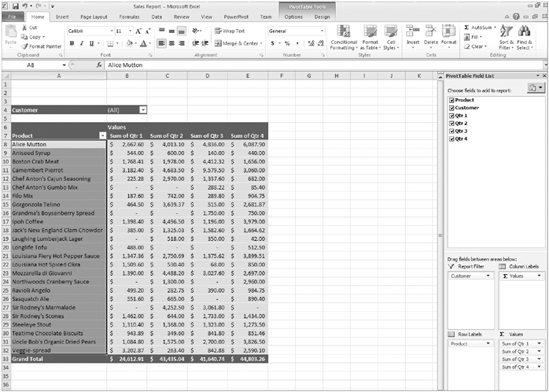
Open the By Product Worksheet, select any cells within the table to open the PivotTable Field List.
Add the Customer field to the Report Filter section. This is done by selecting the Customer field and dragging it to the Report Filter box. You should notice that there is now a filter drop-down above the table that is labeled Customer, as shown in Figure 16-16. If you modify the selected value, the table will be updated based on your selection.
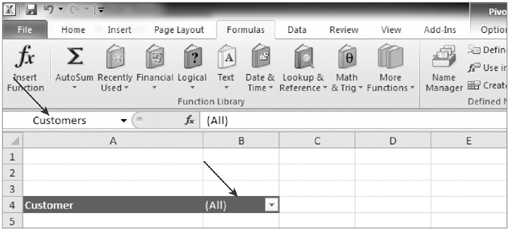
Select the cell that contains the Customer value. In the Formulas Ribbon, select the Define Name option and name the cell Customers. Click OK to save the name changes. You will notice that whenever you have that cell highlighted, the name "Customers" is displayed in the toolbar, as shown in Figure 16-17.
Select the file menu to open the Backstage options.
Select the Save & Share option and the Save to SharePoint option.
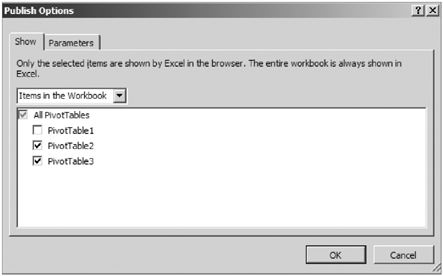
Since you opened the document from SharePoint, you can save the document back to the current location. You first need to update the Publish Options so that you can publish your parameter. Click the Publish Options button. In the Parameters tab, select the Add option, and select the Customers parameter. Click OK twice to save the changes. In the Show options, select the Items in the Workbook option and check all items.
Select the Save As option, and then click Save in the Save dialog. Click Yes when prompted as to whether you want to save over the existing file.
Once the document appears in the browser, use the breadcrumbs to navigate back to the home page for the site collection.
Using the steps in the earlier Try It Out called "Create a New Dashboard," create a new dashboard called ExcelServices2.
When the dashboard page loads, click in any cell to add a web part.
Click the Add Web Part option in any of the web part zones.
In the Business Data category list, select the Excel Web Access web part and click Add.
When the web part is added to the page, select the "Click here to open the tool pane" link within the web part.
Click the ellipse next to the Workbook field to browse for the location of the document you published in the previous example. Click OK once you have selected the document.
Configure the remaining tool pane options as follows:
PROPERTY
VALUE
Named Item
By Product
Type of Toolbar
PivotTable1
Appearance
Set the height and width settings to use 7 inches.
Reaming Options
Keep the Default
Select the Add a Web Part link in any of the web part zones and add the Choice Filter web part from the Filters category, as shown in Figure 16-18, and click Finish.
Open the Filter web part tool pane and add the customer data. This list can be obtained by copying the data from the Excel spreadsheet. Keep the remaining default options, and click OK. It is likely that, when you implement this within your organization, you will instead work with an external content list that is referencing a back-end system that stores your client data. If that is the case, then you could use the SharePoint list filter. To keep the example simple, you are going to enter the customers manually.
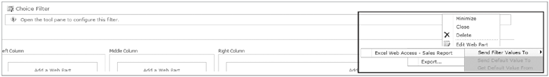
The final step is configuring the Filter web part to pass values to the Excel Document. Select the Filter web part drop-down menu and select the configuration option. Select the Send Filter Values To option and then select the Excel Web Access web part, as shown in Figure 16-19.
In the Configuration Wizard, set the connection type to Get Filter Values From and then click Configure. Select the Customers field for the Filtered Parameter option, and click Finish.
Using the Page Ribbon, select the option to Stop Editing the page.
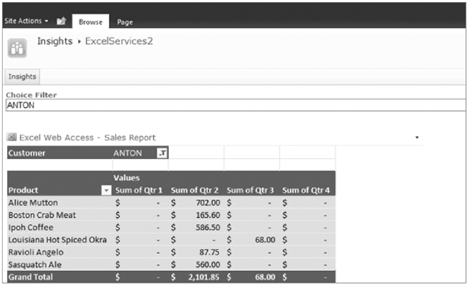
Use the filter drop-down to select a client. Once you press Enter, you should notice that the values in the table were updated based on the value you selected.
How It Works
The value passed from the Filter web part acts as the parameter filter in the Excel Web Access web part. For any report that you have in Excel that used parameters for values, they can be filtered on SharePoint pages using the Filter web parts.
Many times within Excel, worksheet connections are made to external data sources. These connections can be used for worksheets that are published to SharePoint, as long as the connections are stored within a trusted location. If you are planning on publishing Excel worksheets that contain connections to external data sources, then you will need to work with your administrator to ensure that all of the data connections are configured correctly for use within your environment. In most cases, the connections will need to be created in a data connection file and then stored within the farm's data connection libraries.
There are two different ways to manage permissions for the content within the worksheet. The first option is to control what content is visible on the server. This is configured during the publishing process. Any objects that you haven't selected will not be visible when the worksheet is viewed from the server. Figure 16-21 shows the configuration step from the publishing process. In this Try It Out, you are choosing to publish only two of the worksheets to the server.
If you read the fine print above, you will notice that the option applies to the server view only. If users open the workbook within the Excel client, they will have access to all the content. In most cases, this is probably not the desired result. Within SharePoint there is a way to configure permissions so that even if users open the worksheet, they only have access to the published information. This is done by using the View Item permissions. Users who have the View Item permissions will only be able to open a snapshot of the spreadsheet in the client. This snapshot will only show limited information and will prevent them from seeing the content that was not shared during the publishing process. The two lists that follow outline the different types of content that will be available within the snapshot and the types of content that will be removed from the snapshot.
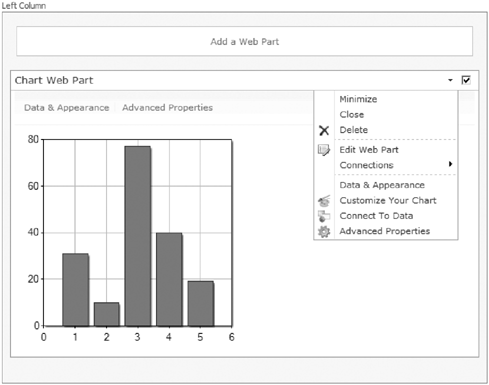
The Chart web part is a new web part that comes with SharePoint Server Enterprise. This web part can be added to any web part zone and can be configured to chart data from several different sources. When the web part is added to the page, you will have access to two different Configuration Wizards, which will walk you through the process of configuring and customizing the Chart web part. Figure 16-22 is an example of the web part that was added to the page before it has been configured. You will notice two links appear on the screen and then also in the web part drop-down menu.
This web part can be configured to create reports for several different data sources, including the following:
Web Part
Connect to a List
Connect to Business Data Catalog
Connect to Excel Services
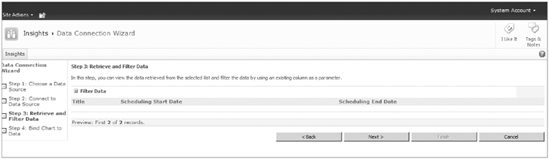
The process for configuring the web part is a four step process. You start by connecting to the data and then move through the remaining steps. At any time in the process, you can select the desired step from the Data Connection Wizard Quick Launch to modify your configurations. An example of this wizard is shown in Figure 16-23.
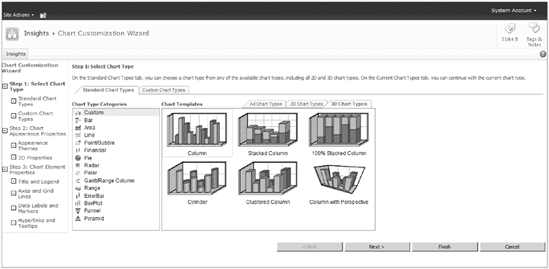
Once you have the data configured, you can customize the appearance of the chart using the Customize Your Chart Wizard. Within this wizard, you will be able to select the type of chart; configure the appearance, which includes the theme, height, width, and 3D properties; and modify the chart elements, which includes the chart title, legend, gridlines, data labels, and hyperlinks. An example of this wizard is shown in Figure 16-24.
TRY IT OUT: Use the Chart Web Part to Display Data from a SharePoint List
In this Try It Out, you are going to add a chart to the dashboard you created in the previous example. You have already added the Filter web part and the Excel Services web part. You will now add a Chart web part that will display a graph based on some list information you have stored within the site collection. You will first need to create the list and add the data. Since you have already covered how to do this in previous chapters, we won't cover it in detail. You can always refer to Chapter 3 if you need additional instructions.
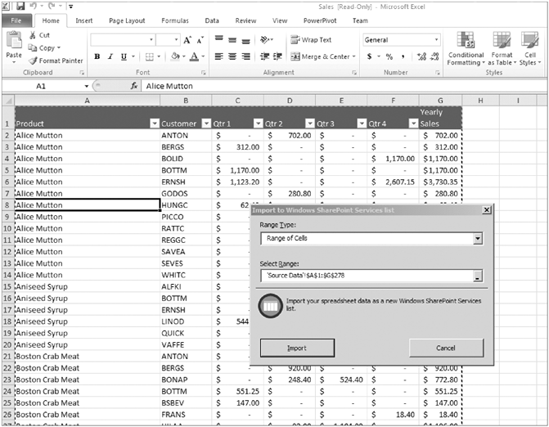
Create a list using the Import Spreadsheet option. To import the spreadsheet, create a new document from the Sales Report template (see the previous examples if you need more details) and save it locally. Using the Import Wizard, you can point to the saved file and select the data range from the Source Data worksheet. An example of the range selection is shown in Figure 16-25.
Once the list is imported, it will be opened for you to review. Keep in mind that this exercise is simply to show how the configurations work. It is not likely that you would have the same type of data within your environment. You will likely have different columns and different values. Completing this exercise, however, should give you the information you need to build the charts with your data.
Using the steps in the previous "Create a New Dashboard" Try It Out, create a new dashboard called ChartWebPart.
When the dashboard page loads, click in any cell to add a web part.
Click the Add Web Part option in any of the web part zones.
In the Business Data category list, select the Excel Web Access web part, and click Add.
When the web part is added to the page, click the Data & Appearance link within the web part.
Select the Connect Chart to Data option.
Select the Connect to a List option, and click Next.
Select the Sales Data list from the list drop-down option, and click Next.
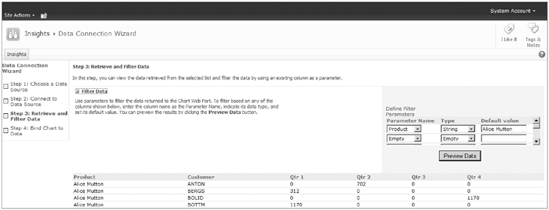
The data from the list will load for your review. On this screen, you can also filter the data that is presented. For this example, you will filter the data based on Product. Your default value will be Alice Mutton, as shown in Figure 16-26.
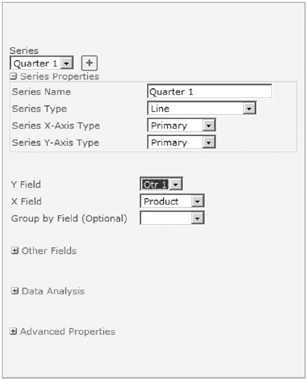
You will now configure your chart. You are going to create a line chart with a series for each quarter. You will first start by modifying the Default series so that it has the values, as shown in Figure 16-27.
Next, you need to create the three additional series. You do this by selecting the Plus icon next to the Series drop-down. Each series should be named and given properties as shown in the following table:
NAME
SERIES TYPE
Y FIELD
X FIELD
Quarter 1
Line
Qtr 1
Product
Quarter 2
Line
Qtr 2
Product
Quarter 3
Line
Qtr 3
Product
Quarter 4
Line
Qtr 4
Product
Click Finish and you will see a preview of the chart.
You will now change the appearance of the chart. Click the Data and Appearance link again, and click the Customize Your Chart link.
Within this menu, you can change the appearance of your chart. For this example, you are going to make the chart display in 3D using a different theme.
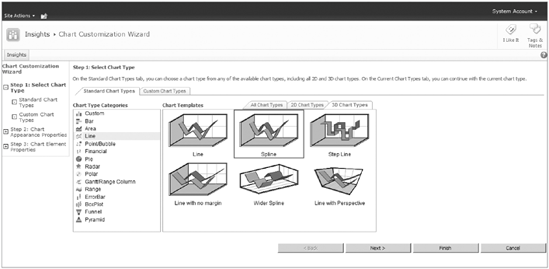
When the customization page loads, select the Standard Chart Types tab. You will see all of the different types of charts that are available. Select the Line category and the 3D Chart Types tab.
Select the Spline chart, as shown in Figure 16-28, and click Next.
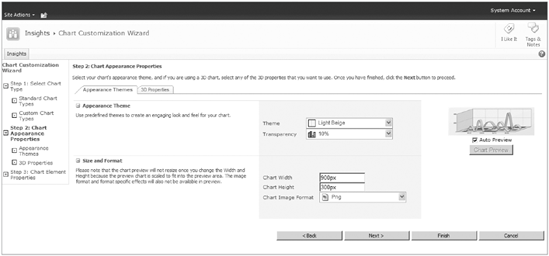
On the next configuration screen, change the theme to Light Beige and the transparency to 10%.
In order to give your chart some additional display width, change the Chart Width to 900px, as shown in Figure 16-29.
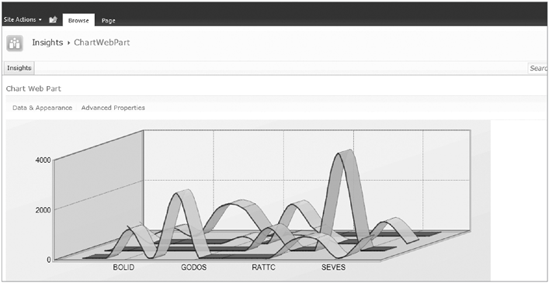
Click Finish and the updated web part page will be displayed. Select the Stop Editing option to see what the page will look like when users open the dashboard. Remember, though, that only users who have the ability to design and edit the page will see the links for Data & Appearance and Advanced Properties, as shown in Figure 16-30.
How It Works
You configured the Chart web part to pull a collection of filtered data from a SharePoint list. Using the configurations within the web part, the chart is displayed on the web page. For this Try It Out, you used only a filtered view of the product; however, you could apply additional filters to show additional views of the data.
A status list in SharePoint 2010 is similar to the KPI list in SharePoint 2007. This list is populated with various status indicators that you create to produce a visual representation of the status of the data. Indicators can be created for several different types of data, including the following:
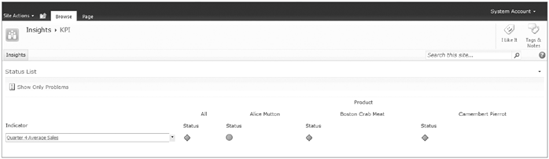
For each item in the indicator, a goal level and a warning level are configured. The indicator will be updated based on the content, and an indicator will be displayed based on the calculated value. An example of a common KPI is sales numbers. The indicator could be configured to display a red status until you reach 50% of the goal, a yellow status from 51%-74% and a green status for 75% and higher. Just by looking at the indicator you would have a good idea of how your sales numbers were tracking. Figure 16-31 shows a sample of several KPI indicators.
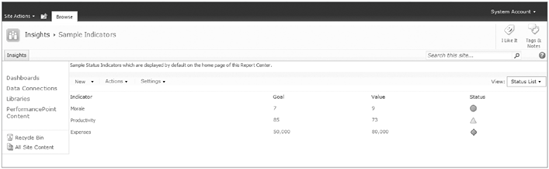
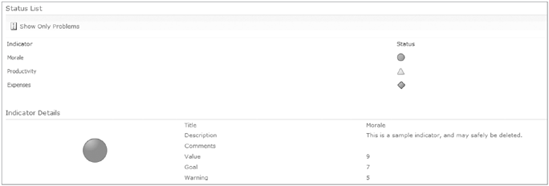
Figure 16-31 shows the status list, with several different indicators. In addition to the list, there are two KPI web parts that can be used to display the indicators within a web part zone. The Indicator Details web part is used to display the details for a single indicator from the list. The second web part, the Status List web part, is used when you want to display all indicators. In Figure 16-32, these two status web parts are shown.
TRY IT OUT: Create a Dashboard to Report on Sales Data
In this Try It Out, you want to monitor the average sales of Boston Crab Meat. You have noticed a trend, and you want to monitor the average sales across clients. You will create a KPI list item to monitor average sales.
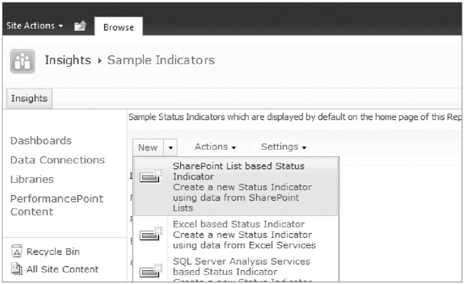
Click Site Actions, View all Site Content, and navigate to the Sample Indicators list.
In the New menu, select the option to create an Indicator from a SharePoint list, as shown in Figure 16-33.
Fill in the following values for the indicator and click OK.
PROPERTY
VALUE
Name
Quarter 4 Average Sales
List URL
Click on the List icon and navigate to the Sales Data list. Doing this will populate the list URL for you.
View
All Items
Value Calculation
Average of Qtr 4
Goal
400
Warning
200
You will now create another dashboard page, which you will use to display the KPI. Using the steps in the earlier "Create a New Dashboard" Try It Out, create a new dashboard, called KPI.
When the dashboard page loads, click in any cell to add a web part.
Click the Add Web Part option in any of the web part zones.
In the Business Data category list, select the Status List web part.
Open the Web Part tool pane, and configure the following options:
PROPERTY
VALUE
Indicator List
Sample Indicators
Show Only Status Icon
Selected
Display Multiple Indicators Column
Selected
Status Indicator
Quarter 4 Average
Column of Dimension
Product
Member to Display
Alice Mutton; Boston Crab Meat; Camembert Pierrot
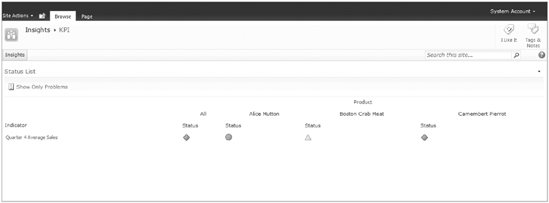
Click OK. The page will reload, and you will see the KPI information displayed as shown in Figure 16-34.
Click the Indicator title to go to the Details page.
Click the List link to open the Sales Data list.
Select the first Boston Crab Meat list item, update the Quarter 4 value to $4000 and click Save.
Click on the Dashboards link in the Quick Launch Toolbar, and then open the KPI dashboard. You will notice that the status of the Boston Crab Meat product is now yellow, as shown in Figure 16-35.
How It Works
The status indicator is configured to pull an average value from the Sales Data list. As the values are changed, so are the KPI indicators. The Status Indicator web part is being used to show the current KPI values, and is taking advantage of the feature to show multiple indicators in order to provide additional details about some of the products included in the average sales. This example would allow you to see a KPI value for all items in the list, as well as provide a way to monitor specific key product lines.
Visio Services is a new service application within SharePoint that allows you to interact with data from Visio diagrams. At the base level, a Visio Web Access web part is used to display the data from a published Visio diagram. The diagrams are first created in Visio and then published to SharePoint as web drawings. The Visio web part can then be added to any web part zone within the farm that is hosting the drawings. Keep in mind that, since the document is stored in SharePoint, the document will only be rendered in the web part for users who have at least View permissions for the document. Since you can point to any document within the farm, it is possible for you to render the information in many places, while still keeping a single entry point for the data.
The Visio web part supports web part connections, which allow users to interact with the published data. Some examples of possible configurations are:
Master/Detail: This can be used when you have a step process; the master could display steps 1-4, for example. As you select a shape in the master diagram, the detail diagram is updated to display the detailed information for that step.
SharePoint List: When your Visio diagram is connected to a SharePoint list, you will be able to connect the diagram to the List web part and interact with the data. When you select items within the SharePoint list, the corresponding items in the diagram will be highlighted.
The connection settings are configured within the Visio Web Access web part in the Connections menu option. As you can see from Figure 16-36, the menu option provided for configuring the connection is very straightforward and easy to understand.
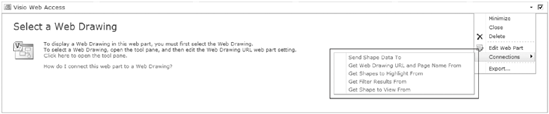
The table that follows describes the different connection options available, as well as an example of when you would use that particular connection.
CONNECTION TYPE | DESCRIPTION | EXAMPLE |
|---|---|---|
Send the data for the selected shape to another web part. | When you have to show diagrams in a master/detail relationship, you would send the shape data to the Details web part so that it would know what data to display. | |
This connection allows you to dynamically accept the Drawing URL and Page name. | This could be used when you had a list of drawings and you wanted users to be able to easily select a drawing from a list and have the drawing displayed. | |
This connection allows you to highlight shapes in the diagram. The connection will need to have the name of the shape and the color of the highlight. | This could be used if you wanted to be able to select from a list of items and have certain ones highlighted. For example, if you had a floor plan drawing and wanted to highlight all rooms that were 6 × 8. | |
This connection will filter the items in the Visio diagram based on the SharePoint list contents. This connection only works when the Visio diagram is connected to the SharePoint list and the only list that can pass the connection is the List web part of the connected list. | This would highlight values that match the filtered SharePoint list. If you look again at the floor plan example, you could have a list that contains all of your information about each of the rooms. If you filtered the list based on the fireplace option, then all rooms with fireplaces would be highlighted in your web part. | |
This connection allows you to change the zoom view for a specific shape. | This would be useful, for example, if you wanted to have a list of values that, when selected, would cause a new view to display that zooms in to show all of the details. |
As you can see from the table, there are many different ways you can configure and connect the web parts. In the Try It Outs that follow, you will be working through several different examples. Once you complete these Try It Outs, you should have a good understanding of how these diagrams can be connected to provide valuable, dynamic information to users.
TRY IT OUT: Create a Visio Services Document
The process for creating a Visio services document is the same as for creating a standard Visio document. In this Try It Out, you will upload two separate Visio files. The first one has several different pages, and the second one has only one page. Since the content is not relevant, you can use whatever Visio diagrams you have access to. If you do not have any, you can simply open Visio and create two separate diagrams with various shapes.
The first thing that you need to do is to create a document library in which to store your Visio documents. To do this, select the All Site Content option from the Home page, and then select the Create option. Select the document template and select More Options. Enter the following values and click Create.
PROPERTY
VALUE
Name
Diagrams
Navigation – Display on Quick Launch
No
Other options
Use the default values
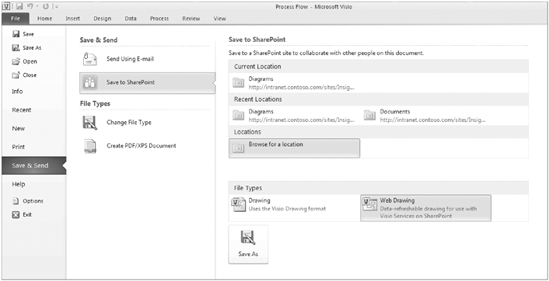
Open the first Visio document that you want to publish to the site. Select the File option to open the Backstage view. Select the Save & Send option and the Save to SharePoint option, as shown in Figure 16-37. You should notice that this screen looks very similar to the Excel screen. Select the option to Browse for a location, and set the file type to Web Drawing.
Enter the URL for the library that you created in step 1. When the library loads, enter the desired filename and click Save. When the document has finished saving, it will open in the browser for you to preview, as shown in Figure 16-38.
Repeat steps 2 and 3 for another Visio document. This will give you at least two different diagrams in your library.
How It Works
When you publish a document to a SharePoint site, the document is saved in a format that can be displayed within the Visio Access web part. In the next Try It Out, you will configure the web part on a dashboard page.
TRY IT OUT: Connect a Visio Services Web Part to a List Web Part
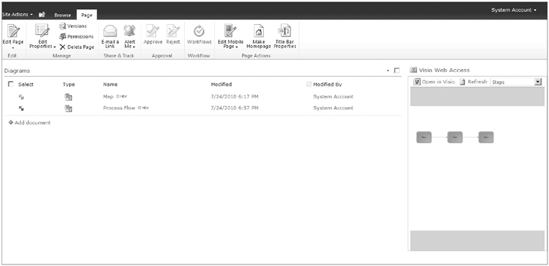
In this example, you will add the Visio Web Access web part to the page and connect it to the Diagrams library you created in the previous example. You will create a connection between the two web parts so that the Visio web part will load the drawing you select in the Diagram web part.
Using the steps in the "Create a New Dashboard" Try It Out, create a new dashboard called Visio.
When the dashboard page loads, click in any Column cell to add a web part.
Click the Add Web Part option in any of the web part zones.
In the Lists & Library category list, select the Diagrams web part.
Select the zone next to the one you used for the Diagrams web part, and click the Add a Web Part option.
In the Business Data category list, select the Visio Web Access web part and select Add.
Select the Edit Web Part menu for the Visio web part, and click the Connections link.
Select the Get Web Drawing URL and Page Name option, and then click the Diagrams option.
In the Configure Connection dialog, select the following options and click Finish:
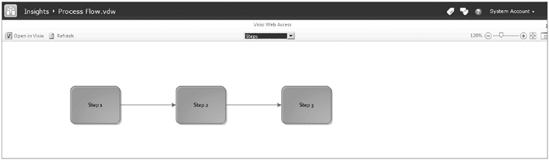
Select the Stop Editing option in the Ribbon, so you can view the web part page. Notice that, as you select each of the diagrams, the Visio document being displayed is updated to match the selected diagram, as shown in Figure 16-39.
This is just one example of using the Visio Web Access web part. In this Try It Out, you used a web part connection to display the Visio documents. If you did not want to use a connection, you could configure the web part to display a single Visio Document by entering the Web Drawing URL within the Web Part tool pane.
How It Works
The two web parts are added to the page and a connection is built between them. The values for the Web Document URL are passed from the Diagrams List web part. Doing this allows any user to select which diagram they want to be displayed.
In previous versions of product releases, PerformancePoint was a standalone server product for building business intelligence reports and dashboards. With the latest release of SharePoint, the PerformancePoint features have been incorporated into SharePoint, allowing users to easily create rich reports, dashboards, scorecards, and KPIs using the Reports Builder. When the farm is configured, the SharePoint administrator will complete the process for configuring the PerformancePoint service application. Once the configuration is complete, users with the appropriate permissions will be able to incorporate the PerformancePoint content into their sites.
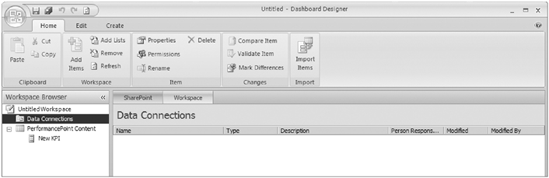
One of the key benefits of PerformancePoint is the ability to design and build content using the Dashboard Designer. As you can see in Figure 16-40, this design environment is similar to that of other office applications and includes the Ribbon.
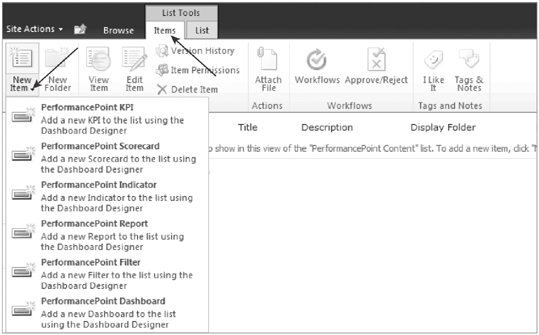
The Dashboard Designer can be accessed easily from any list created with the PerformancePoint content template. From within the list, the Dashboard Designer is launched whenever you create new content items. Figure 16-41 shows an example of how you would launch the dashboard.
PerformancePoint is a very large component of reporting and business intelligence, and there is no way that a small section in a single chapter will be able to do it justice. Since most of the work done to create reports using PerformancePoint is done in the PerformancePoint Dashboard Designer, it is out of the scope of a beginning SharePoint solutions book. In the list that follows are several different links that you could reference to learn more and to gather more experience on this particular topic:
TechNet Documentation
Plan for PerformancePoint Services:
http://technet.microsoft.com/en-us/library/ee681486.aspxSolution Scenario Walkthrough
Corporate Dashboards Sales Solution:
http://technet.microsoft.com/en-us/bi/ff643005.aspxBusiness Intelligence Resource Center:
http://technet.microsoft.com/en-us/bi/default.aspx
After reading this chapter, you will have been exposed to many of the different tools available to you. These are all powerful tools that, when combined, can be used to provide immediate, dynamic, and meaningful information to the users on demand. There are a few things to keep in mind, though, as you move forward with the solutions you are building. In this section, we will cover some of the things that you should be thinking about as you begin to work with these tools.
As you begin to look at the tools available and the information you want to present to the user, it is important to also look at the user. If you have been sending out an Excel document for five years and now you want to display it on the web page, what impact will that have on your users? It is so important that you consider this. You can build the best solution ever, but if users don't understand it, then it won't provide the value that you and they need. Be sure that you talk to your users to truly understand how they are currently working with the data and then formulate a plan that will empower them to do more with SharePoint.
Like with many things in SharePoint, insights is an area that has several levels of complexity. It is important that you understand each of these levels before you advance to the next one. This will keep you from over-customizing something when you could use the tools that are available out of the box. To get started, you could work with the tools available out of the box, such as the web parts and the KPI lists. From there you could move into working with Excel and Visio services and, finally, you could build more custom and advanced reports using the PerformancePoint Dashboard Designer. There are many different tools, and it may take some time for you to realize the best combination and configuration of tools to meet your organization's unique reporting requirements.
In this chapter, we have reviewed many of the key aspects of the new insights features within SharePoint 2010. After reading this chapter, you should be familiar with and able to configure the different business intelligence components within the site, including:
Defining business intelligence
Working with Excel Services
Using the Chart web part
Working with Visio Services
Working with KPI features
Understanding PerformancePoint features