Chapter 7
Lighting
We have stated, and will continue to state, that color depends on the light source, object, and the observer, shown in Figure 7.1. Chapter 1 is focused on the object while Chapter 2 considers the observer. We focus on the light source in this chapter. Many color tolerances are defined using standard illuminants such as D65. We describe how CIE daylight was derived as well as other standard illuminants. All viewing booths have lights that simulate CIE daylight. How well is daylight simulated? The luminous efficiency function, Vλ, is used to calculate luminance, illuminance, luminous efficacy of a source, and luminous efficacy of radiation (LER). These metrics are used to specify the amount of light necessary for a given task and to quantify energy efficiency. The color of a light source is defined by its chromaticity coordinates. However, it is difficult to infer hue from chromaticities. Instead correlated color temperature (CCT) is used. A wide variety of electric lighting is in use today including incandescent, fluorescent, metal halide, and solid state. These lights can have the same CCT, but because their spectral properties are vastly different, colored objects appear differently. The objects have been rendered differently and color rendering indices are used to quantify these differences compared with lights that are assumed to render an object's true color.

Figure 7.1 “Color” results from the interaction of a light source, an object, and the eye and brain, or visual system.
A. STANDARD ILLUMINANTS
We have been describing light sources and illuminants throughout the book. Light sources are physical and their spectral measurements correspond to a specific source, reported in units of irradiance, Eλ, or radiance, Lλ. Illuminants are standardized tabulated data that are based on physical measurements. CIE standard illuminants do not have absolute radiometric units. Instead, they are defined as relative spectral power distributions, notated Sλ (CIE 2018). For some illuminants, the spectra are normalized to 100 at 560 nm. An important distinction is that most sources have equivalent illuminants whereas not all illuminants have equivalent sources. This is an acute problem for the CIE daylight series illuminants, described below.
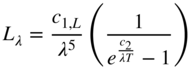
One type of standard illuminant is a blackbody radiator, also called a Planckian radiator. Blackbody radiators are materials that absorb all incident radiation, so called because at room temperature they appear black. The absorption heats the blackbody, which in turn causes it to emit its own radiation. The relationship between a blackbody's temperature and radiation is determinate (Planck 1901), and at extremely high temperatures, the radiation produces light. Planck's formula is shown in Eq. (7.1) where c1L = 3.741 774 9 × 10⁻¹⁶ W/m2‐sr‐m, c2 = 0.014 387 69 m‐K, λ is defined in meters (560 nm = 5.6 × 10⁻⁷ m), and temperature, T, is defined in kelvins
Equation (7.1) was enumerated for temperatures of 3000–6000 K, shown in Figure 7.2. The maximum radiance occurs at shorter wavelengths as temperature increases. These spectra are normalized to 100 at 560 nm and plotted in Figure 7.3. An increase in temperature increases the amount of short‐wavelength light and decreases the amount of long‐wavelength light. The color of the light becomes bluer with an increase in temperature and more orange with a decrease in temperature, and consequently, the term color temperature is used when referring to blackbody radiators.

Figure 7.2 Enumeration of Planck's formula using Eq. (7.1). (Note extended wavelength scale.)

Figure 7.3 Enumeration of Planck's formula using Eq. (7.1) and normalized to 100 at 560 nm.
The u′v′ chromaticities for blackbody radiators are shown in Figure 7.4. The chromaticities lie on a smooth contour, referred to as the blackbody or Planckian locus.

Figure 7.4 Blackbody and CIE daylight loci plotted in the u′v′ uniform chromaticity scale diagram. The blackbody locus ranges between 1000 and 10 000 K. The daylight locus ranges between 5000 and 50 000 K.
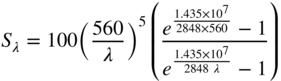
The CIE, in 1931, used Planck's formula to calculate a spectral power distribution that represented typical incandescent lighting during the early twentieth century, defined as CIE standard illuminant A (CIE 1931). The specific formula is shown in Eq. (7.2) where λ has units of nanometer. The relationship between Eqs. (7.1) and (7.2) is described in CIE (2018). Illuminant A has a CCT (defined below) of 2856 K
(The CIE also established sources and illuminants B and C, now obsolete and replaced with the CIE daylight series.)
CIE Illuminant E is another standard having a spectral power distribution that is 100 at all wavelengths.
During the 1960s, over 600 measurements were made of natural daylight during different times of day, different sky conditions, and in three locations: Rochester, New York, United States; Ottawa, Canada; and Enfield, England (Judd et al. 1964). The data were normalized at 560 nm and principal component analysis (PCA) was used (Simonds 1963) to reduce the many spectra to three: an average, Sλ,0, and two eigenvectors, Sλ,1 and Sλ,2, shown in Figure 7.5. PCA is described in Chapter . The first eigenvector corresponds to “the presence or absence of clouds in the sky, and to the inclusion or exclusion of direct sunlight” while the second eigenvector may correspond to “the presence of little or much water in the form of vapor and haze” (Judd et al. 1964). A daylight distribution is determined by adding or subtracting the two eigenvectors to the mean. The most commonly used CIE daylight spectral power distributions have CCTs of 5000 K (D50) and 6500 K (D65), shown in Figure 7.6. Indoors, window glass absorbs UV radiation changing daylight's spectral power distribution. The CIE has defined the transmittance of window glass and used it to specify indoor D65 and D50, referred to as ID65 and ID50 (CIE 2018). The spectrum for indoors D65 (ID65) is also shown in Figure 7.6. ID65 and ID50 were developed so that colorimetric calculations would better correlate with the appearance of materials containing fluorescent whitening agents viewed indoors.
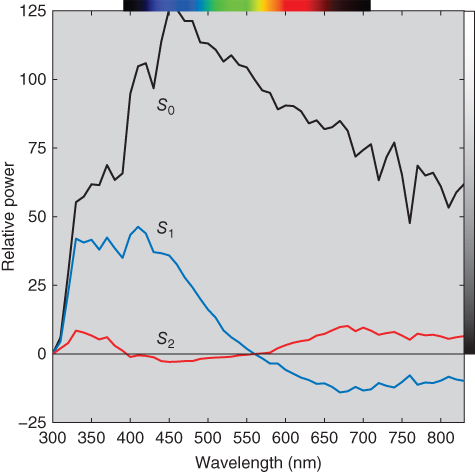
Figure 7.5 Mean, Sλ,0, and eigenvectors, Sλ,1 and Sλ,2, defining CIE daylight. (Note extended wavelength scale and relative power having both positive and negative values.)
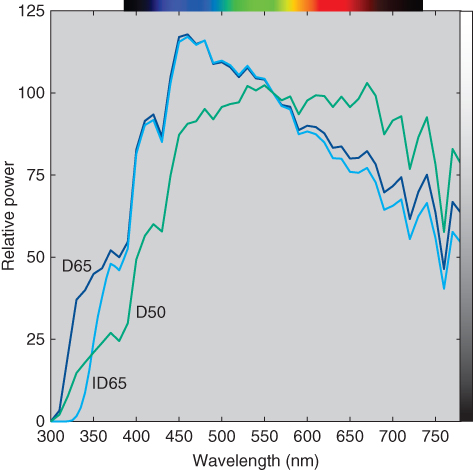
Figure 7.6 CIE illuminants D65, ID65, and D50. (Note the extended wavelength range.)
Light booth manufacturers and, to a lesser extent, color measurement instrumentation manufacturers, have always had difficulty producing a source with the same spectral power distribution as CIE daylight, particularly in the ultraviolet (UV) region (McCamy 1994). The CIE has a test method to evaluate the quality of a daylight simulator using metameric pairs that are sensitive to differences in spectral power distributions simulating daylight (ISO/CIE 2005). There are metamers for both the visible and UV regions of the electromagnetic spectrum. Depending on the magnitude of color difference, sources are rated on an alphabetic scale where category A is the best simulation and category E is the worst simulation. Categories are assigned for each spectral region, for example, BD where the first letter is the visible‐region category and the second letter is the UV‐region category. For critical visual evaluation, daylight simulators must be BC or better (ASTM 2016a). Light booths using fluorescent lamps tend to have ratings of BC while booths using filtered tungsten have ratings of BE (Lin, Shamey, and Hinks 2012; Wei and Chen 2018). Both lights can be improved to a BB rating with the addition of a separate UV source. Well simulating CIE daylight is very important when correlating whiteness indices with perceived whiteness (Lin, Shamey, and Hinks 2012) and evaluating color differences of metameric samples (Gu et al. 2016). Light booths are available that have multiple solid‐state sources that can simulate daylight to a category AD, shown in Figure 7.7.
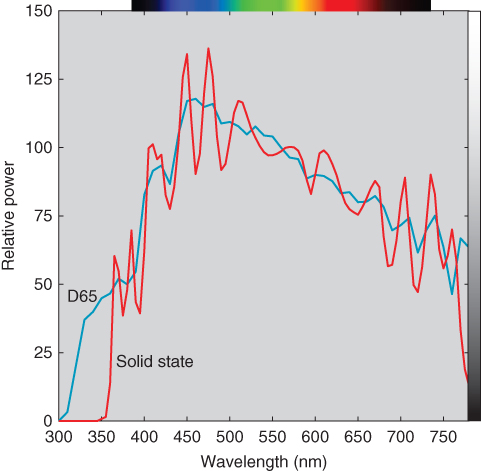
Figure 7.7 Spectral power distributions of multi‐solid‐state D65 simulator and CIE illuminant D65. (Note the extended wavelength range.)
The CIE first published illuminant data for 12 types of fluorescent sources during the 1980s, notated F1–F12. Today's fluorescent sources are slightly different and the CIE has published 15 additional spectra (FL3.1–FL3.15). There are also five high‐pressure discharge lamps (HP1–HP5), five phosphor‐type solid‐state lamps (LED‐B1–LED‐B5), a hybrid‐type solid‐state lamp (LED‐BH1), two RGB‐type solid‐state lamps (LED‐RGB1 and LED‐RGB2), and two violet‐pumped phosphor‐type solid‐state lamps (LEDV1 and LEDV2). The intent of these many illuminants is to improve correlation between colorimetry and color appearance. Common F‐series illuminants are F2, F7, F8, and F11, corresponding to cool‐white, 6500 K daylight, 5000 K daylight, and narrow‐band fluorescent, respectively. The equivalent illuminants from the FL series are FL3.2, FL3.15, FL3.6, and FL3.8. These spectra are plotted in Figure 7.8.
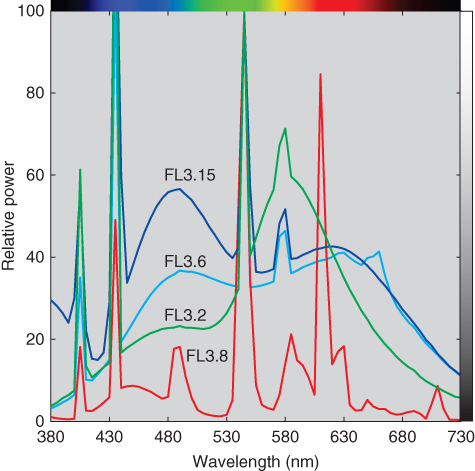
Figure 7.8 Spectral power distributions of selected CIE FL‐series illuminants.
B. LUMINANCE, ILLUMINANCE, AND LUMINOUS EFFICACY
Luminance and illuminance were defined in Chapter . For convenience, the formulas are shown again in Eqs. (7.8) and (7.9):
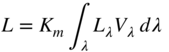
where L defines luminance and E defines illuminance. The normalizing constant, Km, equals 683 lm/W, known as the maximum luminous efficacy. A lumen is a quantity that weights light by the luminous efficiency function, Vλ. When a light source's spectral irradiance, Eλ, is measured, illuminance, E, has units of lumens per square meter, abbreviated lux or lx. When spectral radiance, Lλ, is measured, luminance, L, has units of candelas per square meter, or lumens per square meter per steradian. A candela is a unit of luminous intensity defined as 1/683 W/Sr. Illuminance is used to define the amount of light falling on a surface expressed as lx or foot‐candles (fc, lumens per square foot). Foot‐candles multiplied by 10.76 equals lx. Luminance is used to define the amount of light generated by a source. Essentially, luminance measurements are not dependent on distance; illuminance measurements are. See Wyszecki and Stiles (1982) and McCluney (2014) for greater details on photometry and radiometry.
There are two additional metrics used in lighting engineering that are also based on the luminous efficiency function. The first is the luminous efficacy of a source. It is the luminous flux emitted by a source divided by the input electrical power. Because of consumer familiarity with incandescent lighting for about 100 years, bulbs are rated by wattage, not luminous efficacy. It is understood that a 75 W bulb is brighter than a 60 W bulb. Today, there is a large range in luminous efficacy and consumers should evaluate both lumens and wattage. For example, a 60 W incandescent bulb produces about 700 lm. A solid‐state bulb requires about 10 W to produce the same number of lumens. The solid‐state bulb may be marketed as “60 W equivalent.”
The second metric is the luminous efficacy of radiation, abbreviated as LER and notated as K, the formula shown in Eq. (7.10)

This is a measure of the ability of a light source to produce a visual sensation. Ideally, radiation should only occur in the visual spectrum. Incandescent lighting is being phased out because it has poor luminous efficacy of a source and poor LER.
C. CORRELATED COLOR TEMPERATURE
Many non‐blackbody light sources can be described by the color temperature of the blackbody that they most resemble visually. This is called their correlated color temperature, abbreviated as CCT and notated at Tcp. Similarity is based on colorimetry. When an exact colorimetric match occurs, the blackbody radiator is metameric to the non‐blackbody light source. When an exact match is not possible, the blackbody radiator that leads to the minimum distance in the now obsolete CIE 1960 uv uniform chromaticity scale diagram defines the CCT of the non‐blackbody light source. The method described by Robertson (1968) is most often used for calculating CCT though other methods have been developed, summarized by Li et al. (2016).
Not all sources can be assigned a CCT. A difference metric, Duv, is calculated, shown in Eqs. (7.11)–(7.13):
where subscript t refers to the test source and subscript b refers to the blackbody source. The source must have a |Duv| ≤ 0.05 in order to assign a CCT. A source's CCT is determined by minimizing |Duv|. A positive Duv can indicate a greenish white while a negative Duv can indicate a pinkish white. The sign and magnitude of Duv are useful for determining whether a source appears white or tinted (Ohno and Fein 2014; Smet, Deconinck, and Hanselaer 2015) and can also be correlated with preferred color (Bodrogi et al. 2018).
CCT has always been an important property of lighting and today's solid‐state lights for consumer use are designed for four different CCTs: 2700 K, the nominal value of incandescent lights; 3000 K, the nominal value of tungsten‐halogen lights; 4000 K, the nominal value of cool‐white fluorescent lights, and 5000 K. The adjectives “soft,” “bright,” and “cool,” have been used for 2700, 3000, and 4000 K. Lights that are 5000 K and above tend to be labeled as “daylight.”
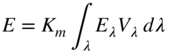
The effects of changing a light's CCT are shown in Figure 7.9 where a museum gallery space is lit identically except CCT. The common change from orange (warm) to blue (cool) as CCT increases is evident. A number of preference experiments have been performed, the goal of which is to determine an optimal CCT for viewing artwork (Scuello et al. 2004; Pinto, Linhares, and Nascimento 2008; Liu et al. 2013; Nascimento and Masuda 2014; Zhai, Luo, and Liu 2015). Unfortunately, the results depend on the experimental conditions and can be inconclusive due to large variability among observers and object‐specific results. Furthermore, studies involving museum professionals have shown strong prejudices toward specific CCTs irrespective of experimental evidence (Miller and Rosenfeld 2012).
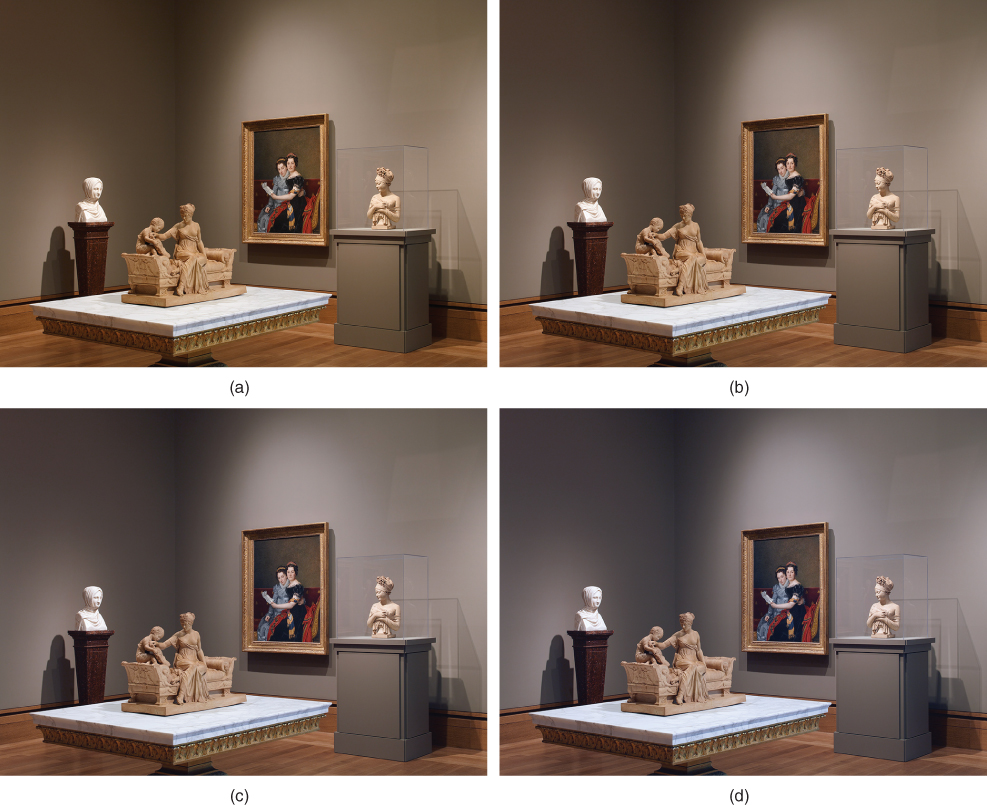
Figure 7.9 Gallery of late Neoclassicism in European art and design at the Getty Museum, Los Angeles. Lighting varies between (a) soft, (b) bright, (c) cool, and (d) daylight.
Source: Digital image courtesy of the Getty's Open Content Program.
D. COLOR RENDITION
Lights can be designed to have the same CCT and luminance such as soft‐white light made using incandescent and solid‐state technologies. Different technologies lead to different spectral radiances and as a consequence, colored objects can appear different. As an example, a sofa was illuminated by three sources with matching CCT and luminance and dissimilar spectral radiance, shown in Figure 7.10. Which color is the “true” or “natural” color of the sofa? For many people, they would want to see the sofa lit with natural daylight during the day and by incandescent during the night. In fact, one of the lights is D65 and the other two are theoretical RGB‐type solid‐state lights designed to distort colors (Berns 2011). The spectra of the three lights are plotted in Figure 7.11. Changing the wavelength location of the green primary changed the hue from cyan to purple. The sofa has been rendered differently and the lights are said to have different color rendition or color rendering.
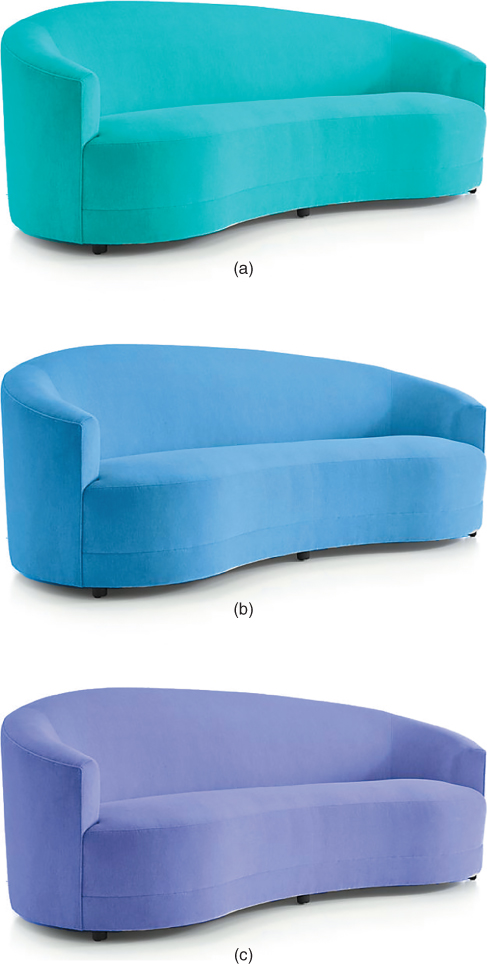
Figure 7.10 Visualization of sofa lit by (a) SS‐1, (b) D65, and (c) SS‐2.

Figure 7.11 Spectral power distributions of D65, SS‐1, and SS‐2.
Figure 7.12 Rendered cubes where the top is illuminated by D65, the left‐facing side is illuminated by SS‐1, and the right‐facing side is illuminated by SS‐2.
The need for a color rendering metric arose with the use of fluorescent lighting during the mid‐twentieth century. Warm‐white fluorescent lighting with a CCT near 2900 K rendered colors very poorly compared with incandescent lighting with the same CCT. Cool‐white fluorescent lighting, used extensively in offices and warehouses, also had poor color rendition. Research began in the 1950s (Nickerson 1960), and in 1965, the CIE recommended a method and index to quantify the color rendering of lighting (CIE 1995b). The index, known as the color rendering index, abbreviated as CRI and notated as Ra, is used universally within the lighting industry. Many of today's solid‐state lights list CRI along with wattage, lumens, and CCT on their packaging.
The key aspect of quantifying color rendering is its relative nature where a test light is compared with a reference light, the reference being either a blackbody radiator below a CCT of 5000 K or CIE daylight having a CCT of 5000 K and above. These reference illuminants are assumed to match our expectations of defining a colored object's “true color.” The reference illuminant is selected based on the test source's CCT. The colorimetric coordinates are calculated for a set of reference colors for both the test source and reference illuminant using the 1931 standard observer. A scaled total color difference between the pair of coordinates quantifies rendering accuracy and the average is used as the index, the scaling resulting in warm‐white fluorescent lighting having a Ra = 50 and the reference illuminant having a Ra = 100. There is not a lower bound. When the test source and reference illuminant have a Duv other than zero, a chromatic adaptation transformation is used to calculate corresponding colors for the reference colors transforming from the test source to reference illuminant. Details about the use of corresponding colors in a color difference calculation are given in Chapter . There are 14 reference colors, defined spectrally, the first eight of which are used to calculate Ra where subscript a denotes average. The eight were selected from the Munsell Book of Color equally sampling hue at a similar lightness and chroma (Nickerson 1960). This sampling scheme resulted in low chroma colors, problematic because low chroma samples are somewhat insensitive to lighting differences. To remedy this limitation, six more Munsell samples were selected. The 14 samples are notated as TCS1–TCS14 (test color sample) and their rendering values notated as R1–R14. TCS9 is a vivid red color and R9 is often listed in addition to Ra because many solid‐state lights render red colors poorly with a noticeable dulling.
Cubes were rendered, each having a spectral reflectance equal to the 14 samples and an additional spectrally nonselective gray, where the cubes were lit from the top by D65 and by the left and right sides by SS‐1 and SS‐2, respectively, shown in Figure 7.12. Many colors are distorted. The high chroma yellow and blue cubes, TCS10 and TCS12, resulted in quite dramatic changes when lit by these theoretical sources.
The cubes were again rendered, this time using CIE LED B‐5 and CIE FL 3.15, both representing commercial lights. The rendering is shown in Figure 7.13 and their spectral power distributions are shown in Figure 7.14. The changes in rendering are less severe than SS‐1 and SS‐2 but still noticeable. The three CIE illuminants, D65, LED B‐5, and FL 3.15 were used to render a steak, shown in Figure 7.15, illustrating the importance of excellent rendition of red colors. The dulling of the steak's color when illuminated by LED B‐5 demonstrates the problem with some solid‐state lights. The Ra and R9 for the five illuminants are listed in Table 7.1. The values for SS‐1 and SS‐2 are extremely low. The lack of long‐wavelength radiance of LED B‐5 results in Ra = 80 and R9 = 7. The fluorescent lamp has excellent color rendering with values near 100.
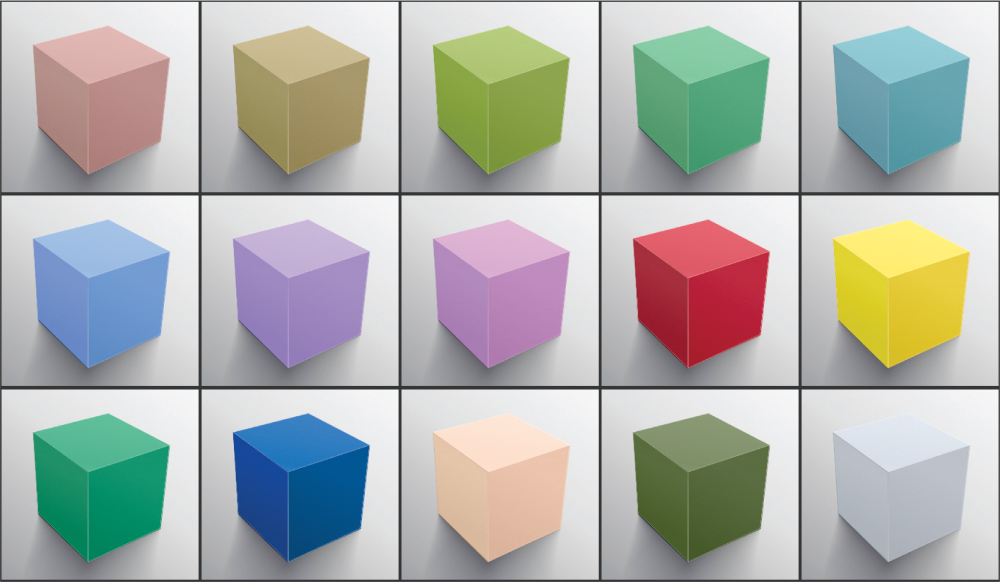
Figure 7.13 Rendered cubes where the top is illuminated by D65, the left‐facing side is illuminated by LED B‐5, and the right‐facing side is illuminated by FL 3.15.
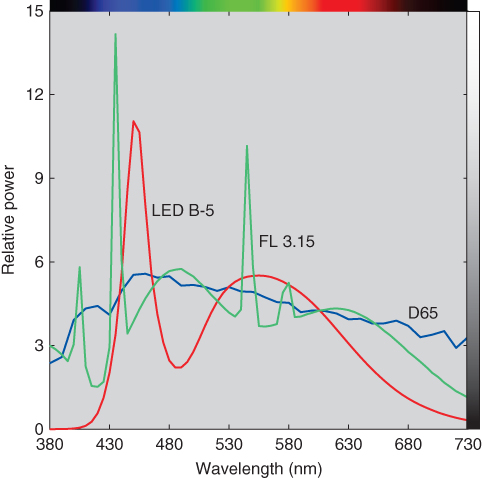
Figure 7.14 Spectral power distributions of D65, LED B‐5, and FL 3.15.
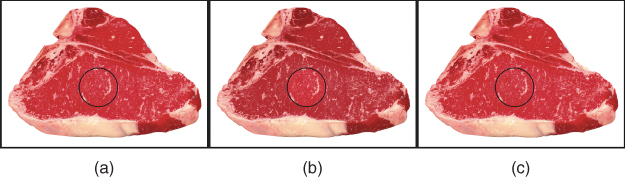
Figure 7.15 Color rendering of a steak using CIE illuminants D65 (a), LED B‐5 (b), and FL3.15 (c). The circular cutout is the steak's color illuminated by D65. For this simulation, the average spectral reflectance of the muscle equaled the spectral reflectance of TCS9.
Table 7.1 Lighting metrics for each listed illuminant.
| Metric | D65 | SS‐1 | SS‐2 | LED B‐5 | FL3.15 |
| CCT | 6503 | 6503 | 6503 | 6598 | 6508 |
| Duv | 0.0032 | 0.0032 | 0.0032 | 0.0009 | 0.0031 |
| LER | 204 | 141 | 210 | 305 | 235 |
| CIE Ra | 100 | −45 | 32 | 80 | 98 |
| CIE R9 | 100 | −463 | −11 | 7 | 96 |
| IES Rf | 100 | 5 | 19 | 77 | 99 |
| IES Rg | 100 | 93 | 95 | 94 | 101 |
The CIE method of quantifying color rendering has long been criticized, summarized by Houser et al. (2013). The eight samples are a particular problem because of their low chroma and as a consequence, the index has low sensitivity. The color‐difference calculation is based on an obsolete color space with poor correlation to perceived color differences and as a consequence, there is an imbalance between hues. These deficiencies have resulted in poor correlation when CRI is used to predict visual judgments of fidelity, particularly for narrow‐band fluorescent and solid‐state lights. CRI is a scaled total color difference, and all the limitations of ΔE apply to CRI. A total color difference discards the direction of difference and whether the difference is attributed to hue, lightness, or chroma. These limitations can be easily remedied and the published literature has many examples, also summarized by Houser et al. (2013). Unfortunately, the CIE has been unsuccessful in updating its method.
Reproducing the color rendering of a reference illuminant does not lead to preferred color rendition. Consumers tend to prefer sources that slightly increase vividness (Ohno, Miller, and Fein 2015; Khanh et al. 2017). Judd (1967) and later Thornton (1974) modified CRI so that the test colors' reference chromaticities were changed corresponding to an increase in vividness. A light source that increased vividness would have a preference index greater than the reference source and a rendering index less than the reference source. Unfortunately, neither index was adopted by the lighting industry and the CIE did not pursue a CPI (color preference index) as a companion to CRI.
Preferred color rendition and the need for two indices were revived by Rea and Freyssinier‐Nova (2008, 2010). The area of the bounding octahedron defined by the chromaticities of the eight test color samples was calculated for the test source. Rather than comparing this area to the area calculated for the reference illuminant, they compared the test source area to a single reference illuminant, the equal energy spectrum. They called this the gamut area index, abbreviated as GAI. The authors found that both CRI and GAI were important to predict the color rendering properties of electric lighting.
The Illuminating Engineering Society of North America (IESNA), in 2015, developed a new method to evaluate color rendering (David et al. 2015; IESNA 2015). There are three significant differences compared with the CIE method. First, there are 99 reflectance spectra, selected based on their spectral characteristics and their color. Second, a color appearance space is used. Third, two indices are reported. One index quantifies color fidelity, notated as Rf. It is an updated Ra. The second index quantifies gamut area, notated as Rg. It is an updated GAI. The IES indices for the five sources are also listed in Table 7.1. Rf led to the same ranking as Ra though the values are very different. SS‐1, SS‐2, and LED B‐5 have very similar Rg values, and these values below 100 indicate that all three sources reduce vividness, clearly not the case when evaluating the rendered cubes. This limitation is typical of indices based on averages. For color‐critical applications, each hue region needs to be evaluated individually. This is shown in Figures 7.16 and 7.17 comparing SS‐1 and LED B‐5 using software provided by IESNA.

Figure 7.16 Percentage change of chroma as a function of hue angle region for solid‐state light SS‐1.

Figure 7.17 Percentage change of chroma as a function of hue angle region for solid‐state light LED B‐5.
The CIE recently issued a technical report describing a color fidelity index, Rf, “for accurate scientific use” (CIE 2017). This index is very similar to the index developed by IESNA. The report notes that the CIE Rf is not a replacement for CRI and that replacing CRI “will be a matter of future study…” As consumers, we hope that one day, CRI will be replaced with one or more indices that will enable us to make more informed purchase decisions.
E. SUMMARY
A light source can be defined in a number of ways. In many cases, it can be represented by a CIE standard illuminant of which there are many to choose from. CIE illuminants are used when defining colors colorimetrically and when setting tolerances. If we are producing a material to match a colorimetric specification, visual validation may be necessary. It is important that the lighting well represents the illuminant. This has always been a challenge when the standard illuminant is D50 or D65. There is a standard for defining the quality of a CIE daylight simulator in both the visible and UV wavelength regions. General purpose white lighting is defined by lumens, energy efficiency, correlated color temperature (CCT), and color rendering. Lumens correlate with brightness based on our experiences with incandescent lighting. Light sources are now manufactured with high energy efficiency and incandescent lighting is being phased out because of its poor energy efficiency. CCT indicates whether the white light appears soft, bright, cool, daylight, or other similar terminology. Color rendering is a measure of a light's naturalness. The CIE color rendering index (CRI) indicates whether a source renders familiar colors in the same way as daylight or incandescent lighting. It is a measure of total color difference and for some applications, the direction of change is also important. There is a preference for sources that increase vividness and indices have been derived that improve upon CRI and measure the change in vividness.