
3.2. Traditional Derivation of EM
Each EM iteration is composed of two steps—Estimation (E) and Maximization (M). The M-step maximizes a likelihood function that is further refined in each iteration by the E-step. This section derives the traditional EM and establishes its convergence property.
3.2.1. General Analysis
The following notations are adopted.
X = {xt ∊ ℜD; t = 1, …, T} is the observation sequence, where T is the number of observations and D is the dimensionality of xt.
C = {C(1), …, C(J)} is the set of cluster mixture labels, where J is the number of mixture components.
Z = {zt ∊ C; t = 1, …, T} is the set of missing data (specifying the hidden-state information).
θ = {θ(j); j = 1, …, J} is the set of unknown parameters that define the density function for approximating the true probability density of X.
θ(j)= {π(j), φ(j)}, where π(j) denotes the prior probability of the j-th component density and φ(j) defines the j-th component density.
Note that the combination of observations X and the "hidden-states" Z constitute the complete-data. The likelihood of the complete-data is instrumental in accordance with the EM formulation.
To facilitate the derivation, define
Equation 3.2.1
![]()
as the log-likelihood of the incomplete-data given the current estimate θn, where n represents the iteration index; also, define p(Z, X|θn) as the completed data likelihood. According to probability theory, [1] p(X|θn) can be expressed as
[1] Hereafter, a capital P denotes probabilities and a lowercase p denotes density functions.
Equation 3.2.2
![]()
Using Eq. 3.2.1 and Eq. 3.2.2, one can write the incomplete-data log-likelihood as follows:
Equation 3.2.3
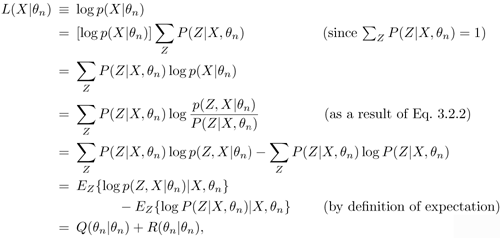
where EZ{} denotes expectation with respect to Z. Thus, denote
Equation 3.2.4
![]()
Equation 3.2.5
![]()
where R(θ|θn) is an entropy term representing the difference between the incomplete-data likelihood and the expectation of the completed-data likelihood. Interpretation of R(θ|θn) and its role in the EM algorithm is discussed further in Section 3.3.
3.2.2. Convergence Property of EM
The following demonstrates why the EM algorithm has a general convergence property. The basic idea is via Jensen's inequality. More precisely, it can be shown that if the Q-function in Eq. 3.2.4 is improved in each iteration (in the M-step), then so will be the likelihood function L.
The proof of convergence begins with the observation of the following relationship:
Equation 3.2.6
![]()
Using Eq. 3.2.6 and Jensen's inequality, this is obtained:
Equation 3.2.7
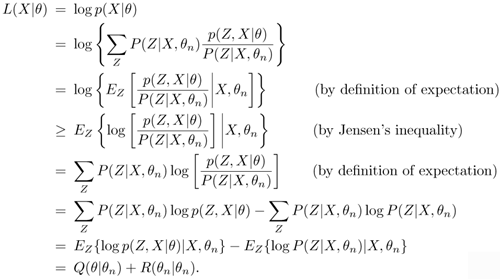
In the M-step of the n-th iteration, 0* is selected according to
Equation 3.2.8
![]()
This means one can always choose a θ* at iteration n such that
Equation 3.2.9
![]()
Note that this equation constitutes a sufficient condition to ensure the convergence property of the EM algorithm because, according to Eqs. 3.2.3, 3.2.7, and 3.2.9

Instead of directly maximizing L(X|θ), the EM algorithm divides the optimization problem into two subproblems: Expectation and Maximization.
In each EM iteration, the E-step computes Q(θ|θn) using a set of presumed model parameters θn. The M-step determines the value of 0 (say θ*) that maximizes Q(θ|θn); that is,
Equation 3.2.10
![]()
This results in (see Problem 8)
Equation 3.2.11

Dividing the optimization into two interdependent steps is most useful if optimizing Q(θ|θn) is simpler than that of L(X|θn). Figure 3.4 illustrates how the E-and M-steps interplay to obtain a maximum-likelihood solution. The next section explains how to compute Q(θ|θn) in the E-step and how to maximize Q(θ|θn) in the M-step.
Figure 3.4. The flow of the EM algorithm.

Generalized EM
In case θ* in Eq. 3.2.8 is difficult to attain, the EM approach is still applicable if one can improve Q(θ|θn) in each M-step (e.g., by gradient ascent). The algorithm is known as generalized EM. Although convergence of generalized EM is slower than that of the standard EM, it offers a more general and flexible framework for dividing the optimization process into the EM steps.
3.2.3. Complete-Data Likelihood
EM begins with an optimization of a likelihood function, which may be considerably simplified if a set of "missing" or "hidden" data is assumed to be known. The following demonstrates that computing the expectation of the complete-data likelihood in the E-step can be accomplished by finding the expectation of the missing or hidden data.
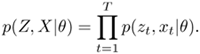
If X = {xt; t = 1,..., T} contains T statistically independent vectors and Z = {zt ∊ C; t = 1,..., T}, where zt = C(j) means that the j-th mixture generates xt, then one can write p(Z, X|θ) as
Now, a set of indicator variables is introduced to indicate the status of the hidden-states: [2]
[2] For illustration simplicity, assume that the missing data is in discrete form or the hidden data is the cluster membership.
![]()
where
![]()
Since for each t only one of the terms in ![]() is equal to one and all of the others are equal to 0, one can express p(Z, X|θ) as follows:
is equal to one and all of the others are equal to 0, one can express p(Z, X|θ) as follows:
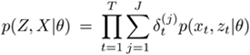
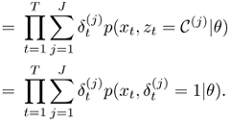
Hence, the completed-data likelihood is given by
Equation 3.2.12

where π(j) is the mixing coefficient of the j-th mixture. Eq. 3.2.12 uses the fact that ![]() and
and ![]() . Moreover, because there is only one non-zero term inside the summation
. Moreover, because there is only one non-zero term inside the summation ![]() , one can extract
, one can extract ![]() from the log function without affecting the result.
from the log function without affecting the result.
E-Step
Taking the expectations of Eq. 3.2.12 and using the defintions in Eq. 3.2.4, one obtains
Equation 3.2.13

Then, define
![]()
and denote ![]() as the j-th mixture coefficient at iteration n. Using the Bayes theorem, one can express
as the j-th mixture coefficient at iteration n. Using the Bayes theorem, one can express ![]() as
as
![]()
Equation 3.2.14

The E-step determines the best guess of the membership function ![]() . Once the probability
. Once the probability ![]() are computed for each t and j, Q(θ|θn) can be considered as a function of θ. In the M-step of each iteration, this function is maximized to obtain the best value of θ (denoted as θ*). In most cases, the M-step is substantially simplified if
are computed for each t and j, Q(θ|θn) can be considered as a function of θ. In the M-step of each iteration, this function is maximized to obtain the best value of θ (denoted as θ*). In most cases, the M-step is substantially simplified if ![]() are known. Therefore, the E-step can be viewed as a preparation step for the M-step.
are known. Therefore, the E-step can be viewed as a preparation step for the M-step.
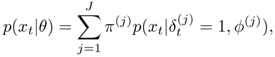
3.2.4. EM for GMMs
To better illustrate the EM steps, a simple example applying EM to Gaussian mixture models (GMMs) is presented next. The most common forms for the mixture density are the radial basis functions (RBFs) or the more general elliptical basis functions (EBFs). In the latter case, the component density ![]() is a Gaussian distribution, with the model parameter of the j-th cluster φ(j) = {μ(j), Σ(j)}I consisting of a mean vector and a full-rank covariance matrix.
is a Gaussian distribution, with the model parameter of the j-th cluster φ(j) = {μ(j), Σ(j)}I consisting of a mean vector and a full-rank covariance matrix.
Assume a Gaussian mixture model:
![]()
where π(j), μ(j) and Σ(j) denote, respectively, the mixture coefficient, mean vector, covariance matrix of the j-th component density. The GMM's output is given by
Equation 3.2.15
where
Equation 3.2.16
![]()
is the j-th Gaussian density of the GMM. A closer look at Eqs. 3.2.15 and 3.2.16 reveals that the GMM parameters θ can be divided into two groups: one containing π(j)s and another containing μ(j)s and ∑(j)s. The former indicates the importance of individual mixture densities via the prior probabilities π(j)s, whereas the latter is commonly regarded as the kernel parameter defining the form of the mixture density. Unlike other optimization techniques (e.g., gradient descent) in which unknown parameters can be arranged in any order, the EM approach effectively makes use of the structural relationship among the unknown parameters to simplify the optimization process.
After the initialization of θ0, the EM iteration is as follows:
-
E-step.
In the n-th iteration, compute
 (xt) for each j and t using Eqs. 3.2.14 and 3.2.16. This is followed by the M-step described next.
 -
M-step.
Maximize Q(θ|θn) with respect to θ to find θ*. Replace θn by θ*. Then, increment n by 1 and repeat the E-step until convergence.
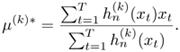
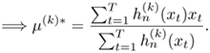
To determine μ(k)*, set ![]() , which gives
, which gives
Equation 3.2.17
To determine Σ(k)*, set ![]() , which gives
, which gives
Equation 3.2.18

To determine π(k)*, maximize Q(θ|θn) with respect to π(k) subject to the constraint ![]() , which gives
, which gives
Equation 3.2.19

The detailed derivations of Eq. 3.2.17 to Eq. 3.2.19 are as follows:
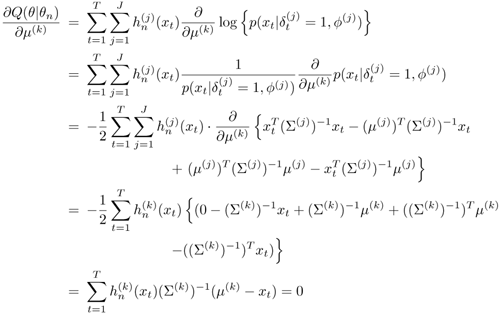
Equation 3.2.20
To determine Σ(k)*, k = 1,..., J, let Λ(k)) = (Σ(k))−1 and set ![]() , that is,
, that is,
Equation 3.2.21
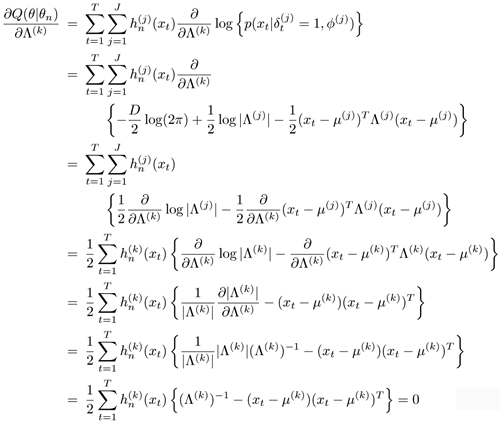
Equation 3.2.22
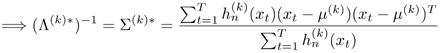
Note that Eq. 3.2.21 makes use of the identity ![]() , where A is a symmetric matrix. Note also that one can replace μ(k) by μ(k)* in Eq. 3.2.20 to obtain Eq. 3.2.18.
, where A is a symmetric matrix. Note also that one can replace μ(k) by μ(k)* in Eq. 3.2.20 to obtain Eq. 3.2.18.
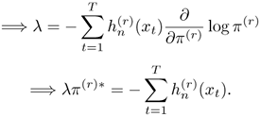
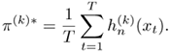
To determine π(r), r = 1,..., J, maximize Q(θ|θn) with respect to π(r) subject to the constraint ![]() . More specifically, maximize the function f(λ, π(j)) =
. More specifically, maximize the function f(λ, π(j)) = ![]() where A is the Lagrange multiplier. Setting
where A is the Lagrange multiplier. Setting ![]() results in
results in
Equation 3.2.23
![]()
Equation 3.2.24
Summing both size of Eq. 3.2.24 from r = 1 to J, one has
Equation 3.2.25
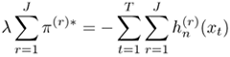
Equation 3.2.26
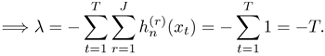
Substituting Eq. 3.2.26 into Eq. 3.2.24 results in
Equation 3.2.27
Complexity of EM
Let T denote the number of patterns, J the number of mixtures, and D the feature dimension, then the following is a rough estimation of the computation complexity of using EM to train a GMM:
-
E-step.
 (TJD + TJ) for each epoch.
 -
M-step.
 (2TJD) for each epoch.
Numerical Example 1
This example uses the data in Figure 3.3(a) as the observed data. Assume that when EM begins, n = 0 and
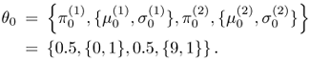
Therefore, one has
Equation 3.2.28
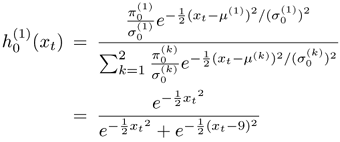
and
Equation 3.2.29
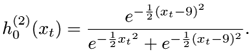
Substituting X = {1, 2, 3, 4, 6, 7, 8} into Eqs. 3.2.28 and 3.2.29, Table 3.1 is obtained. Substituting ![]() in Table 3.1 into Eqs. 3.2.17 through 3.2.19 results in
in Table 3.1 into Eqs. 3.2.17 through 3.2.19 results in
| Pattern Index (t) | Pattern (xt) | ||
|---|---|---|---|
| 1 | 1 | 1 | 0 |
| 2 | 2 | 1 | 0 |
| 3 | 3 | 1 | 0 |
| 4 | 4 | 1 | 0 |
| 5 | 6 | 0 | 1 |
| 6 | 7 | 0 | 1 |
| 7 | 8 | 0 | 1 |
![]()
Then, continue the algorithm by computing Q(θ|θn) -that is, ![]() —which are then substituted into Eqs. 3.2.17 through 3.2.19 to obtain θ2.
Figure 3.5 depicts the movement of the component density functions specified by μ(j) and σ(j) during the EM iterations, and Table 3.2 lists the numerical values of Q(θ|θn) and θn for the first five iterations. It is obvious that the algorithm converges quickly in this example.
—which are then substituted into Eqs. 3.2.17 through 3.2.19 to obtain θ2.
Figure 3.5 depicts the movement of the component density functions specified by μ(j) and σ(j) during the EM iterations, and Table 3.2 lists the numerical values of Q(θ|θn) and θn for the first five iterations. It is obvious that the algorithm converges quickly in this example.
Figure 3.5. Movement of the component density function specified by μ(j) and (σ(j))2 for the first two EM iterations.

| Iteration (n) | Q(θ|θn) | ||||
|---|---|---|---|---|---|
| 0 | -∞ | 0 | 1 | 9 | 1 |
| 1 | -43.71 | 2.50 | 1.25 | 6.99 | 0.70 |
| 2 | -25.11 | 2.51 | 1.29 | 7.00 | 0.68 |
| 3 | -25.11 | 2.51 | 1.30 | 7.00 | 0.67 |
| 4 | -25.10 | 2.52 | 1.30 | 7.00 | 0.67 |
| 5 | -25.10 | 2.52 | 1.30 | 7.00 | 0.67 |