11. Recovery and Purification of Products
The recovery and purification of a fermentation product is essential to any commercial process. The difficulty entailed depends heavily on the nature of the product. Products may be the biomass itself, an extracellular component, or an intracellular component. Since the chemical nature of a fermentation or cell culture broth is quite complex and extremely high purity is required for some products (e.g., some pharmaceuticals), recovery and purification often require many processing steps and in many cases represent a manufacturing cost higher than that involved in producing the product. Since the compounds of interest are often heat or oxygen sensitive and present in dilute aqueous solution, the traditional separation techniques of the chemical engineer must be augmented with more specialized ones.
11.1. Strategies to Recover and Purify Products
Recovery and purification are major expenses in production of most fermentation products; often they comprise more than 50% of the total manufacturing costs, especially for an intracellular product. There is an excellent correlation between the price of a product (on a per-kg basis) and how dilute the product is as it exits the bioreactor. For example, the concentration of citric acid is on the order of 100 g/l when it enters recovery processes and sells for order of 3 $/kg, while a therapeutic protein might be at the concentration of 0.00001 g/l and sells for 100,000,000 $/kg (although with modern production techniques most proteins now can be produced at much higher concentration). The efficiency of the production process and the difficulty and cost of the recovery and purification processes are tightly coupled.
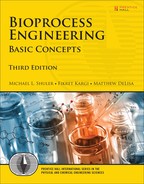
The major unit operations used for product recovery and purification and the major principles of separations are summarized in Figure 11.1. Separation methods vary with the size and nature of the product, and a number of different methods may need to be used for a fermentation or cell culture broth containing soluble products of different molecular size. The size range of products is large (e.g., small molecules, enzymes, therapeutics, and clean water), and the separation process must be configured to effectively make the product. Figure 11.2 summarizes the major steps involved in the separation and purification for many small molecule and protein products.
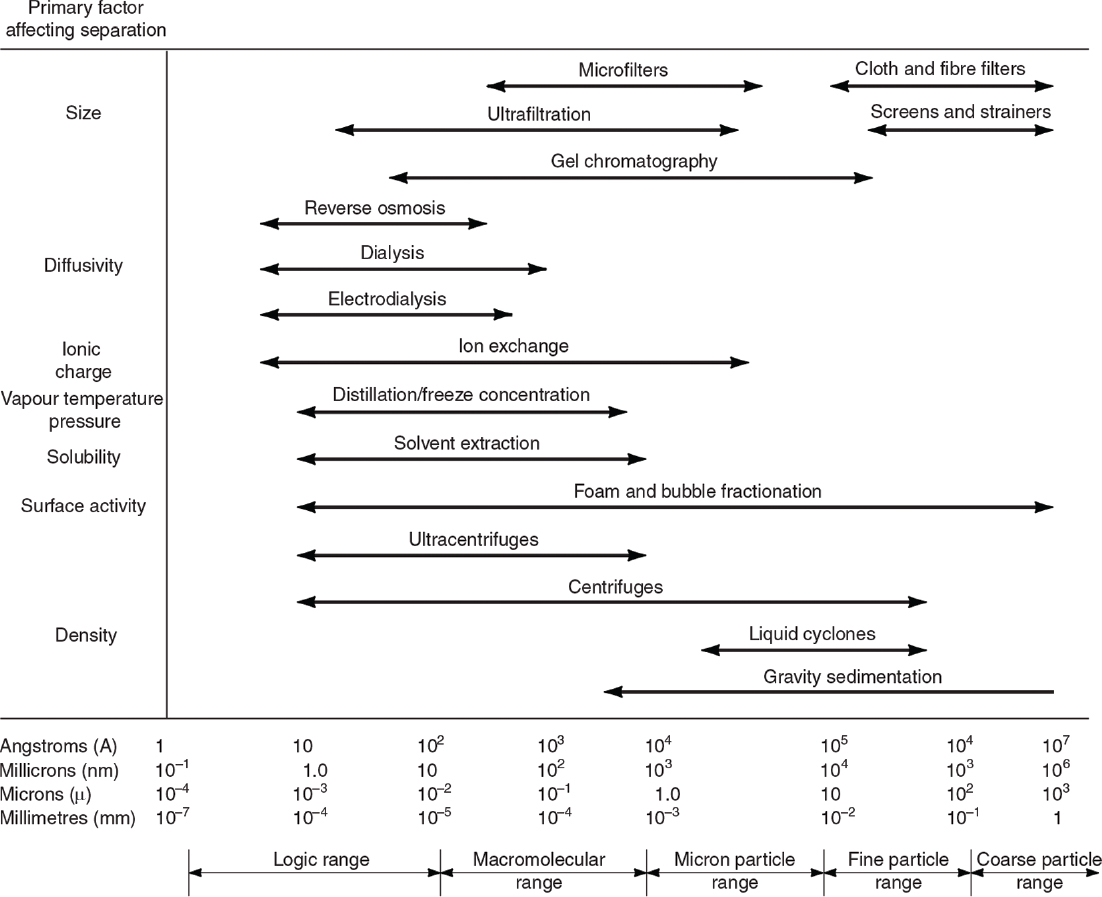
Figure 11.1. Ranges of applications of some standard unit operations. (B. Atkinson and F. Mavituna, Biochemical Engineering and Biotechnology Handbook, Macmillan, Inc., New York, 1983. Reproduced with permission of Palgrave Macmillan.)
The strategy in Figure 11.2 can be generalized to involve four primary functions: separation of insoluble products and other solids, primary isolation or concentration of product and removal of most of the water, purification or removal of contaminating chemicals, and product preparation, such as drying. Process economics dictate that water must be removed very early in the process train so that the size of the equipment in the following steps will be minimized. Because a step designed primarily to concentrate product and the steps designed to remove contaminating chemicals often remove solvent, there is no distinct separation between steps 2 and 3. The same operations to recover soluble products can apply to both steps 2 and 3. First, however, we consider those steps that remove solids, such as cells or the insoluble material.
11.2. Separation of Insoluble Products
The separation of solids such as biomass, insoluble particles, and macromolecules from the fermentation broth is usually the first step in product recovery. In some cases, the broth may need to be pretreated to facilitate solids separation. Examples of pretreatment are heat treatment, pH and ionic strength adjustment, and the addition of coagulants and flocculants. If the product is biomass, then separation of solids is the major step in product recovery, which results in a significant volume reduction. If the product is a soluble compound, solids need to be separated from liquid before the liquid is further treated to recover and purify the soluble product. For the recovery of intracellular products, the cells need to be disrupted and other cellular products need to be separated from the desired product. The major methods used for the separation of cellular material (biomass) are filtration (both rotary vacuum filtration and micro- or ultrafiltration), centrifugation, and coagulation and flocculation.
11.2.1. Filtration
Filtration is probably the most cost-effective method for the separation of large solid particles and cells from cultivation broths. The broth is passed through a filter medium, and a filter cake is formed as a result of deposition of solids on the filter surface. Continuous rotary filters or rotary vacuum precoat filters are the most widely used types in the fermentation industry and for wastewater treatment. The drum is covered with a layer of precoat, usually of diatomaceous earth, prior to filtration. A small amount of coagulating agent or filter aid is added to the broth before it is pumped into the filter. As the drum rotates under vacuum, a thin layer of cells adheres to the drum. The thickness of the cell layer increases in the section designed for forming the cake. The layer of solids is washed and dewatered during its passage to the discharge point, where a knife blade cuts off the cake. A vacuum maintained in the drum provides the driving force for liquid and air flow. A schematic of a continuous rotary vacuum filter is shown in Figure 11.3.

Figure 11.3. Schematic of a continuous rotary vacuum filter. A vacuum (subatmospheric pressure) is maintained within the drum, causing the pressure-driven flow of liquid (during cake formation) and air (during dewatering).
Filtration is commonly used for separating mycelium from fermentation broth in antibiotic fermentations. It is also commonly used in waste-water treatment facilities. For production of therapeutic proteins, deep-bed filtration using disposable media is typically used instead of rotary vacuum filtration.
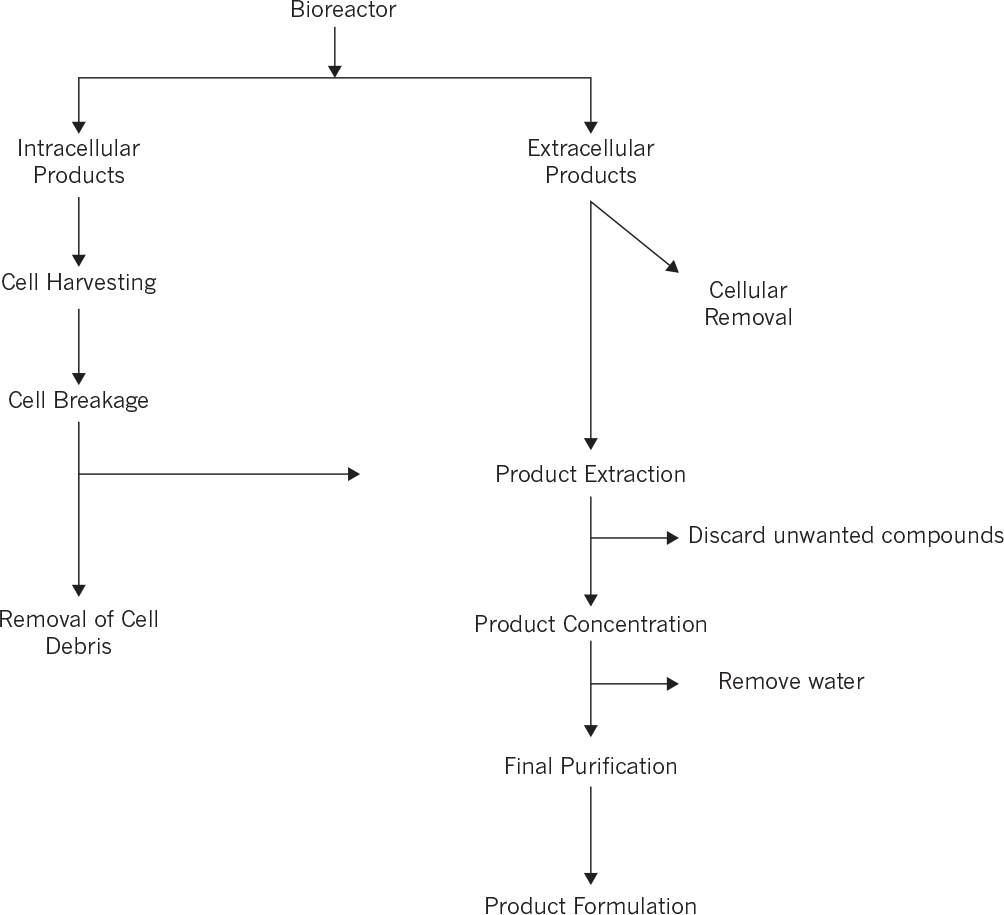
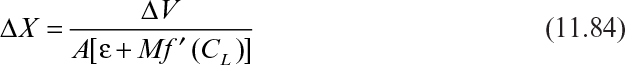
The rate of filtration (the flow of filtrate) for a constant-pressure (vacuum) filtration operation is determined primarily by the resistance of the cake and filter medium:
where V is the volume of filtrate, A is the surface area of the filter, Δp is the pressure drop through the cake and filter medium, μ is the viscosity of the filtrate, rm is the resistance of the filter medium, and rc is the resistance of the cake. The value of rm is characteristic of the filter medium. However, the cake resistance, rc, increases during filtration, and after a start-up period, rc exceeds rm. The value of rc is given by

where W is the total weight of the cake on filter, C is the weight of the cake deposited per unit volume of filtrate, and is the average specific resistance of the cake.
The total weight of cake is related to the total volume of filtrate:
Substituting equations 11.2 and 11.3 into equation 11.1 with constant A gives

Integration of equation 11.4 from V = 0 to V = V and t = 0 to t = t yields
where V0 and K are defined as

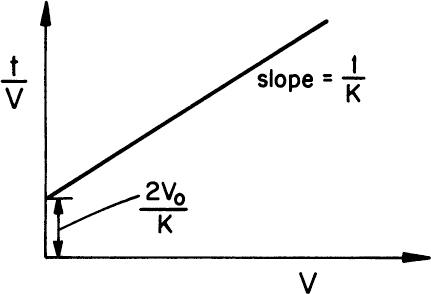
Equation 11.5 is known as the Ruth equation for constant-pressure filtration and can be rearranged as follows:

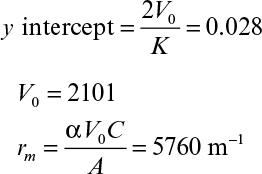
A plot of t/V versus V yields a straight line with a slope of 1/K and intercept of 2V0/K, as depicted in Figure 11.4. The values for rm and α are calculated from experimentally determined values of K and V0.
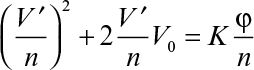
In a rotating drum filter (like the one shown in Figure 11.3), the drum rotates at a constant speed (n rps) and only a fraction of drum-surface area is immersed in suspension reservoir (φ). The period of time during which filtration is carried out is φ/n per revolution of the drum. Equation 11.5 can be rewritten in this case as
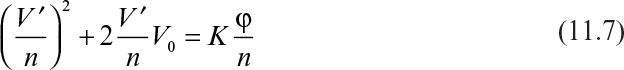
where V′ = filtrate volume per unit time (volume/time) and V′/n V′/n represents the volume of filtrate filtered for one revolution of the drum.
This analysis of filtration is based on several assumptions; the primary one is an incompressible cake, which results in constant specific cake resistance. Usually, fermentation cakes are compressible, so α varies with Δp. The concentration of filter aid (1% to 5%) also has a significant effect on specific cake resistance. As depicted in Figure 11.5, the specific cake resistance decreases as the concentration of filter aid increases. The filterability of fermentation broth is also affected by fermentation conditions. The pH, viscosity, and composition of the medium affect the cake resistance. Specific cake resistance decreases with decreasing pH. The coagulation of mycelial protein with heat treatment improves the filterability of the fermentation broth in mycelial fermentations such as penicillin. The duration of fermentation also affects filterability and antibiotic activity in penicillin fermentations and represents an example of the interplay of upstream processing (e.g., fermentation) with downstream processing. Fermentation times of 180 to 200 h are used in penicillin fermentations to minimize the cake resistance and maximize antibiotic activity. Typical filtration conditions for streptomycin fermentations are pH = 3.6, 2% to 3% filter aid, following a heat treatment of 30 to 60 min at T = 80° to 90°C.
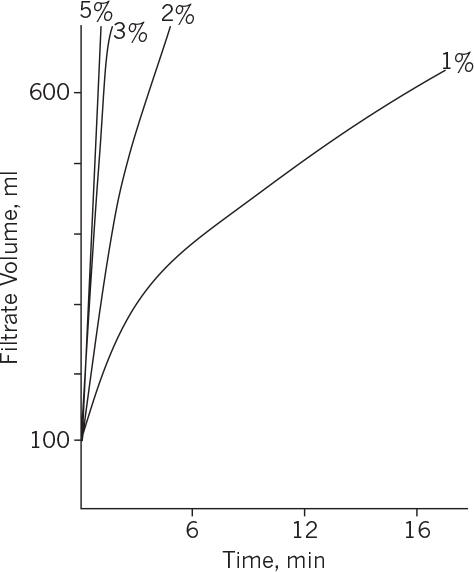
Figure 11.5. Effect of filter aid on filtration performance. Filtration rate increases by increasing the filter aid concentration from 1% to 3%.
Cell separation can also be accomplished by cross-flow filtration using ultrafiltration or microporous filtration. These systems are described in more detail in Section 11.4.7. This technique has achieved rather rapid acceptance and has replaced centrifugation and vacuum filtration in some applications. Cross-flow filtration is well suited to the removal of dispersed cells such as E. coli and yeast, as well as larger, shear-sensitive cells from mammals. Microporous filters with pores of 0.02 and 0.2μm are useful for bacterial separations, while larger sizes 0.2 to 2 μm can be used with yeast.
A = 0.28 m2, C = 1920 kg/m3, μ = 2.9 × 10⁻³kg/m-s, α = 4 m/kg
a. Determine the pressure drop across the filter.
b. Determine the filter medium resistance (rm).
c. Determine the size of filter for the same pressure drop to process 4000 l of cell suspension in 20 min.
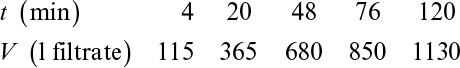
a. We apply equation 11.6, as illustrated in Figure 11.4:
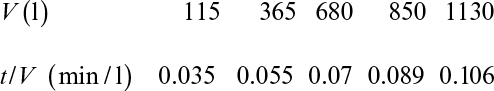
A plot of t/V versus V results in a straight line with a slope of 0.67 × 10⁻⁴ (min/l2) and an intercept of 0.028 (min/l):
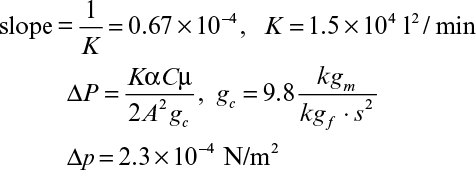
b. We calculate the values of rm from the y intercept in Figure 11.4:
c. We calculate the required area from the Ruth equation (11.5):
V2 + 2VV0 = Kt
where K = (2A2/αCμ)Δpgc and V0 = (rmA/αC). By substituting numerical values for V, Δp, and t, we obtain
A2 – 25A – 66.67 = 0
The solution to the quadratic equation yields
A = 27.43 m2
11.2.2. Centrifugation
Centrifugation is used to separate particles of size between 100 and 0.1 μm from liquid by centrifugal forces. The theory of solid–liquid separations in a gravitational field should be clearly understood before centrifugal and gravity separations such as sedimentation are covered. Particle settling in a high-particle-density suspension is known as hindered settling, as these particles interact with each other.
The major forces acting on a solid particle settling in a liquid by gravitational forces are gravitational force (FG), drag force (FD), and buoyant force (FB). When the particles reach a terminal settling velocity, forces acting on a particle balance each other, resulting in a zero net force:
where
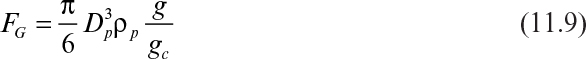
and

FD is the drag force exerted by the fluid on solid particles, CD is the drag coefficient, ρf is fluid density, U0 is the relative velocity between the fluid and particle or the terminal velocity of a particle, and A is the cross-sectional area of the particles perpendicular to the direction of fluid flow; for a sphere, ![]() For spherical particles, when Rep < 0.3, the drag force, FD, is given by the Stokes equation:
For spherical particles, when Rep < 0.3, the drag force, FD, is given by the Stokes equation:
Substitution of equation 11.12 into equation 11.11 results in the following relationship between CD and Rep:
When Rep is between 1 and 10,000, CD for a sphere is approximated as
where Rep = DpU0ρf/μ.
Substitution of equations 11.9, 11.10, and 11.12 into equation 11.8 results in

or
where Dp and ρp are particle diameter and density, respectively.
In a centrifugal field, the terminal separation velocity of particles, U0c, is given by the following equation, where the centrifugal acceleration is substituted for the gravitational acceleration:

or
where Z = rω2/g is the centrifugal factor, r is the radial distance from the central axis of rotation, and ω is angular velocity of rotation (ω = 2πNr).
The analysis presented so far is valid only for dilute cell suspensions where particle–particle interactions are negligible. When particle concentration is high, particles interact to form a swarm, and their terminal velocity decreases from U0 to U. This is known as hindered settling. The separation of cells or particles in a centrifugal field is similar to hindered settling under gravity, since particle concentration is high under centrifugation conditions.
In hindered settling, the drag force on particles is

where U is the terminal velocity of the particles under hindered-settling conditions in a gravitational field, L is the average distance between adjacent particles, and β0 is the hindered-settling coefficient. β0 is 1.6 for a rectangular arrangement of particles. In dilute solutions, Dp/L << 1, so ![]() approaches FD. Hindered settling becomes important when Dp and L are comparable.
approaches FD. Hindered settling becomes important when Dp and L are comparable.
The parameter β0 is a function of α, the volume fraction of particles, and the shape of the particles. The following can be shown:
where α′ is empirically correlated with α and depends on particle shape also. Uc is the terminal velocity of the particles of a given size and shape in the centrifugal field under conditions of hindered settling.
When designing or sizing a centrifuge, we are concerned primarily with the capacity of the centrifuge to handle a given flow rate of broth. If we know both the velocity of the particle in the centrifugal field and the distance the particle must travel to be captured, then we can proceed with the design.
Examples of two popular centrifuges are shown in Figure 11.6. Clearly, the geometry of the centrifuge influences the travel distance.
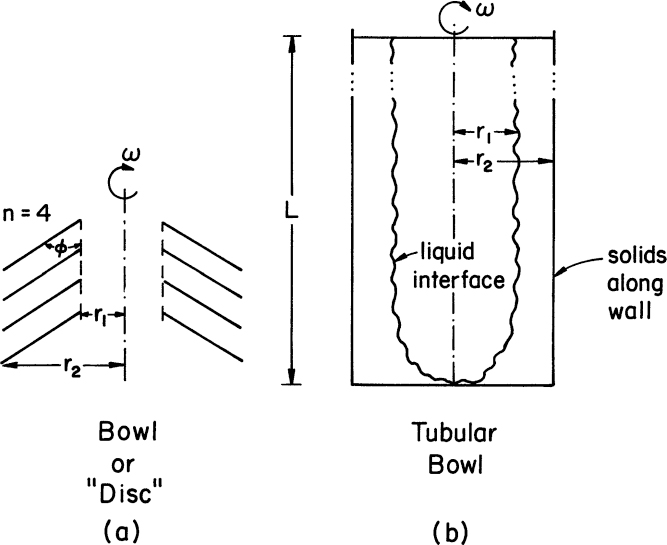
Figure 11.6. Two types of common centrifuges. (a) A disk or bowl centrifuge with multiple separator disks or bowls. The scale-up factor depends on the two radial distances, r1 and r2, the angle φ, the rotational speed, ω, and n, the number of disks or effective separator bowls. (b) A tubular bowl centrifuge can operate with continuous liquid feed with the span of continuous operation determined by the capacity of the bowl to collect solids. Key scale-up parameters are the distances r1 and r2, the height of the unit, L, and the rotational speed, ω.
Consider a simple one-dimensional case where the following is the distance of travel of a particle:
Substituting equation 11.17 for U0c and noting that the time of interest is t = Vc/Fc, we write
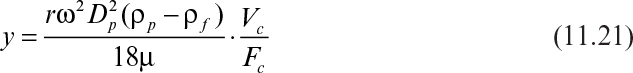
where Vc is liquid volume in the centrifuge and Fc is liquid flow rate through the centrifuge.
By substituting y = Le/2 and r = re into equation 11.21, we obtain
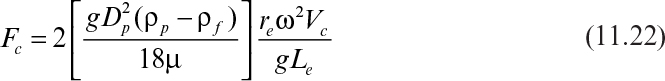
where Σ = reω2Vc/gLe, which is known as the centrifugation coefficient, U0 is the free settling velocity of the particles under gravity, Le is the effective distance of settling (= 2y), and re is the effective radius of rotation. Σ is equal to the surface area of the gravity settling basin whose separation performance is equal to that of a particular centrifuge.
For a tubular centrifuge, Σ is
where L is the length of cylindrical separator, and r1 and r2 are inner and outer radii of centrifugation distance.
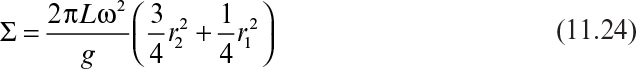
For a bowl centrifuge, Σ is

where n′ is the number of separator bowls, and ϕ′ is the angle of inclination of the side walls.
Assuming that the free settling velocities of particles are the same, the following equation can be used for the scale-up of centrifuges:
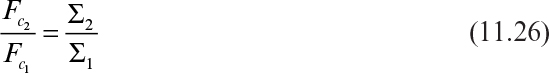
where Fc1 and Fc2 the flow rates through the small and large centrifuges, respectively.
Cross-flow microfiltration processes (Section 11.4.7) have replaced centrifugation in many bioprocesses, particularly when it is essential to prevent the escape of cells into the atmosphere. This consideration is particularly relevant when the organism is genetically modified. However, with recent improvements, the trend has gone back toward a combination of centrifugation and depth filtration.
11.2.3. Coagulation and Flocculation
Coagulation and flocculation are usually used to form cell aggregates before centrifugation, gravity settling, or filtration to improve the performance of these separation processes. Coagulation is the formation of small flocs from dispersed colloids using coagulating agents, which are usually simple electrolytes. Flocculation is the agglomeration of these small flocs into larger settleable particles using flocculating agents, which are usually polyelectrolytes or certain salts, such as CaCl2.
Simple electrolytes used in coagulation are acids, bases, salts, and multivalent ions, which are relatively inexpensive but less effective than polyelectrolytes. Certain fine solid particles, such as clays, activated carbon, or silica, may serve as nucleation sites for coagulation. Polyelectrolytes used in flocculation are high-molecular-weight, water-soluble organic compounds, which can be anionic, cationic, or nonionic.
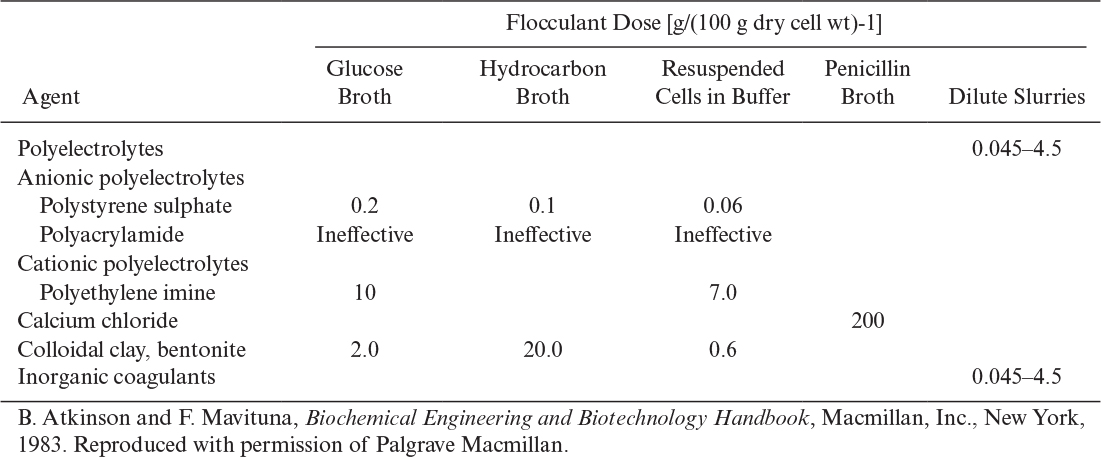
The analysis of gravity sedimentation is based on Stokes’s and Newton’s laws and is similar to the analysis presented in the centrifugation section. Sedimentation is a critical feature in the activated waste-treatment process and has been applied in some schemes to stabilize a population of genetically engineered cells. A list of widely used flocculants and their dosage ranges is given in Table 11.1. The important parameters to be considered in flocculation are flocculant–coagulant concentration, concentration of colloidal cells, kinetics of the binding, and settling phenomena. The selection criteria usually are flocculation–sedimentation rate, floc size, and the clarity of the supernatant liquid.
These processes are particularly important in waste-treatment processes or for nontherapeutic products because addition of chemicals can be problematic for production of therapeutic products, particularly proteins. However, the drive for more efficient, lower-cost production is forcing industry to reevaluate these techniques even for therapeutic proteins, as they can reduce costs.
11.3. Cell Disruption
After cells are separated from liquid broth, if the desired product is intracellular, then the cells need to be disrupted to release the intracellular products. The method of disruption varies with the type of cells and the nature of intracellular products. Major methods of cell disruption can be classified as mechanical and nonmechanical. With small bacteria, efficient, large-capacity cell-disruption processes can be difficult to construct. Animal cells are readily disrupted, so we focus here on bacteria, yeasts, and molds.
11.3.1. Mechanical Methods
Mechanical methods can be applied to a liquid or solid medium. First, consider some methods applied to a liquid medium.
Ultrasonic vibrators (sonicators) are used to disrupt the cell wall and membrane of bacterial cells. Wave density is usually around 20 kc/s. Rods are broken more readily than cocci, and gram-negative cells are broken more easily than gram-positive cells. This method is not as effective for molds. An electronic generator is used to generate ultrasonic waves, and a transducer converts these waves into mechanical oscillations by a titanium probe immersed in a cell suspension. Intracellular compounds (enzymes, metabolites) are released into the broth upon cell disruption. Ultrasonic disruption in some cases results in denaturation of sensitive enzymes and fragmentation of cell debris. Heat dissipation is an important problem in cell disintegration, particularly if the volume subjected to sonication is large. Consequently, this method is used primarily at the laboratory scale.
The Gaulin–Manton and French presses work well on a laboratory scale. The French press is a hollow cylinder in a stainless-steel block that is filled with cell paste and subjected to a high pressure. The cylinder has a needle valve at the base, and the cells disrupt as they are extruded through the valve to atmospheric pressure. The Ribi fractionator is similar to a French press but is capable of continuous operation. It requires a preconcentrated cell paste or slurry. The Rannie high-pressure homogenizer is advertised to operate up to 1000 bar and to have a capacity of up to 40,000 l/h. A major disadvantage of this technique can be generation of heat, so these devices require effective strategies for cooling.
Other mechanical homogenizers make use of small beads (20 to 50 mesh). Some of these can be effectively used at rather large scales. The Dyno-Mill is available in sizes up to 275 l and can process 2000 kg/h of a cell suspension or about 340 kg dw/h of yeast. The Dyno-Mill can work with algae, bacteria, and fungi. The principle of operation is to pump the cell suspension through a horizontal grinding chamber filled with about 80% beads. Within the grinding chamber is a shaft with specially designed disks. When rotated at high speeds, high shearing and impact forces from millions of beads break cell walls. The broken cells are then discharged. A primary advantage of bead over pressure devices is better temperature control. Also, this device is fully enclosed, preventing release of organisms in an aerosol, which is a critical consideration with pathogenic or genetically modified organisms.
For a solid medium, such as frozen cell paste or cells attached to or within a solid matrix, different processing options are available. Ball mills can be operated on large-scale processes. More specialized pieces of equipment include the Hughes and X-presses. The Hughes press consists of a split block with a half-cylinder hollowed in each face. The frozen cell paste is placed in the hollow, and pressure is applied to it from the cylinder into channels cut in the block. In the X-press, frozen cells are forced continuously through a small hole in a disk between two cylinders at low temperature and pressure. Cell disruption takes place because of deformation of organisms embedded in the ice. Pressure levels of several hundred bars can be obtained with the X-press.
With any of these approaches, there is potential for damage to the product. Clearly, heat denaturation is a major potential problem. The release of proteases from cellular compartments can lead to enzymatic degradation of the product, so addition of protease inhibitor cocktails is often employed. Some techniques, such as bead mills, have comparatively long residence times, so that if 100% cell breakage is desired, some fragile compounds released early in the process may be damaged. Once cell breakage occurs, products are released and encounter an oxidizing environment (due to air) that can cause, for protein products, rapid denaturation and aggregation. Typically, this effect can be mitigated by addition of a reducing agent (e.g., β-mercaptoethanol) and a chelating agent (e.g., EDTA) to complex metal ions that may accelerate the oxidation process. Product quality considerations are essential to selection of a method for cell breakage.
11.3.2. Nonmechanical Methods
Osmotic shock and rupture with ice crystals are commonly used methods. By slowly freezing and then thawing a cell paste, the cell wall and membrane may be broken, releasing enzymes into the media. Changes in the osmotic pressure of the medium may result in the release of certain enzymes, particularly periplasmic proteins in gram-negative cells.† Cell-wall preparation of certain organisms can be made by heat-shocking. Freeze-drying after treatment with acetone, butanol, and buffers results in cell-wall disruption.
† The periplasmic space in a gram-negative cell is the space between the inner and outer membranes.
Enzymes such as lysozyme (a carbohydrase) can be used to lyse cell walls of bacteria. Gram-positive bacteria are far more susceptible to enzymatic lysis than are gram-negative bacteria. The cells may be treated with ethylenediaminetetraacetic acid (EDTA) or by freezing and thawing before treatment with lysozyme. EDTA is a chelating agent; high levels of EDTA will extract divalent ions that are part of the cell envelope. Enzymatic hydrolysis is an expensive method and is not very widely used in industry.
Actively growing cells can be treated with an antibiotic, such as penicillin or cycloserine, that interferes with cell-wall synthesis and, coupled with the correct osmotic conditions, can lead to cell disruption.
After cells have been lysed and the products are released into the medium, cell debris can be separated by ultracentrifugation or ultrafiltration, and soluble products are recovered using methods discussed in the following sections. As with mechanical methods, products in the cell-free broth are subject to denaturation and aggregation, and these problems can be mitigated using the same techniques as used for broths from mechanical breakage.
11.4. Separation of Soluble Products
Most fermentation or biotechnological products, such as antibiotics, organic acids, solvents, amino acids, therapeutics, proteins, and extracellular enzymes, are soluble and extracellular. Various methods have been developed to recover such soluble products, including extraction, adsorption, ultrafiltration, and chromatography.
11.4.1. Liquid–Liquid Extraction
Liquid–liquid extraction is commonly used to separate inhibitory fermentation products such as ethanol and acetone–butanol from a fermentation broth. Antibiotics are also recovered by liquid extraction (using organic solvents such as amylacetate or isoamylacetate). Ideally, the liquid–liquid extractant should be nontoxic, selective, inexpensive, and immiscible with fermentation broth and should have a high distribution coefficient for the product. Typically liquid–liquid extraction is not used for proteins because of the danger of solvent denaturation of the protein.
The extraction of a compound from one phase to the other is based on solubility differences of the compound in one phase relative to the other. When a compound is distributed between two immiscible liquids, the ratio of the concentrations in the two phases is known as the distribution coefficient:
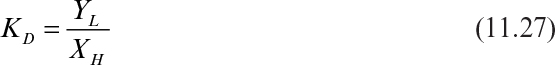
where YL and XH are concentrations of the solute in light and heavy phases, respectively. In most, but certainly not all, cases the light phase will be the organic solvent and the heavy phase will be the aqueous fermentation broth.
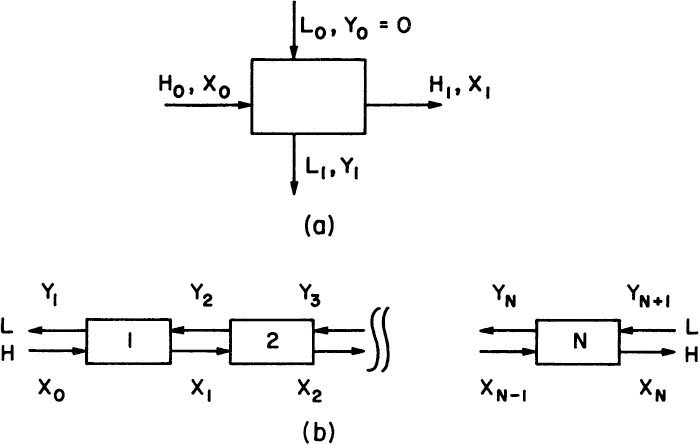
Assuming that KD is constant and the solvents are totally immiscible (i.e., the mass flows of the light and heavy phases are conserved so that L0 = L1 = L and H0 = H1 = H), a mass balance on the extracted solute yields (Figure 11.7a):

Since KD = Y1/X1, equation 11.29 can be written as


where E = LKD/H is the extraction factor.
For a multistage countercurrent operation, as depicted in Figure 11.7b, a material balance on extracted solute yields
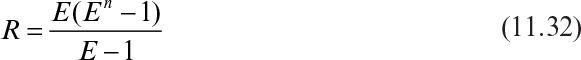
where R is the rejection ratio, which is the weight ratio of the solute leaving in the light phase to that leaving in the heavy phase, and n is the number of equilibrium stages.
Then the fraction of solute extracted is

When the solute enters the system in the light phase, the rejection ratio is

where n is the number of stages. Figure 11.8 depicts the relationship between E, Xn/X0 and n, which is used to determine the number of stages (n) required for a certain degree of extraction (Xn/X0) for a given system (E).
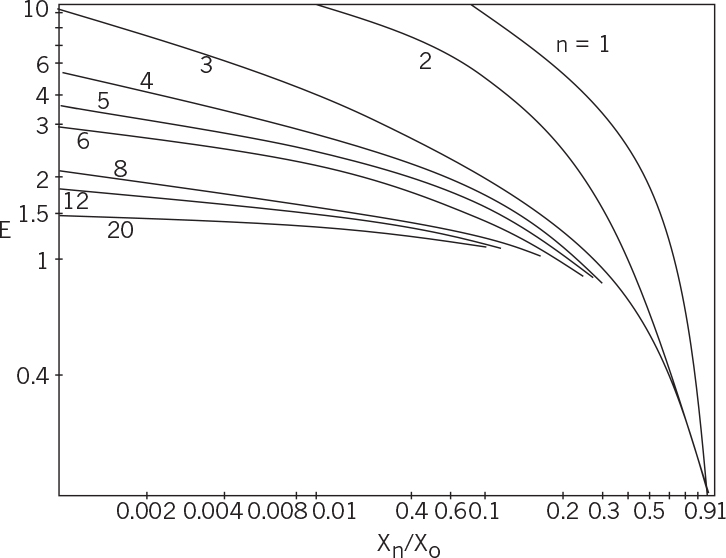
Figure 11.8. Variation of the extraction factor (E) with the degree of extraction (Xn/Xo) for different number of stages (n) in multistage continuous countercurrent extraction.
Most antibiotics are extracted from the fermentation broth by using organic solvents such as amylacetate or isoamylacetate. Usually, continuous centrifugal Podbielniak extractors are used for the extraction of antibiotics. Penicillin is more soluble in organic phase at low pHs (pH = 2 to 3) and is highly soluble in aqueous phase at high pHs (pH = 8 to 9). Therefore, penicillin is extracted between organic and aqueous phases several times by shifting the pH to improve the purity of the product (often known as pH-swing extraction).
Some products to be recovered from the fermentation broth are weak acids or weak bases. Since compounds that are not ionized are soluble in the organic phase, the pH conditions are selected such that the extracted compound is neutral and is soluble in an organic solvent. Therefore, weak bases are extracted at high pHs and weak acids are extracted at low pH values in the neutral form.
If fermentation broth contains more than one component, then the selectivity (β) of the solvent becomes an important parameter. The selectivity coefficient (βij) is defined as

The ease of separation depends on the βij value: the higher the βij value, the easier the separation of i from j. In some cases, the βij value changes appreciably with a pH shift, and the separation becomes easier. For example, at low pH values, penicillins can be separated from other impurities by selective extraction into the organic solvent. However, the separation of similar compounds by extraction is difficult. If only nonionized species are soluble in both phases at extreme pH values and the solvents are immiscible, the aforementioned design equations can be used. However, at intermediate pH values, when compounds are partially ionized, the analysis of the system becomes more complicated. The extraction of ionized species (weak acid or bases) is known as dissociation extraction.
The apparent distribution coefficients for weak acids and bases follow:


In equations 11.36 and 11.37, ![]() is the apparent distribution coefficient,
is the apparent distribution coefficient, ![]() is the distribution coefficient for neutral species, and K1 is the dissociation equilibrium constant for weak acids or bases.
is the distribution coefficient for neutral species, and K1 is the dissociation equilibrium constant for weak acids or bases.
A particularly important device for liquid–liquid extraction for fermentation products is the Podbielniak centrifugal extractor (see Figure 11.9). Many fermentation products (e.g., penicillin) are unstable. The use of mixer–settlers can be problematic, because the residence time of the product in the pH-adjusted broth is too long. The rapid rotation of the Podbielniak extractor produces a centrifugal field that rapidly drives the two fluids countercurrent to each other, as depicted in Figure 11.9. A product can be extracted and returned to another aqueous phase (e.g., a phosphate buffer) within minutes.

Figure 11.9. Liquid–liquid extraction equipment (Podbielniak). Bold arrow indicates heavy liquid flow; open arrow represents the flow of a mixture or light liquid. (With permission, from S. Aiba, A. E. Humphrey, and N. F. Millis, Biochemical Engineering, 2d ed., University of Tokyo Press, Tokyo, 1973.)
11.4.2. Aqueous Two-Phase Extraction
Aqueous two-phase extraction is an approach under active development for the extraction of soluble proteins such as enzymes between two aqueous phases containing incompatible polymers, such as polyethylene glycol (PEG) and dextran. The phases containing PEG and dextran are more than 75% water and are immiscible. Typical aqueous phases used for this purpose are PEG–water/dextran–water and PEG–water/K-phosphate–water. PEG/dextran and PEG/K phosphate are reasonably immiscible. The partition coefficient, Kp, varies with the molecular weight (MW) of the soluble protein in the form of an exponential function:
where M is the MW of protein, T is the absolute temperature, and A is a constant.
The partition coefficient, Kp, of many enzymes between the two phases (CPGE – CDEX) varies between 1 and 3.7, resulting in poor separations in a single stage. The partition coefficient can be improved by including ion-exchange resins or certain salts, such as (NH4)2 SO4 and KH2 PO4, in one of the phases. Figure 11.10 depicts the variation of Kp of an enzyme with a concentration of KH2PO4 in a PEG/(NH4)2 SO4 system. More than tenfold increases in Kp values may be achieved by increasing the concentration of KH2PO from 0.1 to 0.3 M. In PEG–salt systems, salting-out may result in protein precipitation at the interface.
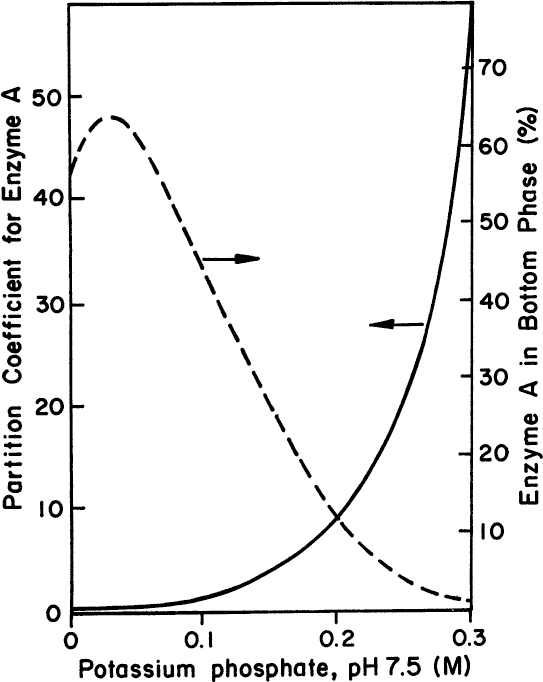
Figure 11.10. The expected behavior of an enzyme in a two-phase solution. Note the dependence of the partition coefficient of a hypothetical protein on the concentration of potassium phosphate in a polyethylene glycol 4000 ammonium sulphate system. A typical condition would be 14% PEG 4000 and 9.5% (NH4)2SO4).
Ion-exchange resins can be used to increase the value of a partition coefficient. PEG can be derivatized to yield cation- or anion-exchange properties and used in a two-phase system. Affinity ligands may also be used to increase Kp values; examples are PEG–NADH and PEG–cibacron blue systems. This method is known as two-aqueous-phase affinity partition extraction. Also, partial hydrolysis of dextran and PEG may result in an increase in the Kp value, since lower-MW polymers may interact with proteins more effectively. By mixing two kinds of PEGs (PEG400 and PEG4000), the Kp value may be increased by a factor of 6 for the partition of fumarase. Two-aqueous-phase extraction can also be used for the recovery of cell debris, polysaccharides, virus or virus-like particles (VLP), and nucleic acids. The partition coefficient for whole cells and DNA is between 100 and 0.01, for proteins it is between 10 and 0.1, and for small ions it is around 1.
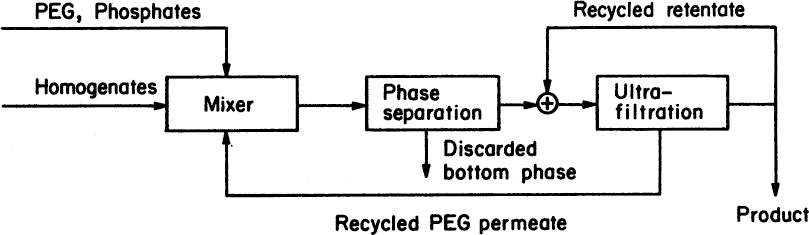
After the extraction step, the phases can be separated by centrifugation or decantation, and PEG can be recovered by ultrafiltration. Figure 11.11 is a block diagram of an enzyme separation unit using the two-phase partitioning method with PEG recovery. This separation method is fast and can be operated under mild conditions of temperature, pressure, and pH. Dextran and PEG are recovered and reused, since the cost of polymers is the major economic factor.
11.4.3. Precipitation
The first step in the purification of intracellular proteins after cell disruption is often precipitation. Proteins in a fermentation broth (before or after cell lysis) can be separated from other components by precipitation using certain salts. Examples include streptomycin sulfate and ammonium sulfate.
The two primary methods used for protein precipitation are
• Salting-out by adding inorganic salts such as (NH4)2 SO4 at high ionic strength.
• Solubility reduction at low temperatures by adding organic solvents (T < –5°)
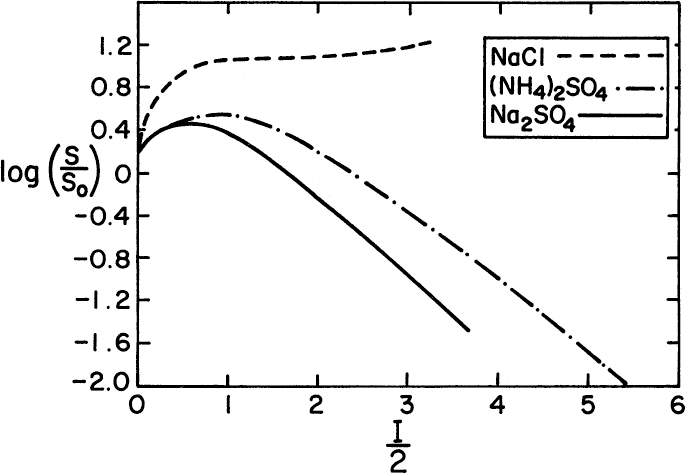
Salting-out of proteins is achieved by increasing the ionic strength of a protein-containing solution by adding salts such as (NH4)2SO4 or Na2SO4. The added ions interact with water more strongly, causing protein molecules to precipitate. The solubility of proteins in a solution as a function of the ionic strength of the solution is given by

where S is the solubility of protein in solution (g/1), S0 is the solubility of protein when I = 0, I is the ionic strength of solution, and ![]() is the salting-out constant, which is a function of temperature and pH.
is the salting-out constant, which is a function of temperature and pH.
The ionic strength of a solution is defined as
where Ci is molar concentration of the ionic species (mol/1), and Zi is the charge (valence) on ions.
Figure 11.12 depicts variation of the solubility of hemoglobin with inorganic salt concentrations. At high ionic strengths, the solubility of the protein decreases logarithmically with ionic strength.
Organic solvent addition at low temperatures (T < – 5°C) causes the precipitation of proteins by reducing the dielectric constant of the solution. The solubility of protein as a function of the dielectric constant of a solution is given by
where Ds is the dielectric constant of the water–solvent solution.
A reduction in the dielectric constant of a solution results in stronger electrostatic forces between the protein molecules and facilitates protein precipitation. The addition of solvents also reduces protein–water molecule interactions and therefore decreases protein solubility. Solvents may cause protein denaturation. However, denaturation of proteins in the salting-out method is less likely. Solvent precipitation can be used with salt addition, pH adjustment, and low temperature to improve precipitation. Among other protein precipitation methods, the following methods are the most widely used.
Isoelectric precipitation is the precipitation of proteins at their isoelectric point, which is the pH at which proteins have no net charge. The isoelectric point of a protein is defined as pI = ![]() (pK1 + pK2) When pH = pI, protein becomes free of charge and precipitates. This method is effective for proteins with high surface hydrophobicity (i.e., a nonpolar surface). It is inexpensive, but low pH values may result in the denaturation of proteins.
(pK1 + pK2) When pH = pI, protein becomes free of charge and precipitates. This method is effective for proteins with high surface hydrophobicity (i.e., a nonpolar surface). It is inexpensive, but low pH values may result in the denaturation of proteins.
The use of ionic polyelectrolytes, such as ionic polysaccharides, polyphosphates, and polyacrylic acids, changes the ionic strength of the media and causes protein precipitation. However, polyelectrolytes may cause protein denaturation and structural damage.
The use of nonionic polymers, such as dextrans and polyethylene glycol, reduces the amount of water available to interact with protein molecules and results in protein precipitation. High concentrations of polymers are most effective for low-MW proteins, and nonionic polymers do not interfere with further protein recovery.
11.4.4. Dialysis
Dialysis is a membrane separation operation used for the removal of low-MW solutes such as organic acids (100 da < MW < 500 da) and inorganic ions (10 da < MW < 100 da) from a solution. It is generally a small- to medium-scale operation. A well-known example is the use of dialysis membranes to remove urea (MW = 60 da) from urine in artificial kidney (dialysis) devices. In biotechnology, dialysis can be used to remove salts from a protein solution, which is often a step in resolubilizing proteins that were initially in inclusion bodies. A schematic of a dialysis membrane is depicted in Figure 11.13.
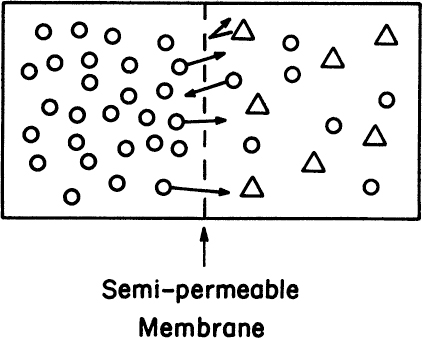
Figure 11.13. A typical dialysis membrane separation. Low-MW component 1 (O) diffuses through membrane from high- to low-concentration region. High-MW component (Δ) cannot pass.
Note that the membrane is selective. The dialysis membrane separates two phases, one of which contains low-MW compounds and the other high-MW compounds. Since the MW cutoff of a dialysis membrane is very small, low-MW solutes can move from a high- to a low-concentration region across the membrane while the high-MW compounds are retained in a single compartment. At equilibrium, the chemical potentials of diffusing compounds on both sides of a membrane are equal:
where μ is the chemical potential of the diffusing compound. In terms of concentrations, equation 11.42 can be written as
or
where C1 is the concentration and γ1 is the activity coefficient of diffusing component 1. For ideal (very dilute) solutions, γ1 ≈ 1 and
The concentrations represented in equations 11.42 through 11.45 are concentrations of dissolved (unbound) component 1; if the compound binds to a surface, then an equilibrium relationship between bound and unbound components needs to be considered.
This dialysis equilibrium is based on the assumption of uncharged solute molecules. If macromolecules are polyelectrolytes, such as proteins and nucleic acids, then the charge equilibrium of the macromolecules must be considered. This equilibrium is known as the Donnan equilibrium and requires a more complete analysis.
11.4.5. Reverse Osmosis
Osmosis is the transport of water molecules from a high- to a low-concentration region (i.e., from a pure water phase to a salt-containing aqueous phase) when these two phases are separated by a selective membrane. The water passes the membrane easily, whereas the salt does not. At equilibrium, the chemical potential of water must be the same on both sides of the membrane. As the water passes into the salt solution, its pressure increases. This osmotic pressure can be expressed as
where C is the molar concentration of the solute, T is temperature, R is the gas constant, and B2, B3 are the virial coefficients for the solute. For very dilute, ideal solutions, B2 = B3 = 0, and
In reverse osmosis (RO), a pressure is applied onto a salt-containing phase, which drives water (solvent) molecules from a low- to a high-concentration region and results in the concentration of solute (salt) molecules on one side of the membrane. The pressure required to move solvent from a low- to high-concentration phase is equal to or slightly larger than the osmotic pressure. When Δp > π, a solvent flux takes place in the direction against the concentration gradient (see Figure 11.14).
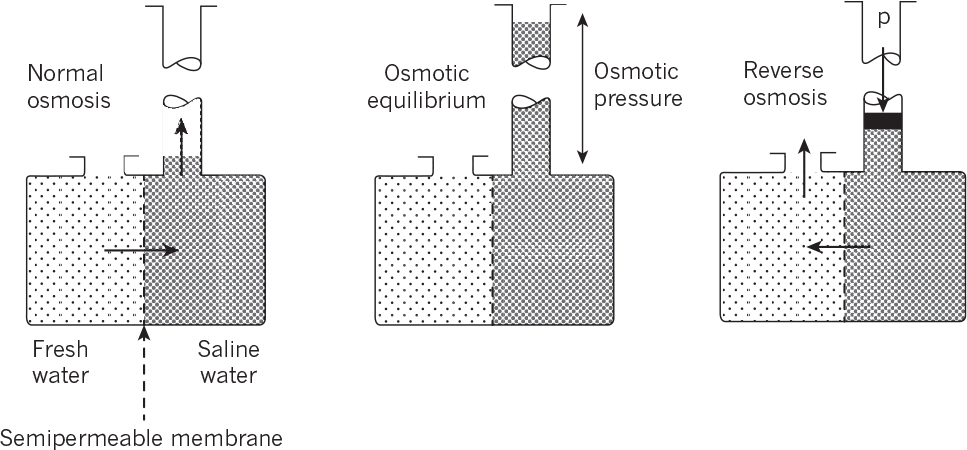
Figure 11.14. Osmotic flows across a membrane separating fresh water and saline water. (D. W. Sundstrom, H. E. Klei, Wastewater Treatment © 1979.)
In some RO applications, membranes may allow the passage of solute molecules along with solvent. Solute transport can be by diffusion or convection. A reflection coefficient (σ) for each solute can be defined as the fraction of solute molecules retained on one side of the membrane in the presence of a solvent flux. Therefore, for σ = 0, complete solute passage is obtained, and for σ = 1, no solute passage is achieved (that is, perfect reflection). Solvent and solute fluxes in RO can be expressed as
where Kp are Kp′ permeability coefficients for solvent and solute, respectively, C is the average solute concentration in solution, and ΔC is the solute concentration difference across the membrane.
The magnitude of the required pressure varies with the concentration of solutions. Pressures on the order of 30 to 40 atm are required for a 0.6 M salt solution. The salt level in fermentation fluids may be much higher than 0.6 M, requiring high pressures for RO separations. The applications of RO in bioseparations are limited, since the method requires high pressures and is based on solvent removal. RO membranes are usually used for dewatering and concentration purposes but not for protein separations.
Another problem with RO membranes (and membranes in general) is the deposition of solute molecules on membrane surfaces, resulting in large resistances for solvent flow. This phenomenon, known as concentration polarization, can be overcome by increasing the degree of turbulence on the membrane surface.
The osmotic pressure for multicomponent systems is equal to the sum of the individual osmotic pressures:

The solvent and solute fluxes in this case are
a. Determine osmotic pressure of saline water at 25°C.
b. Determine the required surface area of the RO membrane.
c. Determine the number of tubes in a multitubular RO membrane system if Do = 0.5 cm and L = 50 cm.
a. Assuming dilute solution:

b. F = KpA (ΔP – π)
Note that ΔP = 25 –1 = 24 atm and F = 0.9(10) = 9 m3/h
9 m3/h = 0.5 m3/m2/atm-h A(24 – 20.9) atm, A = 5.80 m2
c. A = N π DoL, 5.80 m2 = N(3.14) (5.10–3m) (0.5m), solving for N,
N = 739 tubes
11.4.6. Ultrafiltration and Microfiltration
Membranes are widely used to concentrate or separate solute molecules such as proteins on the basis of their size and to concentrate cells from fermentation broth. Membrane separations may be used to separate proteins after precipitation to remove many of the low-MW contaminants. Membranes can serve as a molecular sieve to separate solute molecules of different molecular size. Depending on molecular-size cutoff, different membranes can be used for the separation of different MW proteins. Microfiltration or microporous filtration (MF) is used to separate cells, such as bacteria and yeast, that range from 0.1 to 10 μm in size. Ultrafilters are used for macromolecules with a molecule-weight range of 2000 to 500,000 dalton. All these membrane sieving methods (microfiltration, ultrafiltration, reverse osmosis) are based on the same driving force, namely pressure, but have some minor differences. Some ultrafiltration (UF) membranes have anisotropic structure. In an anisotropic membrane, a thin skin with small pores is formed on top of a thick, highly porous structure. The thin layer provides selectivity, while the thicker layer provides mechanical support. With newer membrane materials available, anisotropic membranes maybe used less frequently. Microporous filters are usually isotropic and may have an open, tortuous path structure, which causes particle entrapment within the filter, or they may have well-defined pores of uniform size.
Although most membranes in use are made from polymers, ceramic membranes are also available. Factors that affect choice of membrane materials are interactions with proteins, mechanical stability, chemical stability (especially to cleaning agents), biocompatibility, flux rates, ease of sterilization (e.g., thermal stability), and cost. Typical polymeric materials are cellulose acetate, nylon, polytetrafluroethylene (PTFE), polyvinyldinedifluoride (PVDF), and polysulfone. Ceramic membranes have a high level of chemical resistance, can be steam sterilized, and have a much longer life time (ca. 10 yr) compared to many polymeric membranes. Such membranes have high initial cost and, while mechanically strong, are sometimes brittle. The actual choice of membrane depends on the application, the composition of the feed stream, and required product characteristics.
UF and MF membranes are widely used in the pharmaceutical, chemical, and food industries for the separation of vaccines, fermentation products, enzymes, and other proteins. UF is an energy-efficient, economical separation method used to concentrate chemicals and biologicals at a high degree of purity.
Typical UF and MF operations are pressure-driven processes in which low-MW solutes and water pass through the filter and high-MW solutes are retained near the membrane surface. Therefore, a concentration gradient builds up between the surface of the membrane and the bulk fluid. This gradient results in concentration polarization. As a result, solute diffuses back from the membrane surface to the solution (Figure 11.15). At steady state, the rate of convective transfer of solute toward membrane is equal to the rate of diffusion of solute in the opposite direction because of concentration polarization:
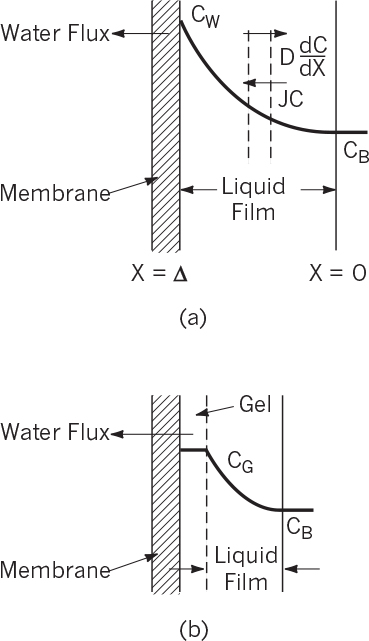
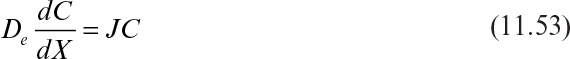
where De is the effective diffusivity of solute in liquid film (cm2/s), J is the volumetric filtration flux of liquid (cm3/cm2s), and C is the concentration of solute (mol/cm3 liquid).
Integration of equation 11.53 with the boundary conditions of C = CB at X = 0 and C = CW at X = δ yields

or
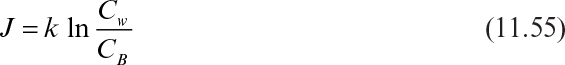
where k = De/δ is the mass transfer coefficient, and δ is film thickness.
The mass transfer coefficient is a function of fluid and solute properties and flow conditions. It is embedded in the Sherwood number (Sh) and is correlated with Re (Reynolds number) and Sc (Schmidt number):
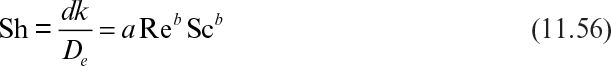
Here Re = dvρ/μ, Sc = μ/ρDe, where v is fluid velocity. The value of a is ![]() according to the boundary-layer theory; b is approximately 0.5 for laminar flow and 1.0 for turbulent flow. That is, k ∞ v0.5 for laminar and k ∞ v for turbulent flow.
according to the boundary-layer theory; b is approximately 0.5 for laminar flow and 1.0 for turbulent flow. That is, k ∞ v0.5 for laminar and k ∞ v for turbulent flow.
A gel layer is formed on the surface of the UF membrane when slowly diffusing, large macromolecules accumulate at the surface. A gel layer forms if the protein concentration in the solution exceeds 0.1%. For biological fluids, protein accumulation is usually dominant, as shown in Figure 11.15. The protein concentration in the gel, CG, is the maximum value of CW. In this case, the liquid flux through the filter is given by
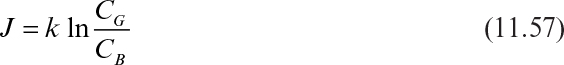
Gel formation depends on the nature and concentration of the solute, pH, and pressure. Once gel is formed, CG becomes constant, and liquid flux decreases logarithmically with increasing solute concentration in the bulk liquid. The gel layer causes a hydraulic resistance against flow and acts somewhat like a second membrane. Figure 11.16 depicts the variation of liquid flux with the log of solute concentration in the absence and presence of gel formation.
11.4.7. Cross-Flow Ultrafiltration and Microfiltration
Gel formation can be partially eliminated by cross-flow filtration, where pressure is not applied directly perpendicular to the membrane but parallel to the membrane surface. This process is also called tangential flow filtration. That is, fluid flows parallel to the membrane surface, and a portion of the fluid passes through the membrane, leaving solutes in a liquid phase above the membrane. Mechanical agitation or vibration of the membrane surface can also be used to alleviate gel formation. A schematic of cross-flow filtration using a hollow fiber configuration is shown in Figure 11.17.

The pressure drop driving fluid flow in the seed flow channel is
For laminar flow, using the Hagen–Poiseuille equation, we can derive the following:

where L is the length of the tube, μ is fluid viscosity, Q is the volumetric flow rate of the liquid, C1 and C2 are constants, and d is diameter of the tube.
For turbulent flow, the following equation is used for ΔP:

where f is the Fanning friction factor, which is a function of Re (C3 and C4 are empirical constants). For cross-flow filtration, turbulent flow is desired.
The average transmembrane pressure drop is

where Pf is the filtrate pressure, which is usually near atmospheric pressure at least in laboratory systems.
Assuming that Pf = Patm or Pf is zero gauge pressure, we can relate ΔPm to ΔP:
High inlet pressure and sometimes low fluid velocities need to be used to obtain high ΔPM.
The filtration flux (J), as a function of transmembrane pressure drop, is given by

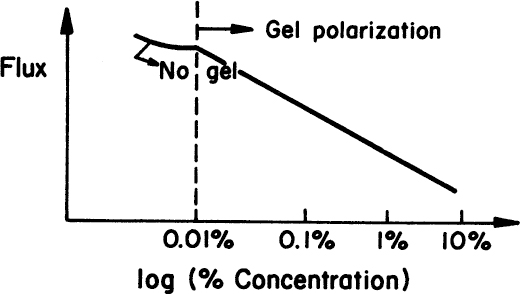
where RG and RM are gel and membrane resistances, respectively. RM is constant, and RG varies with the solute concentration and the tangential velocity across the membrane, which can retard or eliminate gel formation. Usually, there is an optimal fluid velocity range maximizing the filtration rate. At low velocities, the mass transfer coefficient (k) is low, resulting in high gel resistance (RG) and low filtrate flux. At high fluid velocities, ΔP is high, resulting in low ΔPM and therefore low J values. Also, there is an optimal value of ΔPM resulting in maximum flux because of a maximum-pressure limitation on Pi. That is, the maximum value of ΔPM is Pi, and Pi is limited by the physical properties of the membrane. With modern membranes, especially the new ceramic membranes, it may be possible to push Pi to high levels. Therefore, at low ΔPM values, flux increases with ΔPM; however, at high ΔPM values, filtration flux drops as a result of the decrease in velocity. Figure 11.18 describes optimal values of ΔPM resulting in the maximum UF or MF rate for various solute concentrations.
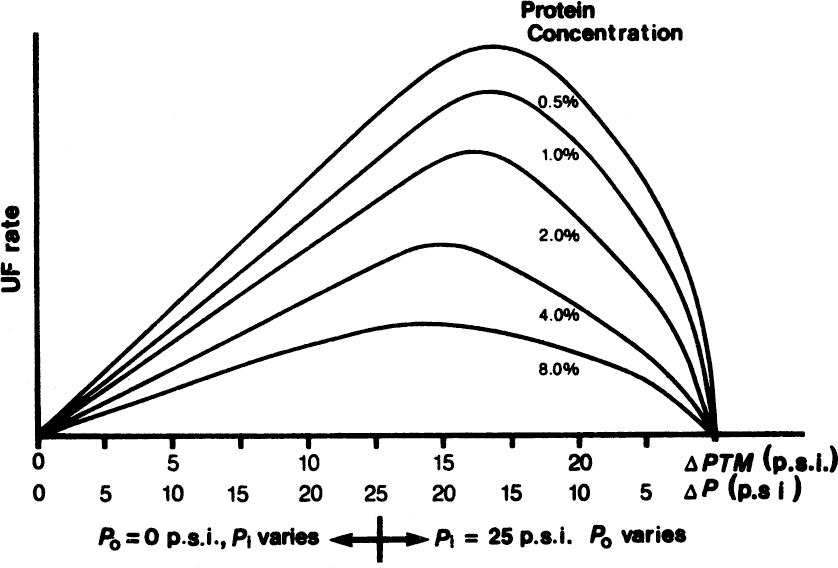
Figure 11.18. Filtration flux optimized as a function of transmembrane pressure at varying solute concentrations and fixed maximum inlet pressure. (With permission, from R. S. Tutunjian, in M. Moo-Young, ed., Comprehensive Biotechnology, Vol. 2, Elsevier Science, London, 1985.)
In the absence of gel formation, the filtration flux increases linearly with ΔPM. Figure 11.19 depicts the variation of filtration flux (J) with ΔPM. At low ΔPM values, J increases linearly with ΔPM because of the absence of gel polarization. However, at high ΔPM, gel formation takes place, and gel resistance (RG) increases with increasing ΔPM, resulting in a constant filtration flux (J) over a large range of high ΔPM values. At higher solute concentrations, flux levels off at lower ΔPM values.

Figure 11.19. Filtration flux as a function of transmembrane pressure at varying solute concentrations. (With permission, from R. S. Tutunjian, in M. Moo-Young, ed., Comprehensive Biotechnology, Vol. 2, Elsevier Science, London, 1985.)
The rejection coefficient of an ultrafilter is defined as
where CF is the concentration of the solute in the filtrate. When CF = 0, only water passes through the filter and R = 1, which is complete solute rejection. If CF = CB, complete solute transfer to the filtrate takes place and R = 0 (no rejection). Usually, 0 < R < 1 and is closer to 1 (i.e., R ≈ 0.95 or 0.98), as the solute size often approaches the pore size in the membrane. The value of R is a measure of the selectivity of the membrane for certain solutes. Selective separations of various compounds can be achieved using membranes with the right MW cutoff. Figure 11.20 provides an example of the variation of the rejection coefficient (R) with MW of the solute for a particular membrane. For MW > 105 da and MW < 103 da, R = 1 and R = 0, respectively. That is, the membrane allows complete passage of compounds with MW < 103 da, retains compounds with MW > 105 da and partially retains compounds of 103 da < MW < 105 da.

Three major membrane configurations are depicted in Figure 11.21: hollow fibers, flat sheets, and spiral-wound cartridges. Hollow-fiber cartridges provide a large surface-to-volume ratio (as the fiber diameter is typically small). However, they plug more easily than the other two configurations. Flat-sheet configurations are easy to construct and allow easy membrane replacement. Originally, these types of configuration used “loose” sheets of membrane in a frame, but now most use engineered cartridges. The channel width can be altered to reduce plugging problems. Membrane support must be added to allow operation at higher pressures. Flat-sheet systems may have a low membrane surface-to-volume ratio. Spiral cartridges contain rolled membranes and are essentially flat-sheet systems configured to increase the surface-to-volume ratio. They are potentially the most economical configuration but are rarely used in biotechnology because cleaning is difficult. Most UF membranes operate with ΔP < 5 to 7 atm and MF membranes at a slightly lower ΔP
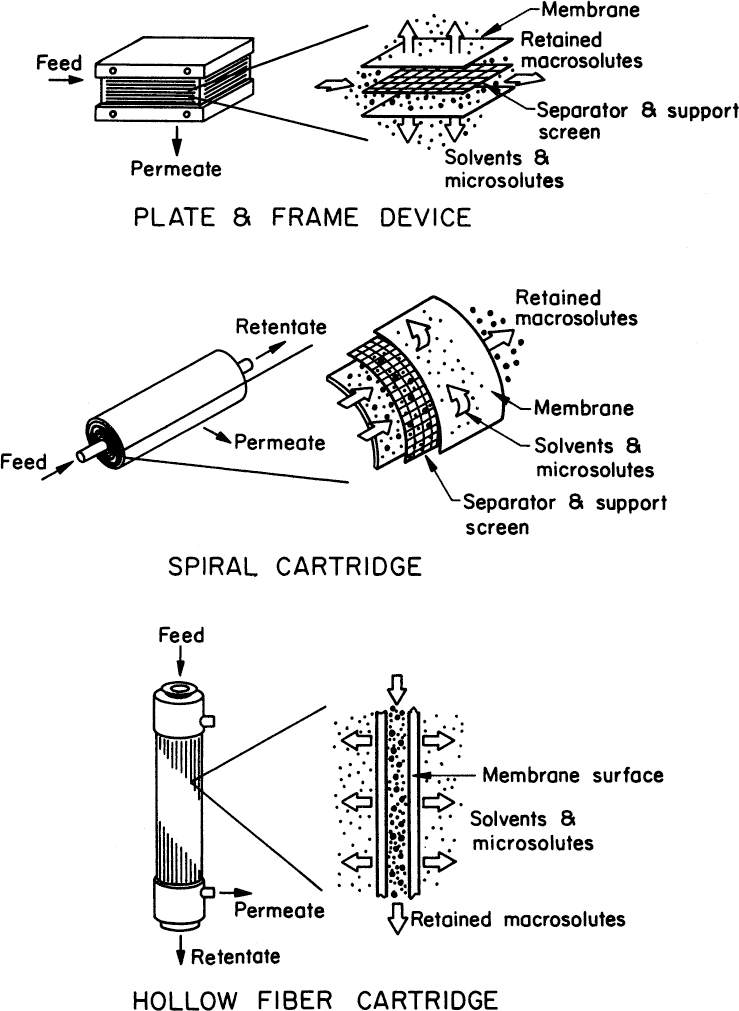
Figure 11.21. Examples of different membrane configurations. (Adapted with permission, from R. S. Tutunjian, Ultrafiltration Processes in Biotechnology, Annals of the New York Academy of Sciences, Vol. 413, Issue 1, December 1983, pages 238–253.)
RM = 5 atm/(m3/m2-h), RG = ½ RM, De = 0.36 10–5 m2/h, Pi = 8 atm, Pf = 1 atm
a. Determine cross membrane pressure drop and effluent pressure (P0).
b. If protein concentration in the gel film is 10 g/l, determine the thickness of the gel film.
c. Determine the number of tubes in multitubular ultrafiltration cartridge if D0 = 1 cm and L = 1 m.
a. Use equations 11.61 and 11.63:

which results in P0 = 1 atm.
b. The thickness of the gel film is calculated from equation 11.54:

c. The number of tubes required is
Three major applications of ultrafiltration are concentration, purification, and diafiltration. In concentration, water is removed from the aqueous solution using a UF membrane, and solute is concentrated. In purification, solvent and low-MW products are separated from high-MW compounds using a UF membrane. The product contains low-MW compounds and the solvent. In diafiltration, low-MW solutes such as salts, sugars, and alcohols pass through the filter, and the retained stream contains the product. The permeate that leaves the system is replaced with deionized water or another buffer.
Ultrafiltration membranes are used for the separation of proteins, enzymes, pyrogens (lipopolysaccharides from bacterial cell wall), cell debris, and viruses from fermentation media. UF separations operate under mild conditions (T = 20° to 30°C, P = 5 to 50 psi) and are energy efficient, inexpensive, nondestructive, and easy to operate.
Microfiltration is used primarily to concentrate bacterial and yeast suspensions and provide a cell-free supernatant. Cross-flow filtration and improved membranes have been key to making this process viable. In many applications, it has replaced centrifugation. Initial devices were primarily open plate and frame, owing to possible blockages, although hollow-fiber systems as well as modern flat-sheet cartridges are now available. Application to animal cells, which are mechanically fragile, is possible but difficult owing to high levels of hydrodynamic sheer that can break cells.
11.4.8. Adsorption
Adsorption of solutes from liquid media onto solids is a common practice in separating soluble materials from fermentation or cell culture broth and removal of impurities in wastewater treatment. Various mechanisms may be involved in adsorption. In physical adsorption, weak forces, such as van der Waals forces, are dominant; however, in ion-exchange adsorption, strong ionic bonds are utilized. Solute is transferred from liquid to solid phase, and equilibrium is reached after a while in a batch operation. The type of adsorbent used depends on the particular application. The most widely used adsorbent for wastewater treatment applications is activated carbon, since it has large internal surface area per unit weight. Similarly, ion-exchange resins and other polymeric adsorbents can be used for adsorption of biotechnological products. As an example, a carboxylic acid cation-exchange resin is used to recover streptomycin. Adsorption capacity varies depending on adsorbent, adsorbate, physicochemical conditions, and the surface properties of the adsorbent and adsorbate. Usually, the exact mechanism of adsorption is not well understood, and the equilibrium data must be determined experimentally.
One typical equilibrium relationship between solute concentrations in liquid and solid phases follows:
Here ![]() and
and ![]() are equilibrium concentrations of the solute in liquid and solid phases. CS is in units of mass of solute adsorbed per unit volume of resin. This relationship is an example of a type of Freundlich adsorption isotherm, with KF and n being empirical parameters and n being greater than 1. Another form is a Langmuir isotherm showing saturation as the concentration increases. The Freundlich isotherm is often better suited for real world applications.
are equilibrium concentrations of the solute in liquid and solid phases. CS is in units of mass of solute adsorbed per unit volume of resin. This relationship is an example of a type of Freundlich adsorption isotherm, with KF and n being empirical parameters and n being greater than 1. Another form is a Langmuir isotherm showing saturation as the concentration increases. The Freundlich isotherm is often better suited for real world applications.
Various types of solid–liquid contactors have been developed for the adsorption of solutes. Among these are packed-bed, moving-bed, fluidized-bed, and agitated-vessel contactors. Packed- and moving-bed contactors are the most widely used because they have a larger adsorption area per unit volume of reactor than the others. Analysis of adsorption phenomena in a packed-bed column is based on a differential material balance of the solution in the column:

where U is the superficial velocity of the liquid, ε the porosity of the bed, and CL the concentration of the solute in the liquid phase.
The first term in equation 11.66 is the convective transfer of solute in the bed, the second term represents the time course of change (transient) of the solute concentration in liquid, and the last term represents the rate of solute transfer from the liquid to the solid phase.
The rate of solute transfer from the liquid into the solid phase is

where Ka is the overall mass transfer coefficient describing the internal and external mass transfer resistance, and ![]() is the concentration of solute in the liquid phase, which is in equilibrium with CS.
is the concentration of solute in the liquid phase, which is in equilibrium with CS.
Substituting equation 11.67 into equation 11.68 yields

Equation 11.68, along with the equilibrium relationship (equation 11.65), can be solved numerically to determine the solute profile, CL = CL(Z,t), in the column.
The preceding approach is based on plug flow conditions in the bed. However, in practice, due to back-mixing and dispersion, irregular flow profiles and channeling occur. A dispersion term [– DE (∂2CL/∂Z2)] is added to the right side of equation 11.68 to account for dispersion effects. A fixed-bed adsorption unit can be approximated to a large number of well-mixed tanks in series.
For very long moving-bed columns to which adsorbent is added continuously, the operation may be considered to be at steady state (see Figure 11.22). For the analysis, equilibrium is assumed to occur at the top of the column. If the dispersion effects are negligible, then at steady state equation 11.68 can be written as


Figure 11.22. Schematic diagram of steady-state moving-bed adsorption column. (D. W. Sundstrom, H. E. Klei, Wastewater Treatment © 1979.)
with the boundary condition CL = CL0 at Z = H for liquid feed into the top of a column.
Equation 11.69 can be integrated to determine the height of the column for a certain degree of separation:
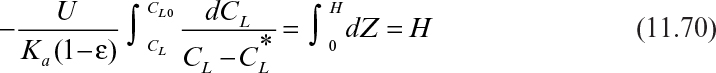
By using an equilibrium relationship, we can integrate equation 11.70 to determine the height of the column. To complete the analysis, a relationship between the unsaturated resin and the liquid concentration is needed. This relationship is called an operating line (Figure 11.23) and represents a mass balance. Note that the volumetric resin flow is denoted by B and the volumetric liquid flow rate by F. Also note that

Figure 11.23. Operating line for steady-state adsorption column. (D. W. Sundstrom, H. E. Klei, Wastewater Treatment © 1979.)
where A is the cross-sectional area of the column.
From mass balance considerations on the solute,
or

where ![]() is the solute concentration in the resin in equilibrium with CL0. As noted in Figure 11.23, the operating line is straight.
is the solute concentration in the resin in equilibrium with CL0. As noted in Figure 11.23, the operating line is straight.
For fixed-bed columns, the absorptive capacity is limited to a maximum level. In this view, a column would consist of three zones: a saturated zone, an adsorption zone, and a virgin zone. The adsorption zone moves down a column at a rate determined by the feed rate of the solute and the mass transfer characteristics of the bed. When the leading edge of the adsorption zone reaches the bottom of the column, there will be a rapid increase in the exit concentration of solute (known as “breakthrough”). Normally, the column would be shut down at this point and the resin replaced or regenerated. However, if the column were operated for a period of time equal to the time for the adsorption zone to travel its own height, we would observe the breakthrough curve of the adsorption zone. This process is depicted in Figure 11.24.
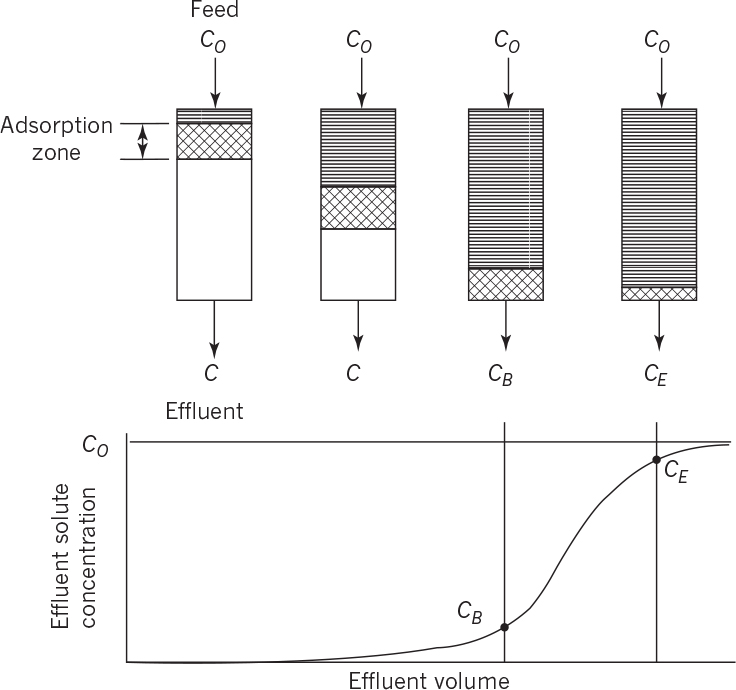
Figure 11.24. Movement of adsorption zone through a fixed-bed downflow adsorber and the corresponding breakthrough curve. (D. W. Sundstrom, H. E. Klei, Wastewater Treatment © 1979.)
Under these circumstances, equation 11.70 would describe the concentration profile in the adsorption zone of a height H. If the column were of total height Ht, then the time to exhaustion of the column would be equal to the ratio of H to Ht multiplied by the velocity of the adsorption zone, plus the time required to form the adsorption zone (usually negligible).


11.4.8.1. Bed depth–service time equation for adsorption column design.
A more practical approach for design of packed-bed activated carbon adsorption columns was originally developed by Thomas and later modified by Bohart and Adams† primarily for wastewater treatment applications. This equation is based on quasi-equilibrium between the aqueous and solid phases and relates the required bed height to duration of operation for a certain effluent adsorbate concentration (bed depth–service time equation):
† G. S. Bohart and E. Q. Adams, Journal Chemical Society 42: 523–529, 1920.
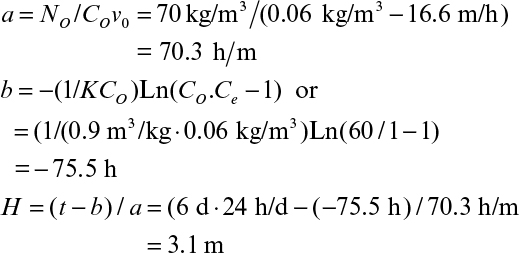
where Co and Ce are the feed and desired effluent adsorbate concentrations (kg/m3); K is the adsorption rate constant (m3 bed/kg adsorbent-h); N0 is the capacity of adsorbent (kg adsorbate/m3 bed); H is the column height (m); vo is linear superficial velocity of aqueous phase (m/h, F/Ao, where F and Ao are the volumetric flow rate and cross-section area of the column, respectively); and t is the service time. H/v0 is the average hydraulic residence time (HRT) in the bed (HRT = Vb/F = HAo/v0Ao = H/v0).
Since eKN0H/v0 >> 1, then equation 11.74 takes the following form:
or
Here Vb is the bed volume (AoH, m3) and Lo is the adsorbate loading rate (Lo = CoF, kg adsorbate-h). The first term is the maximum service time in the absence of transport limitations and the second term is the delay due to transfer rate of adsorbate. As indicated in equation 11.76, operation time is inversely proportional with adsorbate loading rate.
Equation 11.75 is usually written as
where a = N0/(Cov0) and b = –(1/KCo)Ln(Co/Ce – 1).
For a given Co and Ce, a plot of service time (t) versus bed depth (H) yields a line with a slope of a and intercept of b, which allows determination of N0 and K using experimental data.
The critical or minimum bed depth is defined as the bed depth at t = 0. Then, we get the following:
The actual bed height is usually five or six times larger than Hm.
Do = 0.8 m, No = 70 kg adsorbate/m3 bed, K = 0.9 m3 bed/kg adsorbent-h
a. Determine the required height of the column for 6 days of operation.
b. If the void fraction in the column is e = 0.3, determine the volume of required activated carbon.
c. For H = 5 m, for how long can the column be operated to obtain effluent adsorbate C?
a. We first calculate the linear superficial velocity, v0:
v0 = F/A0 = (200 M3/d ÷ 24h/d)/(π/4.8 m2) = 16.6 m/h
b. The volume of the bed is
Vb = (π/4) D02 H = (π/4)(0.8)2(3.1) = 1.56 m3
VAC = Vb (1 – e) = 1.56 (0.70) = 1.1 m3
c. We calculate the operational time using equation 11.77:
t = aH + b = 70.3 (5) – 75.3 = 276 h = 11.5 days
11.4.9. Chromatography
Chromatography separates mixtures into components by passing a fluid mixture through a bed of adsorbent material. We are interested primarily in elution chromatography. Typically, a column is packed with adsorbent particles, which may be solid, a porous solid, a gel, or a liquid phase immobilized in or on a solid. A mobile phase or fluid phase with a mixture of solutes is injected. This pulse is followed by a solvent or eluent. The pulse enters as a narrow concentrated peak, but exits dispersed and diluted by additional solvent. Different solutes in the mixture interact differently with the adsorbent material (stationary phase); some interact weakly and some interact strongly. Solutes that interact weakly with the matrix pass out of the column rapidly (see Figure 11.25), while those that interact strongly with the matrix exit slowly. These differential rates of migration separate the solutes into different peaks that exit at a characteristic retention time (which will change if operating conditions are altered).
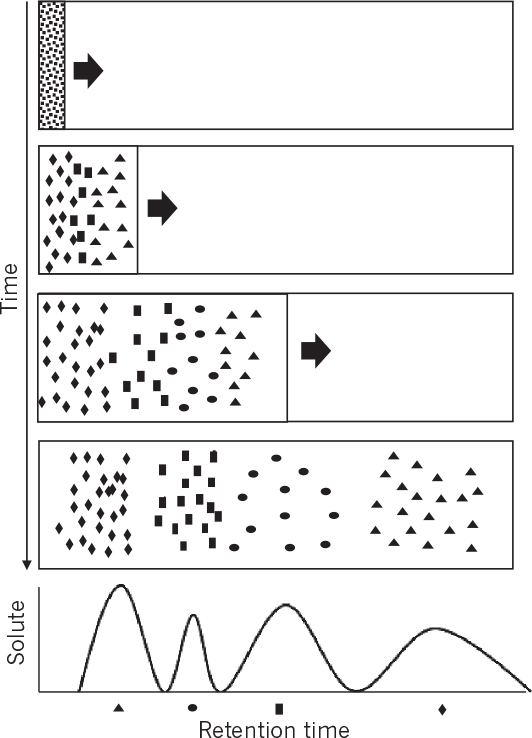
Figure 11.25. Separation by elution chromatography. The solvent with four different solutes flows through the bed and solutes are separated because of different adsorption affinities and are eluted at different times.
Elution chromatography is similar to fixed-bed adsorption (Section 11.4.4). However, in fixed-bed adsorption (sometimes called frontal chromatography), the solute is captured in the adsorbent and then eluted as a concentrate; purification depends on significant differences in binding characteristics of the product and impurities. In elution chromatography, you purify the product even while it is being diluted.
When large amounts of material are being processed, displacement chromatography may be attractive. In this method, the column is subjected to sequential step changes in inlet conditions (e.g., nature of solvent). The feed mixture is introduced, followed by a constant infusion of displacer solution. The displacer must have a higher affinity for the stationary phase than any compound in the feed solution. The displacer “pushes” solute off the stationary phase and back into the mobile phase. If conditions are chosen correctly, the feed components are forced into adjacent square-wave-like zones of concentrated, pure solutes. These zones then break through the end of the column with the zone having the solute with the lowest affinity for the stationary phase exiting first. The primary advantage of displacement chromatography over elution chromatography is the potential for higher throughput, but operation is more difficult, and high resolution (separation of solutes) can be difficult to obtain in some situations.
These chromatographic processes are almost always run as batch operations, although schemes for continuous or semicontinuous operation have been proposed. For the remainder of our discussion, we focus on elution chromatography as a batch process. Following are some important types of chromatographic methods:
• Adsorption chromatography (ADC) or normal phase chromatography is based on the adsorption of solute molecules onto solid particles, such as alumina and silica gel, by weak van der Waals forces and steric interactions.
• Liquid–liquid partition chromatography (LLC) is based on the different partition coefficients (solubility) of solute molecules between an adsorbed liquid phase and passing solution. Often the adsorbed liquid is nonpolar.
• Ion-exchange chromatography (IEC) is based on the adsorption of ions (or electrically charged compounds) on ion-exchange resin particles by electrostatic forces.
• Gel-filtration (molecular sieving) chromatography is based on the penetration of solute molecules into small pores of packing particles on the basis of molecular size and the shape of the solute molecules. It is also known as size exclusion chromatography.
• Affinity chromatography (AFC) is based on the specific chemical interactions between solute molecules and ligands (a functional molecule covalently linked to a support particle). Ligand–solute interaction is very specific, such as enzyme–substrate interaction, which may depend on covalent, ionic forces or hydrogen-bond formation. Affinity binding may be molecular size and shape specific.
• Hydrophobic chromatography (HC) or hydrophobic interaction chromatography (HIC) is based on hydrophobic interactions between solute molecules (e.g., proteins) and functional groups (e.g., alkyl residues) on support particles. This method is a type of reverse phase chromatography, which requires that the stationary phase is less polar than the mobile phase.
• High-pressure liquid chromatography (HPLC) is based on the general principles of chromatography, the only difference being high liquid pressure applied to the packed column. Owing to high-pressure liquid (high liquid flow rate) and dense column packing, HPLC provides fast and high resolution of solute molecules.
The choice of the stationary phase and consequently the type of chromatography depends on the nature of the solutes and process goals. Ion-exchange chromatography is widely used, particularly for recovery of proteins. This method offers good resolution of peaks, high capacity, and good speed. Hydrophobic chromatography and liquid–liquid partition chromatography share many of these attributes but are best applied when the aqueous phase is at high ionic strength. Also, organic solvents may be needed, which may denature proteins or create environmental problems. Adsorption chromatography is often relatively inexpensive, but resolution generally is not very sharp. Gel-filtration chromatography is good for buffer exchange and desalting and offers decent resolution. Because gels are compressible, capacity and throughput are often low, which typically restricts this technique to small-scale uses; new rigid packings for size exclusion chromatography allow faster flow rates and could increase throughput and scale. Affinity methods offer the possibility of very high selectivity and good capacity and speed. However, such methods can be extremely expensive, especially if based on antibodies. For real bioprocesses (e.g., recovery of proteins), multiple types of chromatography are used, since greater purity is possible if more than one basis of separation is used. Ion-exchange and affinity chromatography are the most widely used methods to recover proteins from bioprocesses.
A single chromatographic separation process may include more than one of these mechanisms. For example, adsorption chromatography using silica gel functions properly when the water content of silica gel is less than 15%. The system may operate as liquid–liquid partition chromatography when the water content exceeds 30%. In some cases, electrostatic and weak forces may be simultaneously functional.
A typical chromatographic column is shown in Figure 11.26, where a solution is flowing downward in the column and a solute is adsorbed on adsorbent solids by forming a band. As a first approximation, the solvent carries the solute downward as it moves along the axis of the column. It is assumed that a rapid equilibrium is established between the solute and adsorbent and that radial gradients are negligible.

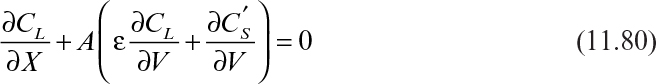
Assume that a small volume of solvent, ΔV, is poured through the band, which carries the adsorbed solute downward in the column. A material balance on solute over a differential column height of ΔX yields
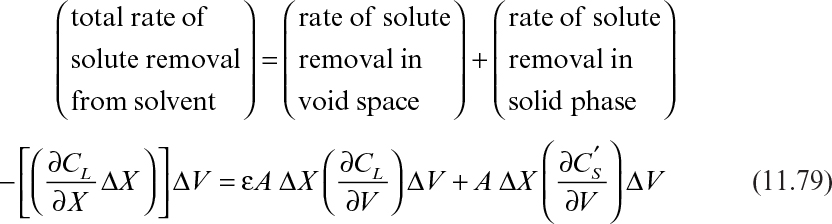
where ![]() is the amount of adsorbed solute per unit volume of column. Further simplification of equation 11.79 yields
is the amount of adsorbed solute per unit volume of column. Further simplification of equation 11.79 yields
In the simplest case, the amount of solute adsorbed per unit volume of column is closely related to the adsorption isotherm of the solute:
where M is amount of adsorbent per unit volume of column (mg/ml) and f(CL) is the adsorption isotherm or amount of adsorbed solute per unit amount of adsorbent, which is a function of CL. By substituting the derivative of equation 11.81 into equation 11.80, we obtain

Substitution of ∂CL/∂X = (∂CL/∂V)(∂V/∂X)c into equation 11.82 yields

Integration of equation 11.83 from X = X0 to X = X and V = V0 to V =V yields
Since ΔV, A, ε, and M are constants, ΔX is determined by f′ (CL), which is the derivative of f(CL), or the adsorption isotherm. That is, the location of the solute band formed is mainly determined by the adsorption characteristics of a particular solute on an adsorbent. When the solvent contains two components, I and J, the solutes form two distinct bands at different axial distances, depending on their adsorption characteristics (see Figure 11.27).

If we define LI as the distance traveled by solute I, LS as the distance traveled by solvent above the adsorption column (ΔV/A), and LC as the penetration distance of the solvent into the column (ΔV/Aε), then the retention factor (R) or the ratio of the distance traveled by solute I to that of solvent in the space above the column is given by
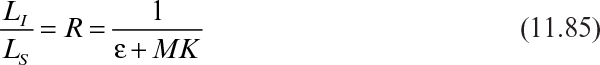
where K = f′(CL) = df(CL)/dCL partition coefficient. Similarly, we can define Rf as
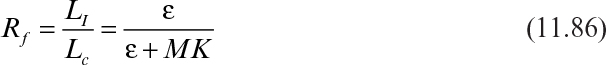
where Rf is the ratio of the travel distance of I to that of solvent in the column.
When component I is moved out of the column, then LI = L0 and LS = V0/A, where V0 is the volume of solvent required to displace the first drop of solvent out of the packed column. Then LS/LI becomes

where Vr is the ratio of solvent volume to column volume.
a. Determine the position (ΔX) of the solute band in the column when the solute concentration in the liquid phase at equilibrium is CL = 5 × 10⁻¹
b. Find the ratio of the travel distance of solute A (LA) to that of solvent B in the column (Rf) when CL = 5 × 10⁻²mg/ml(i.e., Rf).
a. CL = 5 × 10⁻²mg/ml

b. 
This theory of chromatography is applicable to fixed-column adsorption, partition, ion-exchange, and affinity chromatography. The theory of gel-filtration chromatography is somewhat different. In gel-filtration (molecular sieving) chromatography, solute molecules diffuse into porous structures of support particles, depending on their molecular size and shape. Small solute molecules get into the fine pore structures of the support particles and remain in contact with the solid for a “long” period, while large molecules interact with the outer surface and remain in contact with the solid for a “short” period. When the column is eluted, the largest molecules appear first in the eluent solvent, and the smallest molecules last. Different bands of solute molecules are obtained on the basis of their size and shape.
Consider the case where a buffer with the solutes of interest is added to the column, followed by sufficient washes to elute the original buffer solution.
The total volume of the buffer solution eluted from the column over a certain period of time is
where Ve is the total eluent buffer volume; V0 is the void volume in the column ( = Vε) which is the volume of fluid filling the void space outside the gel particles; Vi is the total void or pore volume inside the gel particles; and KD is the partition coefficient.
For large molecules that do not penetrate inside the gel structure, KD = 0; for small molecules that completely penetrate inside the gel, KD = 1. Equation 11.88 can be rewritten as
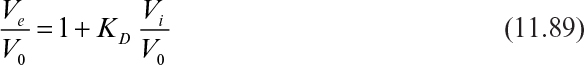
For a given solute mixture and gel beads, KD and the Vi/V0 ratio are fixed, and the Ve/V0 ratio is approximately constant, irrespective of column geometry and Ve.
Gel-filtration chromatography can be used to determine the MW of macromolecules. A plot of Ve/V0 versus log (MW) yields a straight line with a negative slope that is proportional with KD.
Affinity chromatography is based on the highly specific interaction between solute molecules and ligands attached on polymeric or ceramic beads in a packed column. The concept of affinity chromatography is described in Figure 11.28. The matrix is usually agarose. However, polyacrylamide, hydroxyethyl methacrylate, cellulose, and porous glass can also be used as the matrix bead. Spacer arms between the matrix and ligand are usually linear aliphatic hydrocarbons. The use of spacer arms may reduce the steric hindrance generated by the matrix. Coupling between the matrix and ligand depends on the functional groups present on the matrix and ligand. Chemically reactive groups on the support matrix usually are the —OH, —NH2, and —COOH groups. If the reactive group on the matrix is an —OH group (polysaccharides, glass, hydroxyalkyl methacrylate), then cyanogen bromide (CNBr) is used as a coupling agent. The cyanogen bromide–activated agarose reacts with primary amine groups present in proteins that act as ligands. After the desired solutes are bound to the ligand, elution is usually achieved by changing the pH or ionic strength in the column. Ligand-solute molecule interactions in affinity chromatography are very specific, such as enzyme–substrate or antigen–antibody interactions. That is, an enzyme inhibitor or substrate may be used as a ligand in separating a specific enzyme from a mixture. Monoclonal antibodies (MAb) may be used as a ligand to separate specific antigen molecules by affinity chromatography. Of particular interest in the biotechnological industry is the use of protein A, a cell-surface protein of Staphylococcus aureus, which binds the heavy chain of several mammalian immunoglobins.

Figure 11.28. Basic principles of affinity chromatographic separations. A suitable ligand is covalently attached to an insoluble matrix. In the adsorption step, only those molecules with a specific binding site for the ligand bind to the adsorbent; molecules without the proper geometric fit pass through unaffected. In the elution step, the bound molecules are disengaged from the column and collected. (With permission, from M. L. Yarmush and C. K. Colton, in M. Moo-Young, ed., Comprehensive Biotechnology, Vol. 2, Elsevier Science, London, 1985.)
Another type of affinity chromatography is immobilized-metal-affinity chromatography (IMAC), which exploits the different affinities that solutes (especially proteins) have for metal ions chelated to a support surface. A very attractive feature is the low cost of metals and the ease of regeneration of the stationary phase, particularly in contrast to affinity chromatography using antibodies. Typically, iminodiacetic acid (IDA) or nitrilotriacetic acid (NTA) linked to an agarose or silica gel support provides attachment sites for a metal ion. A variety of target proteins have been purified using zinc, copper, and nickel chelates. Water molecules normally solvate metal ions, but in the presence of a strong Lewis base (e.g., histidine residue in a protein), the water molecules can be displaced. The bonds that form between the immobilized metal and the base (protein) result in an adsorbed protein. Factors such as the accessibility, microenvironment of the binding residue (i.e., histidine, cysteine, and tryptophan), cooperation between neighboring amino acid side groups, and local conformations play important roles in the strength of binding and thus protein retention. Subsequent destruction of the bond by lowering the pH or adding a competing ligand in the mobile phase results in the elution of the metal binding protein.
Not all proteins naturally bind metals. However, IMAC can still be used if the genetic information for the desired protein is altered to include a tail that has high metal-binding affinity. Typically, the structural gene encoding the target protein is extended to code for a metal-binding peptide, resulting in production of a fusion protein of the target protein and tail. The amino acid sequence of the tail is based on a sequence of amino acids known to bind metals. A common choice is six adjacent histidines. Peptide libraries have also been used to generate effective affinity tails. The biggest drawback to the method is that for many applications the tail must be removed. The system can be designed with a linker between the tail and target protein that can be cleaved chemically. This design, however, adds additional steps to the process.
Our discussion of the theory of chromatography is based on many simplifying assumptions. Usually, the analysis of real columns is more complicated, owing to dispersion, wall effects, and lack of local equilibrium. Wall effects can be reduced by keeping the column-diameter-to-bead-diameter ratio larger than 10 (Dc/Db > 10). Bed compression can occur under some operating conditions and can further complicate analysis of the system by causing flow irregularities such as viscous fingering.
Understanding these hydrodynamical and kinetic effects is also critical to scale-up of chromatographic processes. These effects alter the shape of the peaks exiting the column. In addition to these flow effects, the step controlling the rate of adsorption will alter peak shape. For a porous support internal diffusion, diffusion through the external film, or external dispersion (Taylor dispersion) in laminar flow can control the rate of mass transfer. Let us consider a more quantitative description of these ideas.
Figure 11.29 depicts the output from a chromatography column. Referring to this figure, we can define some key characteristics of the output. The resolution of two adjacent peaks, RS, is
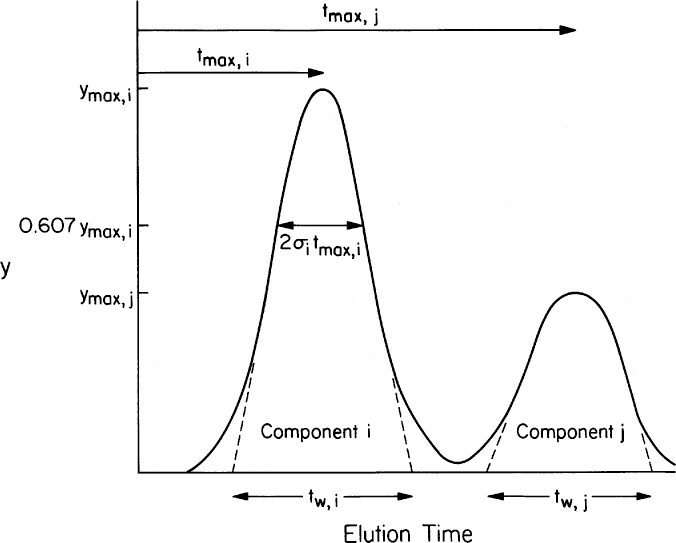
Figure 11.29. Schematic of output from a chromatography column. The relative tmax values are used to calculate resolution, while the standard deviation of a peak (σtmax,i) is used to estimate yields, purity, and capacity and is used in scale-up.
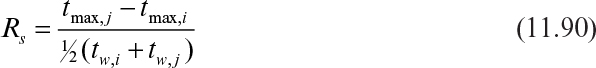
The yield is defined as the amount of a solute, such as i, collected between times t1 and t2 divided by the total amount of i injected into the column:
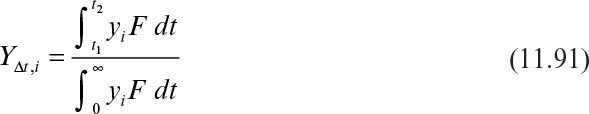
where yi is the concentration of solute, i, and F is the solvent flow rate.
The value of yi can be estimated from the peak height and shape if the peak is assumed to be Gaussian. This assumption leads to

where tmax,i is the time at which the maximum amount of i elutes, t is elution time, and σtmax,i is the standard deviation for peak i. Then the yield can be calculated as follows:
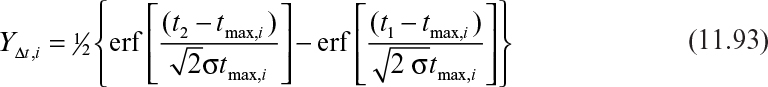
where erf is the error function as defined by

The purity is defined as the amount of solute i eluted in Δt divided by the total sum of all solutes eluted in Δt:
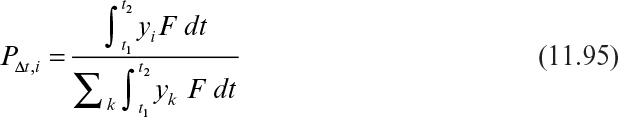
The key in this analysis is σ. The value of σ will depend on dispersion and adsorption kinetics. With a more detailed analysis, the following can be shown:

where v is the superficial fluid velocity (i.e., volumetric flow rate divided by column diameter A), ka is the surface “reaction” rate consisting of a reaction rate (k) and available surface area (a), and l is column length. Note that σ2 in equation 11.96 equals a flow rate divided by the reaction rate and is effectively a Peclet number. The value of σ2 depends on rate-controlling step; for example,†
† See P. A. Belter, E. L. Cussler, and W. S. Hu, Bioseparations, Wiley, New York, 1988.


In these equations, d is the diameter of the particle used to pack the column and D is the effective diffusion coefficient of the solute.
Consider the problem of scale-up of a chromatography process to handle increasing amount of product. One approach might be to increase solute concentration while using the same column. The danger here is that the packing would become saturated, which would reduce purity and yield. Another approach might be to increase both d and A so as to maintain a constant particle-size-to-bed-diameter ratio. Such an approach maintains flow patterns, but note from equations 11.97, 11.98, and 11.99 that σ would increase if d increased. Higher values of σ indicate broadening of peaks and reduced resolution, yield, and purity. Another approach is to fix d and increase both v and l, but maintain the ratio of v to l constant. While this approach will mathematically keep σ constant, it has practical limitations. Lengthening the column increases pressure drop. Since many packings are soft, they compress further, thereby increasing pressure drop, reducing flow, and altering flow patterns. Some chromatography columns have been made in segments, each less than 30 cm in height; segmentation reduces the bed-compression problem. Another approach is to increase A and volumetric flow to maintain a constant v and hence constant σ. This approach yields a “pancake” column. It is quite workable if the liquid can be applied uniformly over the surface of the column.
Recent advances in the design of packings (particles) for chromatography columns have also assisted in scale-up. Rigid, mechanically strong particles with macropores allow convective flow both around and through particles. The macropores are intimately connected with the micropores, so good mass transfer is maintained. These particles allow fast flow of solvent and solutes and reduce problems of bed compression, allowing column length to be increased.
a. Estimate how long the column must be operated to achieve 95% yield.
b. Estimate how long the column must be operated if the flow is increased to 40 cm/h and Taylor dispersion is the rate-controlling step.
a. Note the following:
From equation 11.88, the yield where t1 = 0† is
† Note that erf (–x) = –erf x and erf (–5.9) = –1.
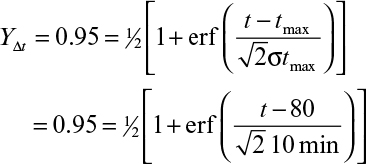
or t = 96.4 min.
b. With twice the flow tmax becomes 40 min. Since for Taylor dispersion, σ ∝ v1/2,
For yield = 0.95, the time required is estimated as

or t = 51.6 min.
11.4.10. Electrophoresis
Electrophoresis is used for the separation of charged biomolecules according to their size and charge in an electric field. In an electric field, the drag force on a charged particle is balanced by electrostatic forces when the particle is moving with a constant terminal velocity. A force balance on a charged particle moving with a terminal velocity in an electric field yields
or
where q is the charge on the particle, E is electric field intensity, DP is particle diameter, μ is the viscosity of the fluid, and Vt is the terminal velocity of the particle.
Depending on the pH of the medium, electrostatic charges on protein molecules will be different. When pH > pI, the protein will be negatively charged; and when pH < pI, the charge on the protein will be positive. The net charge on the protein will determine the velocity of the protein. When a protein molecule is placed in a pH gradient, the electrophoretic velocity becomes zero when pH = pI, since the net charge on the protein is zero at pH = pI. Precipitation of proteins in a pH gradient at their isoelectric point is known as isoelectric focusing. Since the size and charge of protein molecules are different at a given pH, the terminal velocity of the proteins will be different according to equation 11.101, and therefore, proteins will be separated from each other in an electric field. Certain gels, such as agar or polyacrylamide, are used for protein separations by gel electrophoresis. Gel electrophoresis is an important analytical separation technique. Scale-up is problematic due to thermal convection resulting from electrical heating.
One analytical and micropreparative version of protein electrophoresis that has excellent resolution is called two-dimensional electrophoresis (2DE). The 2DE procedure is actually the series combination of two electrophoretic separations, which resolve protein mixtures based on two independent characteristics: charge and size. Proteins are first separated in a polyacrylamide gel matrix using isoelectric focusing, an equilibrium separation technique that resolves proteins based on their respective isoelectric points. Proteins are subsequently coated with an anionic surfactant and separated by size in another polyacrylamide gel. Finally, proteins are detected using a chemical stain, by autoradiography, or by other methods. The result of this two-dimensional separation is a high-resolution fingerprint of protein expression that is characteristic of a particular biological system. This technique has at least two orders of magnitude better resolution than any other analytical tool for protein analysis. Separated protein spots can be cut out of the polyacrylamide gels and subjected to further microchemical analysis to determine the amino acid sequence.
11.4.11. Electrodialysis
Electrodialysis (ED) is a membrane separation method used for the separation of charged molecules from a solution by application of a direct electric current. The membranes contain ion-exchange groups and have a fixed electrical charge. Positively charged membranes (anion membranes) allow the passage of anions and repel cations; negatively charged membranes (cation membranes) allow the passage of cations and repel anions. This method is very effective in the concentration of electrolytes and proteins.
The ED process is driven by electrostatic forces and can be used to transfer salts from low to high concentration. Salt solutions can be concentrated or diluted by this method. The ED method is much faster than dialysis and is a more efficient desalting method.
Ion-exchange membranes (IEM) used in ED units are in essence ion-exchange resins in sheet form. IEMs contain mobile counterions that carry electric current. The cation-exchange membrane consists of polystyrene with negatively charged sulfonate groups bonded to phenyl groups in polystyrene. Anion membranes contain positively charged quaternary ammonium groups (—N3R+) chemically bonded to the phenyl groups in the polystyrene. Mobile counterions account for the low electrical resistance of the membranes. To control swelling of sulfonated polystyrene, some cross-linking agents such as divinyl benzene are included in the polymer. A typical ED membrane has a pore size of 10 to 20 Å with a capacity of 2 to 3 mEq/g dw resin. Membrane thickness is on the order of 0.1 to 0.6 mm, and electrical resistance is approximately 3 to 30 ohm/cm2.
ED units can be used for concentration and dilution of salts, ion substitution, and electrolysis. A schematic of an ED unit used for concentration and dilution of salts is depicted in Figure 11.30. The unit contains a number of diluting and concentrating compartments separated by alternating anion–cation membranes and two electrodes, the cathode and anode. ED units can also be used for ion-substitution purposes to change the ionic composition of a process stream. If the ionic liquid stream is passed between two membranes of the same charge (two cation or two anion exchange membranes), ions will be transferred from the solution in one direction through one membrane, and equivalent ions of the same charge will be transferred into the solution through the opposite membrane from a makeup solution on the other side of the membrane. In electrolytic ED units, electrodes play an important fundamental role in the process. Two electrode compartments are separated by a membrane in electrolytic units. An example of an electrolytic ED unit is a chlor-alkali cell in which an NaCl solution is electrolyzed and converted to NaOH and Cl.

Figure 11.30. Schematic of concentrating-diluting multicell pair electrodialysis process. (With permission, from S. M. Jain and P. B. Reed, in M. Moo-Young, ed., Comprehensive Biotechnology, Vol. 2, Elsevier Science, London, 1985.)
11.5. Finishing Steps for Purification
The major finishing steps in fermentation-product purification are crystallization and drying, particularly for low-MW products.
11.5.1. Crystallization
Crystallization is usually the last step in producing highly purified products such as antibiotics. Crystallization operates at low temperatures to minimize thermal degradation of heat-sensitive materials. Operations are conducted at high concentrations, and therefore, unit costs are low and separation factors are high. The determination of optimal crystallization conditions is a matter of empirical experimentation, since phase diagrams and pertinent kinetics for specific systems are usually not available. The output of crystallization is a slurry of product crystals in a liquor of solvent and uncrystallized impurities. Recovery of the solid crystals from the slurry is then needed.
High-purity crystals are recovered from the slurry by using batch Nutsche-type filters or centrifugal filters. The following equation is used for the filtration of crystal slurries, assuming the crystals are noncompressible and the resistance of the filter medium is negligible:
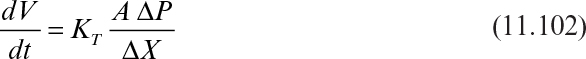
where ΔX is the thickness of crystal layer, t is time, V is liquid volume, ΔP is pressure drop, A is surface area, and KT is the transfer coefficient. Substituting W ∞ V, where W is the amount of solids in the cake, and integrating equation 11.102, we obtain
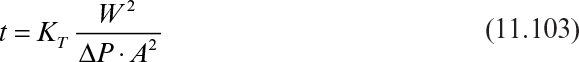
A typical centrifugal filter combines a bowl centrifuge with a filter, and the following relationship is used to determine the filtration–crystallization rate for centrifugal filters:

where N is the rotational speed, α is the specific cake resistance, W is the amount of solids in the cake, Am is the log mean area, and RM is the medium resistance.
The nature and size of crystals affect the centrifugation and washing rates; therefore, crystallization and recovery steps are interrelated and should be considered together in the optimization of crystallization operations. After washing, the crystals are discharged for drying.
11.5.2. Drying
The removal of solvent from purified wet product (crystal or dissolved solute) is usually achieved by drying. In selecting drying conditions, the physical properties of the product, its heat sensitivity, and the desirable final moisture or solvent content must be considered. The parameters affecting drying can be classified in four categories: physical properties of the solid–liquid system, intrinsic properties of the solute, conditions of the drying environment, and heat-transfer parameters.
Following are the major types of dryers used for drying fermentation product:
• Vacuum-tray dryers consist of heated shelves in a single chamber and are usually used for pharmaceutical products such as antibiotics. This is a good method for small batches of expensive materials, where product loss and heat damage must be minimized.
• Freeze drying (lyophilization) is a method where water is removed by sublimation (from solid ice to vapor) from the frozen solution. The freezing can be accomplished either outside or inside the vacuum chamber prior to drying. This method is used for drugs in vials such as antibiotics, enzyme solutions, and bacterial suspensions.
• Rotary-drum dryers are not good for crystal solutions. Water is removed by heat conduction over a thin film of solution on the steam-heated surface of the rotating drum. The dried product is scraped from the drum with the aid of a knife at the discharge point.
• Spray dryers employ atomization and spraying of product solution into a heated chamber through a nozzle. Hot gas inside the chamber provides the necessary heat for evaporation of the liquid. Dried particles are separated from hot gases using cyclones. Spray dryers are expensive to purchase but are often the preferred method for heat-sensitive materials.
• Pneumatic conveyor dryers use a hot-air stream to suspend and transport particles. The retention time of a particle in the gas stream is short, usually a few seconds. Such systems work well when surface drying is critical, but they do not provide sufficient exposure times to dry large, porous particles where water removal is diffusion controlled. Pneumatic conveyor systems are well suited for heat-sensitive and easily oxidized materials.
11.6. Integration of Reaction and Separation
The separate optimization of fermentation and recovery does not necessarily yield the optimal process. Traditionally, the strain development, fermentation, and recovery experts worked essentially in isolation although this has begun to change. A lack of formal training of engineers in basic biological concepts and of biologists in engineering and process concepts has made an integrated view of the bioprocesses difficult to obtain. Systems have been optimized sequentially, with only modest feedback from downstream to upstream. With improved cross-training of both engineers and biologists, it has become possible to begin to build better processes.
One form of this integration is to try to couple some aspects of recovery and purification with the bioreactor. The motivation for such approaches has come initially from a desire to relieve product inhibition and thereby increase reaction rates and/or allow the use of a more concentrated feed. However, other advantages may accrue, such as improved selectivity for the product of interest, conversion of a primarily intracellular to an extracellular product, and protection of a product from degradation.
Isolated examples of attempts at bioprocess integration stretch back to the beginning of modern biochemical engineering. In the 1970s, the energy crisis and interest in ethanol production spawned many suggested approaches to bioprocess integration. Some early approaches to such process integration include vacuum fermentation, membrane processes, addition of solid adsorbents, and liquid extractants.
One example is a reactor system that allows the use of tributylphosphate (TBP) as an extractant of ethanol from fermentation broths. Although TBP had been recognized as an attractive solvent for this purpose, its direct use for in situ extraction was thought to be impossible because of toxicity. However, further work led to the recognition that a solvent could be toxic due to two features: a chemical or molecular level toxicity caused by solvent dissolved in aqueous broth, and a physical or phase toxicity caused by direct interaction of yeast with droplets of emulsified solvent. It turned out that TBP’s toxicity was solely due to phase toxicity. One way to circumvent phase toxicity is to immobilize cells in a manner that allows entry of nutrients and exit of product while excluding droplets of solvent. A device that can do this is a multimembrane bioreactor (Figure 11.31).
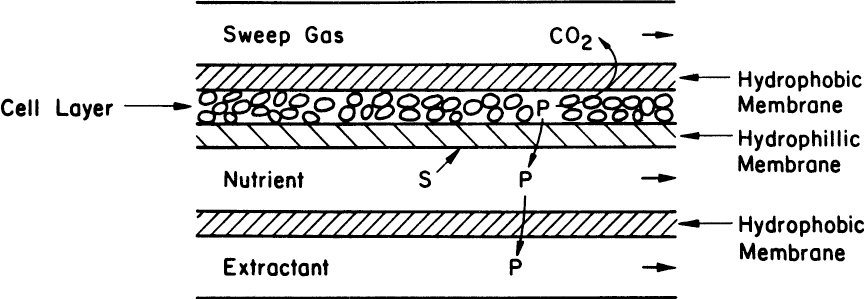
Figure 11.31. Example of a multimember reactor. The extractant fills the pores of the hydrophobic membrane but cannot pass into the nutrient solution if the pressure on the nutrient side is higher than on the extractant side. S is the substrate and P is the product. (From T. Cho and M. L. Shuler, Biotechnology Progress 2:1, pp. 53–60, 1986. With permission from John Wiley & Sons.)
With a hydrophobic membrane, the solvent will readily fill the pores of the membrane. If the aqueous solution is at a pressure higher than the solvent but less than the critical entry pressure of the aqueous solution into the membrane pores, then the solvent is effectively immobilized in the membrane. Such a system allows in situ solvent extraction of product while preventing the emulsification of solvent and phase toxicity. The primary advantages for this type of bioreactor are the use of more concentrated feeds, relief of feedback inhibition, and reduced distillation or separation costs (e.g., for ethanol recovery).
Not only can this integrated view be expressed through the addition of extracting agents, but it can be expressed at the molecular level. Several groups have worked on protein excretion into the extracellular compartment from E. coli using appropriately constructed plasmids. The motivation for this approach has been to greatly simplify recovery and purification rather than to achieve any potential increases in reactor productivity.
It is important for the bioprocess engineer to consider the whole system. The design or choice of culture, reactor configuration, and separation and purification train must be made carefully. Small changes in the upstream process can either greatly simplify or complicate the design of the downstream process.
11.7. Summary
The recovery and purification of products at the end of fermentation processes is an essential step. Product separation can be accomplished either integrated with or following the fermentation step. The major categories of separation of fermentation products are separation of biomass or other insoluble products, concentration or primary isolation of product, purification, and finishing (drying and packaging).
When the product is the biomass, the separation strategy is relatively simple and involves filtration or centrifugation following coagulation–flocculation of the cells. Drying is required for a marketable biomass, such as a single-cell protein source.
For soluble products such as antibiotics, enzymes, and organic acids, the separation strategy depends on whether the products are extracellular or intracellular. Some products can be both. For intracellular products, the cells need to be disrupted for the release of the products. Mechanical, chemical, and enzymatic methods can be used for cell disruption. Products need to be separated from the other cell and medium components after cell disruption. Depending on the type and the MW of the product, separation methods involve the removal of cell debris by centrifugation or filtration, followed by extraction or precipitation (for protein products) of the product. The separation strategy for extracellular products is simpler than that for intracellular products, since cell disruption is not required. After the separation of the biomass from the fermentation medium, the product is separated from the broth by one or a combination of the following methods: liquid–liquid extraction (antibiotics), two-aqueous-phase extraction (enzymes), adsorption (antibiotics), or precipitation (proteins). Often, the product must be crystalized and dried before packaging.
Protein (enzymes, hormones, therapeutics) separations usually require a special strategy. Proteins are usually precipitated from the media either by salting-out or by the addition of organic solvents. The desired protein is crudely separated from other protein components, usually by ultrafiltration on the basis of its MW. Then some chromatographic methods, such as ion-exchange or affinity chromatography, need to be used for further purification. Depending on the chemical nature of the desired protein and the composition of the protein mixture, sometimes special protein separation methods, such as isoelectric focusing or electrophoresis (for charged proteins), may need to be used, although these are used more for research or analytic purposes.
Simultaneous separation and fermentation schemes offer special advantages over consecutive schemes, since they may overcome product inhibition and provide a more compact and economical alternative. Membrane, adsorptive, or extractive separation schemes can be utilized for the simultaneous separation of products during fermentation.
Suggestions for Further Reading
BAILEY, J. E., AND D. F. OLLIS, Biochemical Engineering Fundamentals, 2d ed., McGraw-Hill, New York, 1986.
BELTER, P. A., E. L. CUSSLER, AND W. S. HU, Bioseparations, Wiley, New York, 1988.
BLANCH, H. W., AND D. S. CLARK, Biochemical Engineering, Marcel Dekker, New York, 1996.
ECKENFELDER, W. W., Industrial Water Pollution Control, 2d ed. McGraw-Hill, New York, 1989.
FLICKENGER, M. C., Downstream Industrial Biotechnology: Recovery and Purification, Wiley, New York, 2013.
GHOSH, R., Principles of Bioseparations Engineering, World Scientific Publishing Company, Hackensack, NJ, 2006.
HARRISON, R. G., P. W. TODD, S. R. RUDGE, AND D. P. PETRIDES, Bioseparations Science and Engineering, 2d ed., Oxford University Press, New York, 2015.
JUNGBAUER, A., “Continuous Downstream Processing of Biopharmaceuticals,” Trends Biotechnol. 8: 479–492, 2013.
MARICHAL-GALLARDO, P. A, AND M. M. ALVAREZ, “State-of-the-Art in Downstream Processing of Monoclonal Antibodies: Process Trends in Design and Validation,” Biotechnol. Progr. 28: 899–916, 2012.
Problems
11.1. Yeast cells are recovered from a fermentation broth by using a tubular centrifuge. Sixty percent of the cells are recovered at a flow rate of 12 l/min with a rotational speed of 4000 rpm. Recovery is inversely proportional to flow rate.
a. To increase the recovery of cells to 95% at the same flow rate, what should be the rpm of the centrifuge?
b. At a constant rpm of 4000 rpm, what should be the flow rate to result in 95% cell recovery?
11.2. Gentamycin crystals are filtered through a small test filter medium with a negligible resistance. The following data were obtained:
The pressure drop in this test run was 1.8 times that when water was used with a filter area of 100 cm2. The concentration of gentamycin in solution is 5 g/l. How long would it take to filter 5000 l of gentamycin solution through a filter of 1.5 m2, assuming the pressure drop is constant and μ = 1.2 centipoise?
11.3. Streptomycin is extracted from the fermentation broth using an organic solvent in a countercurrent staged extraction unit. The distribution coefficient of streptomycin at pH = 4 is KD = Yi/Xi = 40, and the flow rate of the aqueous (H) phase is H = 150 l/min. If only five extraction units are available to reduce the streptomycin concentration from 10 g/l in the aqueous phase to 0.2 g/l, determine the required flow rate of the organic phase (L) in the extraction unit.
11.4. A new antibiotic is separated from a fermentation broth by adsorption on resin beads in a fixed bed. The bed is 5 cm in diameter and contains 0.75 cm3 resin/cm bed. The overall mass transfer coefficient is 12h–1. If the antibiotic concentration in the feed is 4 g/l and is desired to be 0.1 g/l in the effluent in a 50 cm column, determine the liquid flow rate through the column. The equilibrium relationship is ![]() , and the operating-line relationship is CS = 5CL, where CS is g solute/l resin and CS is g solute/l solution.
, and the operating-line relationship is CS = 5CL, where CS is g solute/l resin and CS is g solute/l solution.
11.5. An activated carbon adsorption column is used for removal of phenolic compounds from wastewater. The feed and desired effluent adsorbate concentrations are Co = 100 mg/l and Ce = 1 mg/l, and the flow rate is F = 10 m3/h. Adsorption column contains 3 m3 activated carbon with 30% void fraction and the column diameter is Do = 0.5 m. Adsorption capacity and rate for activated carbon are No = 60 kg adsorbate/m3 bed and K = 0.8 m3/kg-h.
a. Determine the adsorption column height and service time.
b. Using the same column characteristics, determine column height for 10 days of operation.
11.6. Refractory organic compounds are removed from aqueous phase by using an activated carbon adsorption column. For the feed flow rate of 5 m3/h and the feed and effluent organics concentrations of 40 and 0.5 mg/L, the column can be operated for 3 days when column height was 3 m. The same column is operated for 6 days when H = 5 m. Do = 0.6 m.
a. Determine adsorption capacity (No) and the rate constant (K) for the activated carbon adsorption column.
b. For the same column characteristics, determine the required column height when the flow rate doubles for 6 days of operation.
c. Determine the volume and the weight of required AC if void fraction is 35% and density of AC is 2 g/cm3 for the column in part (b).
11.7. In a cross-flow ultrafiltration unit, a protein of MW = 3 × 10⁵ da is separated from the fermentation broth by using a UF membrane. The flow rate of liquid through a tube of diameter d = 2 cm and length L = 50 cm is Q = 2 l/min. The flow regime is turbulent, f = 0.0005, and C4 = 2 [atm (s/cm)2]. The inlet pressure is Pi = 2 atm. Protein concentrations in the solution and on gel film are CB = 30 mg/l and CG = 100 g/l, respectively.
a. Determine the exit pressure (P0).
b. Determine the transmembrane pressure drop (ΔPM).
c. If the mass transfer coefficient (k) for protein flux is k = 5 cm/s, determine the flux of liquid through the UF membrane (J).
d. If the resistance of the filter is RM = 0.002 atm/cm2-s/cm3, determine the cake resistance, RG.
11.8. Components A and B of a binary mixture are to be separated in a chromatographic column. The adsorption isotherms of these compounds are given by

where k1 = 0.2 mg solute A absorbed/mg adsorbent
k2 = 0.1 mg solute/ml liquid
k′1 = 0.05 mg solute B adsorbed/mg adsorbent
k′2 = 0.02 mg solute/ml liquid
The bed contains 3 g of very fine support particles. The bed volume is 150 ml, bed porosity is ε = 0.35, and the cross-sectional area of the bed is A = 6 cm2. The volume of the mixture added is ΔV = 50 ml.
a. Determine the position of each band A and B in the column, LA and LB (or ΔXA and ΔXB).
b. Determine LA/LB; RfA = LA/Lc; RfB = LB/Lc when CA = 10–1 mg/ml and CB = 0.05 mg/ml in liquid phase at equilibrium.
11.9. Consider the use of gel chromatography to separate two proteins, A and B. The partition coefficient (KD) for A is 0.5 and for B is 0.15. The void volume in the column, Vo, is 20 cm3. The void volume within the gel particles, Vi, is 30 cm3. The total volume of the column is 60 cm3. The flow rate of eluent is 100 cm3/h. Ignoring dispersion and other effects, how long will it take for A to exit the column? How long for B?
11.10. Biomass present in a fermentation broth is to be separated by vacuum filtration. Following are the filter and broth characteristics:
a. If rate of filtration has a constant value of dV / dt = 50 1/min, determine the cake and filter resistances at t = 30min.
b. Determine the filter surface area (A) required to filter 5000 l broth within 60 min with the same pressure drop across the filter.
11.11. A fermentation broth with a protein concentration of C0 = 100 mg/l and flow rate of Q = 4 m3/h is passed through two downflow adsorption columns connected in series. The adsorption isotherm is q = 4C1/4. Assume the system is in equilibrium.
a. Calculate the minimum amount of activated carbon required for two days of operation if removal efficiency for the column is E = 50%.
b. Protein concentration in the effluent of the second column is desired to be C = 0.5 mg/l. Determine the minimum amount of activated carbon required for two days of operation.
11.12. In a cross-flow ultrafiltration system used for filtration of proteins from a fermentation broth, gel resistance increases with protein concentration according to the following equation:
RG = 0.5 + 0.01(C), where C is in mg/l.
Pressure at the entrance of the system is Pi = 6 atm and at the exit is P0 = 2 atm. The shell side of the filter is open to the atmosphere, resulting in Pf = 1 atm. The membrane resistance is RM = 0.5 atm/(mg/m2-h), and protein concentration in the broth is C = 100 mg/l.
a. Determine the pressure drop across the membrane.
b. Determine the filtration flux.
c. Calculate the rejection coefficient of the membrane for effluent protein concentration of Cf = 5 mg/l.
11.13. A solute protein is to be separated from a liquid phase in a chromatographic column. The adsorption isotherm is given by
where CS is the solute concentration in solid phase (mg solute/mg adsorbent) and CL is the liquid phase concentration of solute (mg solute/ml liquid). Use the following information:
a. For V = 400 ml and X = 25 cm, determine the equilibrium solute concentrations in liquid and solid phases.
b. Determine the ratio of travel distances of solute to solvent, Rf.
11.14. Proteins A and B are to be separated using ion-exchange chromatography. When using a superficial fluid velocity of 30 cm/h, peak A exits with ymax at 50 min and peak B exits with ymax at 100 min. For peak A, the standard deviation is 12 min, and for peak B, 18 min.
a. Assuming that Taylor dispersion controls and that v is increased to 60 cm/h, what will be the values for the peak elution times and standard deviations for A and B?
b. For v = 60 cm/h, sketch the two peaks and calculate the resolution of the two peaks (Rs). (You may find Figure 11.29 to provide helpful guidance).
c. Would you recommend increasing v to 60 cm/h to increase throughput? Why or why not?
11.15. Consider the scale-up of a chromatography column for purification of a protein. A column of 40 cm length is used with a superficial velocity of 40 cm/h. The peak concentration of the target protein exits at a time of 100 min. The standard deviation of the peak is 14 min.
a. How long must you wait to collect 90% of the protein?
b. If the same column is used, but velocity is increased to 60 cm/h and external or Taylor dispersion controls, what will be the value of σ?
c. If the column is lengthened to 60 cm while the velocity is at 60 cm/h, how will σ change? Will the peak be sharper or broader than at 40 cm/h with a 40 cm column?