
Debugging is an essential step in any app development. It is also an essential part of an IDE and Code::Blocks is no exception. It offers a vast set of features to make app debugging easier.
In this chapter, we will learn about app debugging with Code::Blocks. We'll begin with a simple app to show various features of Code::Blocks.
Code::Blocks supports two debuggers:
- GNU Debugger or, as it is popularly known as GDB
- Microsoft Console Debugger or CDB
Code::Blocks installer bundles GDB together with GCC compiler. CDB can be downloaded and installed together with installation of Windows Software Development Kit (SDK) for Windows.
Note
Windows SDK is a collection of tools offered by Microsoft for Microsoft Windows platform. It consists of compiler, headers, libraries, debugger, samples, documentation, and tools required to develop applications for .NET Framework.
CDB can be downloaded and installed from the following link:
http://msdn.microsoft.com/en-us/library/windows/hardware/gg463009.aspx
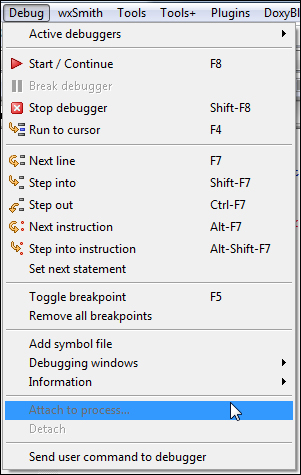
Our focus will be on GDB throughout this chapter. Debugger related functions are available via the Debug menu in Code::Blocks as shown in the following screenshot. A debugger toolbar is also provided for quicker access to commonly used functions.
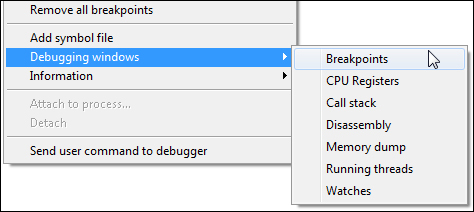
We can access several debugger related windows by navigating to Debug | Debugging windows menu options. The following screenshot shows available menu options.
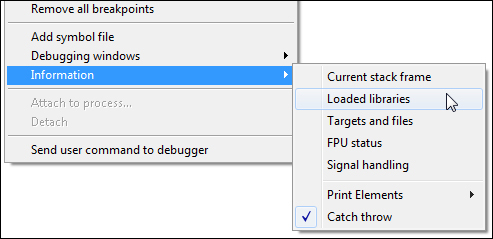
We can get more information about running process from Debug | Information and then clicking on appropriate menu option. The following screenshot shows available menu options:
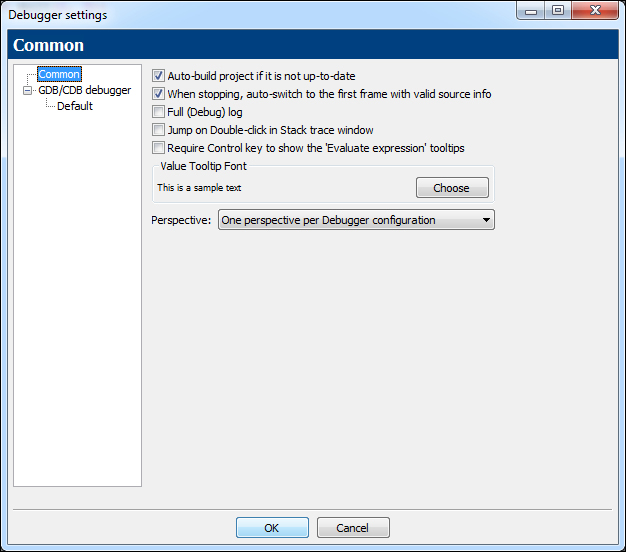
Debugger settings can be accessed by navigating to Settings | Debugger menu option. The following screenshot shows the debugger settings dialog:
Select Default in the tree on the left-hand side and more debugger related options will be available as shown in the following screenshot:
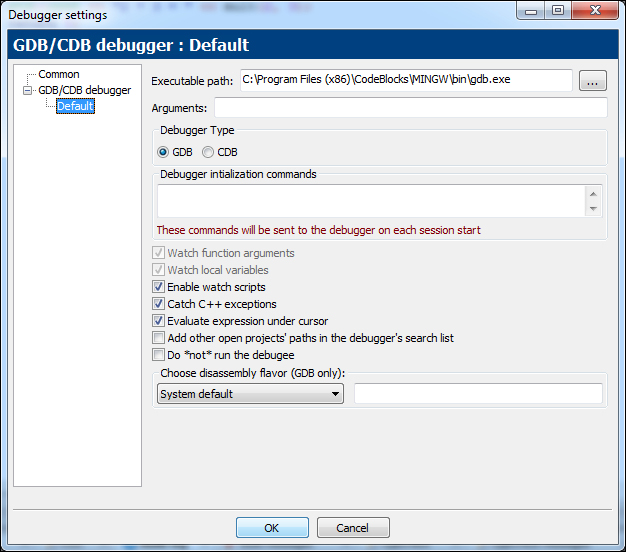
Select the Evaluate expressions under cursor option shown in the previous screenshot. This option will provide a tooltip containing details whenever cursor is moved over a variable.