
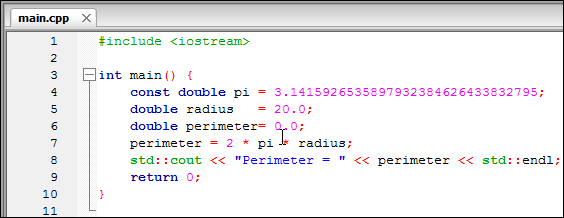
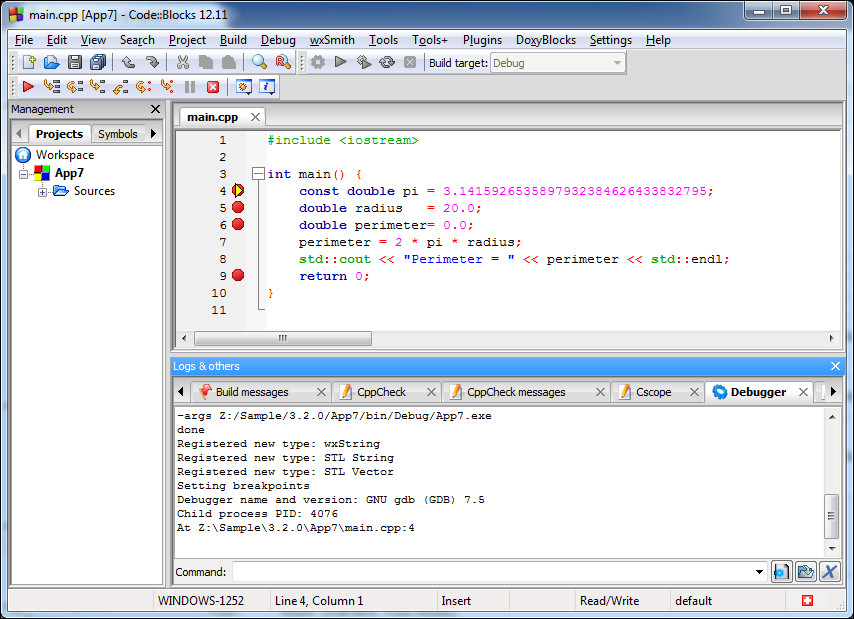
Let us create a new console project App7 and replace code inside main.cpp file with following code:
#include <iostream>

int main() {
    const double pi = 3.1415926535897932384626433832795;
    double radius   = 20.0;
    double perimeter= 0.0;
    perimeter = 2 * pi * radius;
    std::cout << "Perimeter = " << perimeter << std::endl;
    return 0;
}
Ensure that Debug target is selected in compiler toolbar and then compile it by clicking compile button. App7 will be compiled for debugging.
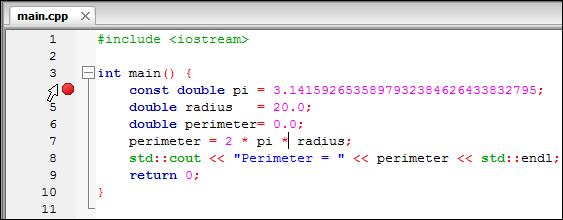
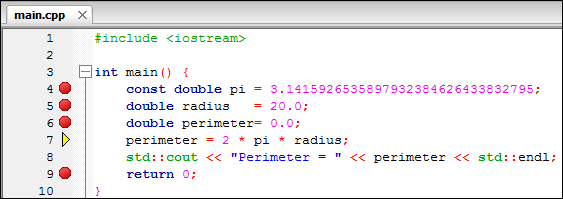
Before we ask GDB to debug we have to create breakpoints for it. After the code is typed in editor window Code::Blocks will look similar to the following screenshot.
To set a breakpoint move cursor to the left side of editor window next to the indicated line numbers. Now the cursor will change to a right-tilted cursor. Pause mouse and left-click. A breakpoint will be set there and will be indicated by a red circle. The following screenshot shows that a breakpoint has been set at line number 4.
Next follow same method and create breakpoints at line numbers 5, 6 and 9. Editor window will now look similar to the following screenshot:
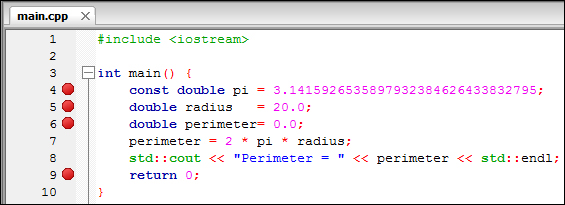
All breakpoints are now visually indicated in the editor window.
We can now start debugging by clicking on the Debug/Continue button in debugger toolbar. Alternatively the F8 key may be used to start debugging. The following window may appear:
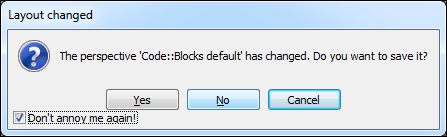
This highlights that default layout of Code::Blocks has changed as the Debugger log window has received focus (refer to the preceding screenshot). Select the Don't annoy me again! checkbox and then click on No button to stop it. It won't appear again. Let's look at the entire IDE now.
In the following screenshot execution has stopped at line number 4 and the cursor has changed to a yellow colored triangle. This indicates that debugger has stopped execution at that position. Debugger log window will also be updated when we continue debugging.
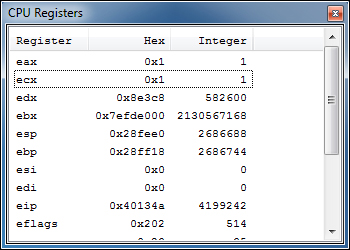
Before continuing with debugging we take a look at debugger related features of Code::Blocks. CPU Registers can be examined by navigating to the Debug | Debugging windows | CPU Registers menu option. A register is a tiny but a high speed buffer embedded within the processor hardware.
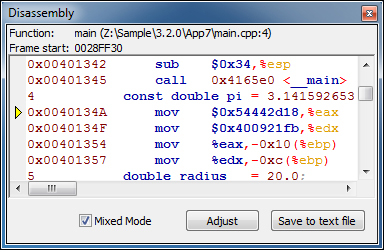
Now navigate to the Debug | Debugging windows | Disassembly menu option; this can be used to display assembly language representation of current C++ code. The following screenshot shows the Disassembly window and also indicates the position where execution has stopped. Clicking on the Mixed Mode checkbox will superimpose C++ code and corresponding assembly language code:
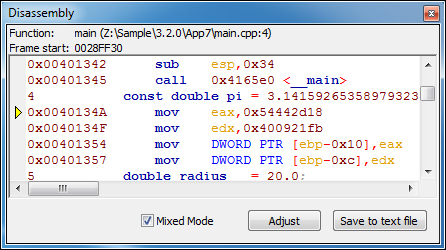
This style of assembly language is known as AT&T style. We can switch to Intel style assembly language in the disassembly dialog by navigating to the Settings | Debugger | GDB/Debugger | Default menu option and selecting the Intel option in Choose disassembly flavor (GDB only) combo box. Now close the previously opened disassembly dialog and reopen it. It will now show disassembly in Intel flavor as shown in the following screenshot. Please note that the choice of AT&T or Intel style is up to the preference of a developer. It has no effect on the debugging process.
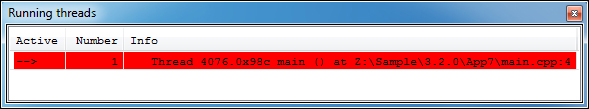
Currently running threads can be examined by navigating to Debug | Debugging windows | Running threads menu option. This app is single threaded and thus in the following screenshot we find that only one thread is running:
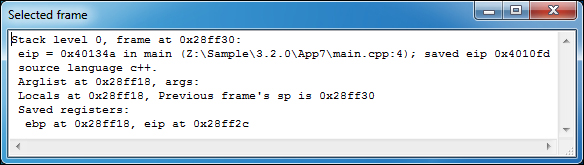
Stack frame can be examined by navigating to Debug | Information | Current stack frame menu option. Call stack is a data structure that stores information about current running function. The following screenshot shows the stack frame information of current process:
Whenever an app is run on Windows platform several Dynamic Link Libraries (DLL) or dynamic libraries are loaded in memory. DLL provide functions that are accessible by other apps without including a copy of function code inside the apps using it. Loaded libraries can be examined by navigating to Debug | Information | Loaded libraries menu option.
The following screenshot shows the loaded libraries for our app:
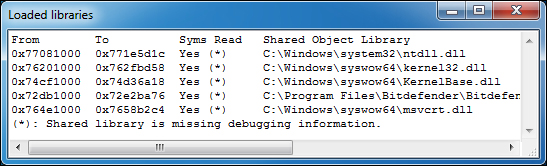
The asterisk next to the DLL name indicates whether their source can be debugged. We find that none of them allows debugging.
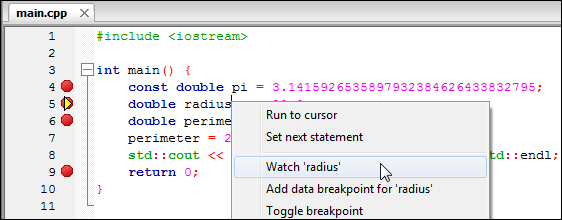
Now we'll continue with debugging after our introduction to several debugger related windows. We'll also learn to set watch on a variable. Click on the Continue button and debugger will stop at line number 5. Right-click on radius variable in editor window and then choose watch 'radius' menu option.
This will create a watch on the variable radius. A watch can be defined as an instruction to the debugger to track a variable during execution of an app. A separate window with the variable under watch will now be opened as shown in the following screenshot. Watch window can also be opened via Debug | Debugging Windows | Watches menu option:
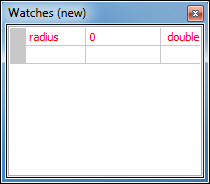
If we click on the Continue button again then execution of app will advance to next line. This will update content of the radius variable in our app. Watch window will also update its content showing current value of the radius variable as shown in the following screenshot:

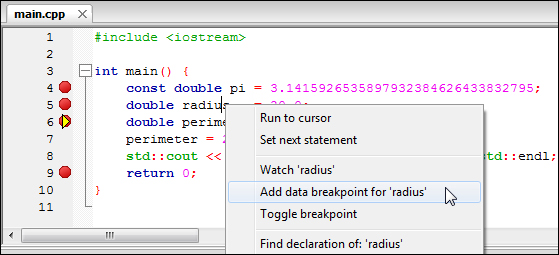
At this step we'll learn about another type of breakpoint known as data breakpoint. Right-click on the radius variable in line number 5 in editor window shown in the following screenshot and then click on the Add data breakpoint for 'radius' menu option:
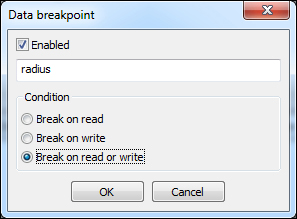
Select Break on read or write option as in the following screenshot and click on the OK button. By doing this we are instructing GDB to pause execution whenever the radius variable is read or written.
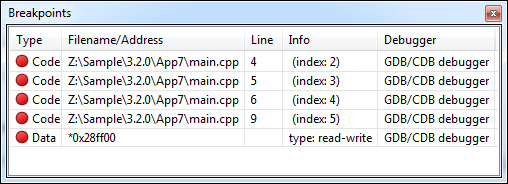
A data breakpoint will now be created. However data breakpoint is not shown visually in editor window. It can be verified from Breakpoints window by navigating to the Debug | Debugging windows | Breakpoints menu option. Last line in the following screenshot shows that a data breakpoint has been set.
Click on the Continue button in debugger toolbar or press the F8 key and execution will continue. It will now stop at line 7 due to the data breakpoint we have set in previous step. Variable radius is being read at this line and gdb has stopped execution as data breakpoint condition has been met.
Click on the Continue button to continue execution of app and subsequently it will stop at line number 9. If we continue clicking on the Continue button app, execution will stop several times due to the data breakpoint we have set earlier. This is normal and in order to stop execution immediately click on the Stop button in debugger toolbar or press Shift + F8 key to stop execution.
This completes our introduction to app debugging with Code::Blocks.