31.6 PERFORMANCE OF CTAS DURING PERIODS OF FINANCIAL STRESS
Numerous studies have examined the benefits of CTAs in terms of providing downside protection during periods of financial stress.8 Since CTAs have access to multiple markets and can easily take long or short positions in these markets, they are able to take positions that will benefit from increased uncertainty and financial distress in markets. For example, a decline in equity prices could benefit CTAs who are (1) short equity indices, (2) long short-term Treasuries which benefit from a flight to safety, (3) long USD which typically benefits from turbulence in financial markets; and (4) long implied or realized volatility derivatives.
31.6.1 Are Trend-Following CTAs Long Volatility?
Some argue that CTAs are long volatility, and since equity volatility appears to be the most dominant factor affecting volatility in other markets, CTAs are expected to benefit whenever equity market volatility spikes.9 As will be discussed further, CTAs are not long volatility in the same way that a holder of a volatility swap or a straddle would benefit from an increase in volatility. CTAs, in general, do not directly invest in derivatives that are closely linked to volatility. Therefore, if CTAs are able to produce positive returns when there is a spike in equity market volatility, it has to be the result of their trading strategies in financial and commodity futures.
It is a well-known empirical observation that sharp declines in equity prices are associated with sharp spikes in equity volatility (Black 1976; Baillie and DeGennarro 1990; Bekaert and Wu 2000). Furthermore, this relationship is asymmetric in the sense that sharp increases in stock markets are not associated with equally sharp declines in equity market volatility. A number of reasons for this relation have been discussed, including the following: (1) A stock price decline increases the debt/equity ratio of firms, leading to higher volatility on equity returns; (2) a stock price decline creates forced selling by those who have purchased stocks on margin, leading to increased volume and higher volatility; (3) an initial increase in volatility (e.g., due to an exogenous event) increases risk aversion among investors, leading to a decline in stock prices; and (4) an increase in volatility (e.g., due to an exogenous event) increases the equity risk premium, leading to lower stock prices. Whatever the reason, changes in volatility and changes in stock prices are highly negatively correlated. For example, between 1990 and 2011, the correlation between changes in the monthly volatility of the rate of return on the S&P 500 and the monthly rate of return on the same index has been about –0.35.
As stated in previous chapters, a majority of CTAs employ long-term trend-following strategies. These investment managers benefit from orderly directional trends in markets on which they focus and suffer losses in random and directionless markets. These characteristics of price behavior are not directly related to volatility levels or volatility changes.
The notion that CTAs are long volatility comes from available empirical evidence that appears to show that CTAs perform relatively well when the level of equity volatility is high and when equity volatility is increasing. Given the preceding discussion, a downtrend is likely to be associated with higher volatility, and a trend follower who is short equities would benefit. Another factor contributing to this issue is a set of academic research showing that CTA returns share similar properties with a long position in a straddle.10 In a typical straddle, the trader takes long positions in both call and put options on the same underlying asset. The trader will profit if the underlying asset of the straddle makes large moves in either direction. In addition, the sensitivity of the position (i.e., its delta) increases as the underlying asset of the straddle continues its move in the same direction.
The notion that CTAs are long volatility is not very precise. As stated by Malek and Dobrovolsky (2009), volatility exposure would mean different things to different traders employing different systematic trading strategies. Furthermore, it is not clear what is meant by “volatility exposure.” First, it could mean that CTAs provide higher returns when the level of volatility is high. Second, it could mean that CTAs provide higher returns when the level of volatility is increasing. Equally important, one needs to be precise whether conditional or unconditional volatility is being discussed. As will be shown shortly, the way volatility is measured has important implications for estimating the volatility exposures of CTAs.
To gain a better understanding of volatility exposure of CTAs, terminology from option pricing is used to analyze the behavior of a typical trend-following CTA.11 Suppose the market is directionless and a CTA has no positions. In this case, the CTA's directional market exposure (i.e., its delta) is zero. Once the market starts to move and begins a trend, the CTA starts adding to its positions. When the market moves up, the CTA increases its long position (i.e., its delta becomes positive and increases), and when the market goes down, the CTA increases its short position (i.e., its delta becomes negative and decreases). This behavior is exactly what makes the trend-following CTAs' return profiles similar to those of a long position in a straddle. However, this return profile is not the result of any exposure to volatility; rather, it is a result of being long gamma. Using option terminology, gamma measures the rate of change in the delta of an option as the price of the option's underlying asset changes. This means that the sensitivity of a position that is long gamma increases as the price of the underlying asset increases, and the delta decreases as the price of the underlying asset decreases. Therefore, trend-following strategies are characterized by being long gamma, and relative value strategies are characterized by being short gamma. As a result, even though return profiles of trend-following CTAs are similar to return profiles of straddles, it does not follow that CTAs are long volatility simply because straddles are long volatility.
Option premiums are most sensitive to volatility when the options are at-the-money. When they are deeply in-the-money, they behave similarly to long or short positions in their underlying assets; when they are deeply out-of-the-money, they become almost worthless. Thus, a straddle displays volatility exposure only when it is close to being at-the-money. As the underlying price moves away from its strike level, the straddle's sensitivity to volatility declines. This means that a trend-following CTA that is trying to take advantage of a trend behaves like a deeply in-the-money straddle and, as a result, can be characterized as being long gamma.
31.6.2 Empirical Evidence on the Volatility Exposure of CTAs
This section presents some empirical evidence on the exposure of CTAs to the level of volatility as well as changes in volatility. In addition, CTA behavior is examined during periods of financial stress, as represented by extreme changes in credit spreads and government bond prices. Since CTAs, and particularly trend-following CTAs, do not invest in instruments that provide direct exposure to volatility, they can provide downside protection if, on average, they have short positions in equity markets when there are sharp declines in stock markets. During periods of financial stress (drops in equity prices or increases in credit spreads), there is typically a flight to safety, leading to higher prices for short-term and medium-term government bonds and higher prices for safer currencies (e.g., the U.S. dollar). Therefore, it could be argued that CTAs have on average long positions in government bonds and safe currencies during periods of financial stress.
Exhibits 31.7A through 31.7C display the performance of CTAs, including systematic and discretionary CTAs, during periods of sharp declines and increases in equity prices (Exhibit 31.7A), high-yield bond prices (Exhibit 31.7B), and hedge fund net asset values (NAVs) (Exhibit 31.7C). For instance, Exhibit 31.7A shows that between 1990 and 2011 during the worst 24 months for MSCI World Index, the index declined by 8.78% per month while all three CTA indices showed positive average return during the same 24 months, with systematic CTAs performing the best. Interestingly, during the best 24 months for the MSCI World Index, all three CTA indices were essentially flat. Exhibit 31.7C shows that CTAs could also offset the downside risk of hedge funds. During the worst 24 months for the HFRI Fund Weighted Composite Index, the index declined by 3.12% per month, while all three CTA indices were profitable, with the systematic CTA index displaying the best performance.
EXHIBIT 31.7A Performance of CTAs during Worst and Best Months for Equities
Source: Authors' calculations and Bloomberg.
| Average Monthly Return | ||
| 1990–2011 | 24 Worst Months of MSCI World | 24 Best Months of MSCI World |
| MSCI World Index U.S. Currency TR | −8.78% | 8.05% |
| HFRI Fund of Funds Composite Index | −1.35% | 1.47% |
| HFRI Fund Weighted Composite Index | −2.37% | 2.82% |
| Barclay Trader Index CTA | 1.90% | 0.02% |
| Barclay Trader Index Discretionary | 1.02% | 0.56% |
| Barclay Trader Index Systematic | 2.54% | 0.02% |
| Barclays Capital U.S. Corporate High Yield | −3.49% | 2.78% |
| VIX end-of-month | 33.77% | 24.30% |
EXHIBIT 31.7B Performance of CTAs during Worst and Best Months for High-Yield Bonds
Source: Authors' calculations and Bloomberg.
| Average Monthly Return | ||
| 1990–2011 | 24 Worst Months of High-Yield Bonds | 24 Best Months of High-Yield Bonds |
| Barclays Capital U.S. Corporate High Yield | −4.96% | 5.41% |
| MSCI World Index U.S. Currency TR | −6.70% | 4.08% |
| HFRI Fund of Funds Composite Index | −1.58% | 0.92% |
| HFRI Fund Weighted Composite Index | −2.60% | 2.39% |
| Barclay Trader Index CTA | 1.74% | −0.37% |
| Barclay Trader Index Discretionary | 0.95% | 0.33% |
| Barclay Trader Index Systematic | 2.23% | −0.54% |
| VIX end-of-month | 31.83% | 25.41% |
EXHIBIT 31.7C Performance of CTAs during Worst and Best Months for Hedge Funds
Source: Authors' calculations and Bloomberg.
| Average Monthly Return | ||
| 1990–2011 | 24 Worst Months of Hedge Funds | 24 Best Months of Hedge Funds |
| HFRI Fund Weighted Composite Index | −3.12% | 4.20% |
| HFRI Fund of Funds Composite Index | −2.16% | 2.97% |
| Barclays Capital U.S. Corporate High Yield | −3.90% | 3.07% |
| MSCI World Index U.S. Currency TR | −6.84% | 4.82% |
| Barclay Trader Index CTA | 1.25% | 1.67% |
| Barclay Trader Index Discretionary | 0.64% | 0.81% |
| Barclay Trader Index Systematic | 1.65% | 2.09% |
| VIX end-of-month | 31.08% | 21.20% |
CTAs, particularly trend-following CTAs, tend to perform well during periods of financial stress and therefore have the potential to provide downside protection to portfolios consisting of traditional assets as well as certain hedge fund strategies. Exhibit 31.8A shows that most CTA strategies have historically provided their highest returns during months in which the S&P 500's volatility is reportedly very low. In addition, the next best performance is generally observed during months in which the S&P 500's volatility is reportedly very high. Exhibit 31.8B examines the sensitivity of various CTA strategies to changes in the level of volatility. In most cases, the best performance is not observed when the S&P 500's volatility shows the largest increase. However, when the index's volatility experiences the smallest changes, CTAs tend not to perform as well as they do in response to larger changes in the index's volatility. The results presented in these two tables seem to support the conceptual discussion presented in the previous section that CTAs are not long volatility but behave as if they are long gamma.
EXHIBIT 31.8A Sensitivity of CTAs to the Volatility Levels of the S&P 500 Index
EXHIBIT 31.8B Sensitivity of CTAs to Changes in the Volatility Levels of the S&P 500 Index
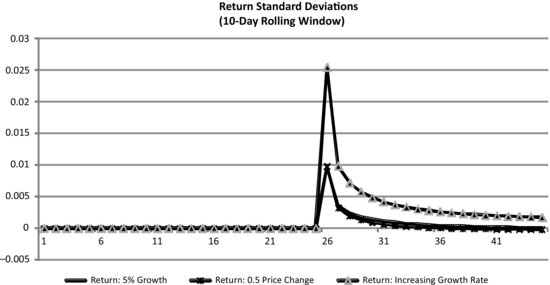
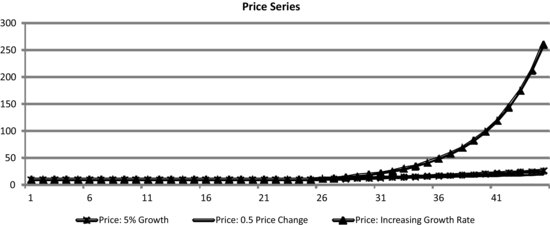
Exhibit 31.9 shows three different price behaviors for a hypothetical asset. In all cases, the price starts at 10 and remains constant for the first 25 observations. Next, the price follows three different trends. In one case, the price increases by the same percentage (5%) during each period; in another case, the price increases by the same amount (0.5) during each period; and in the final case, the price increases at a predictably increasing rate during each period. Thus, in all three cases, the trends are predictable and therefore conditioned on the trend; the true (i.e., conditional) return volatilities are zero, and there is no uncertainty about the future price if one can observe the current price and identify the trend. For example, given the observed value of price in, say, period 30, one can perfectly predict the price in period 31, provided that one is able to identify the trend.
In Exhibit 31.10, the unconditional volatilities of the rates of return on these three price series are calculated and displayed. These volatilities are estimated using a 10-day rolling window. That is, the volatility in day 30 is calculated using data from day 20 through day 30. These are the same estimated volatilities that will be reported by an observer who uses the return series to calculate the volatility. It can be seen that once the price breaks out and follows a predictable pattern, the estimated value of the unconditional volatility will increase. Therefore, if the observer is not aware that the price has broken out and a new trend has emerged, the estimated volatility will be significantly different from the true volatility of prices (in this case, the true volatility is zero). This means that at least a portion of the reported exposures of CTAs to changes in volatility is due to the fact that reported volatilities do not take the emerging trends into account. Therefore, because price breakouts and emergence of new trends are associated with increases in estimated volatilities as well as increases in the profitability of CTAs, it may appear that CTAs are long volatility.