Chapter 21
Cloud Monitoring and Remediation
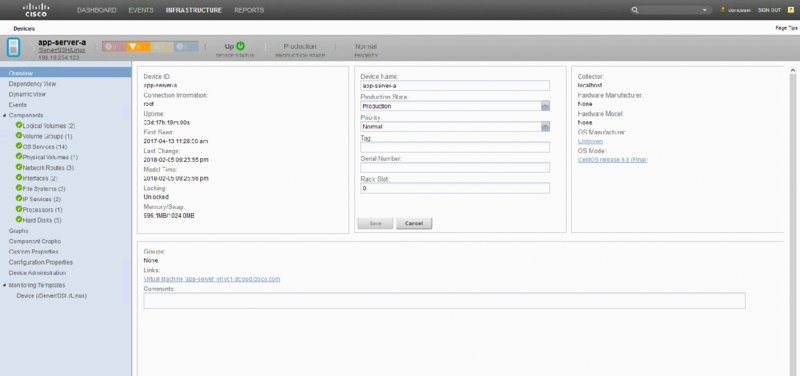
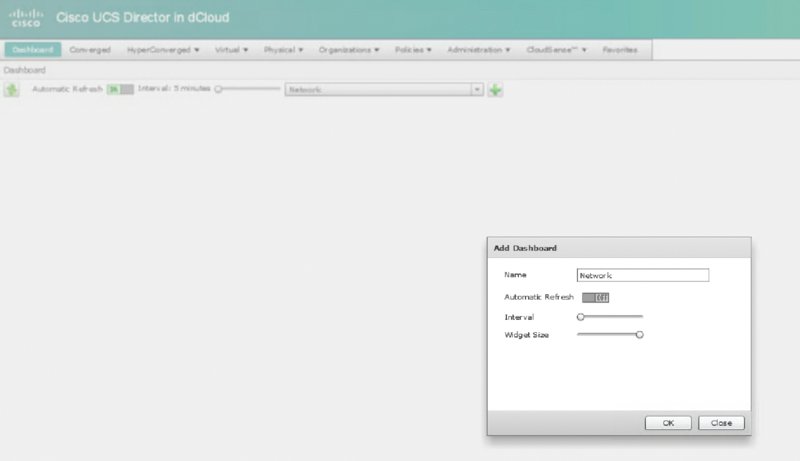
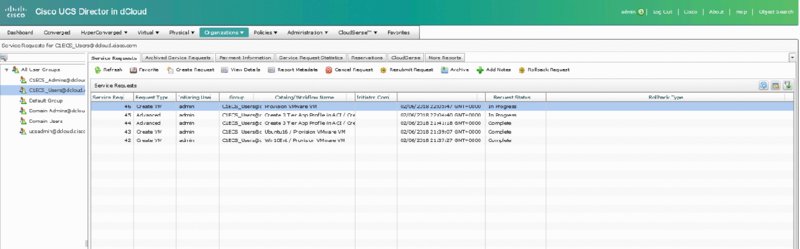
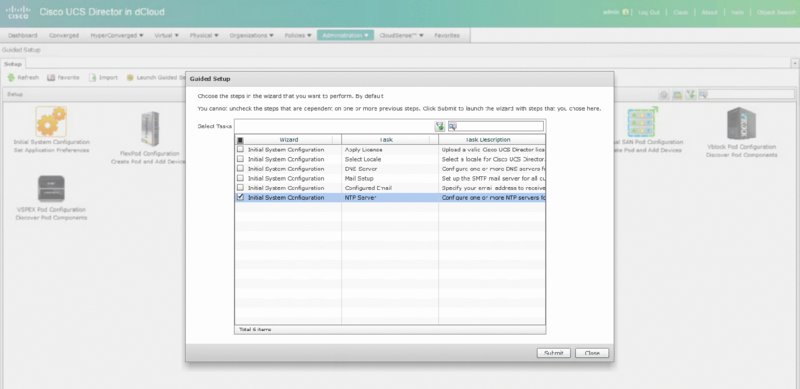
THE FOLLOWING UNDERSTANDING CISCO CLOUD ADMINISTRATION CLDADM (210-455) EXAM OBJECTIVES ARE COVERED IN THIS CHAPTER: ✓ 4.5 Perform cloud monitoring using Cisco Prime Service Catalog, Cisco UCS Director, Cisco Prime infrastructure ✓ 4.6 Create monitoring Dashboards ✓ 5.1 Configure serviceability options ✓5.2 Interpret Logs for root cause analysis ✓ 5.3 Configure backups This final chapter will focus on monitoring and logging for your cloud operations. The Cisco ONE Enterprise Cloud Suite comes with several products for this, as well as some stand-alone applications outside of the suite. Some of these were already discussed in previous chapters in relation to their automation and deployment capabilities. This chapter will also cover serviceability options as well as logging and backups as they pertain to the exam. UCS Performance Manager is meant to be a centralized performance tool for multiple teams. It is designed to give the network, system, storage, and operation teams a common place to get reporting and statistics on the Unified Computing System environment. Chapter 20 covered UCS Performance Manager briefly; you learned about its initial requirements and how it’s ordered. In this section, you’ll learn about some of the monitoring tools UCS Performance Manager gives you. On the main login screen, click Topology to the right of the Dashboard. This will give you a quick snapshot of all the UCS domains that UCS Performance Manager is connected to. You’ll see a few gauges on the side such as Overall Ethernet Bandwidth Utilization and Connected Bandwidth Utilization, as shown in Figure 21.1. Notice the map of the infrastructure that can be zoomed in and out. This map is also clickable and allows you to drill down to device statistics, events, and faults. Figure 21.2 shows an example of double-clicking Chassis 3 in the map. Figure 21.1 Cisco UCS Performance Manager: Topology screen Figure 21.2 Cisco UCS Performance Manager: drilling down Not only can you monitor the immediate usage of a server from the pop-up window, but you can drill down into events and look at faults and issues. Now let’s look at monitoring the infrastructure as a whole. Click Infrastructure on the top menu bar to get to the screen shown in Figure 21.3. Figure 21.3 Cisco UCS Performance Manager: Infrastructure screen Looking at the main infrastructure view in Figure 21.3, you’ll see the left pane has selections for Network, Storage, vSphere, and more. Clicking any object in this area allows you to drill further down. Clicking Server and then choosing an app server brings you to Figure 21.4. Figure 21.4 Cisco UCS Performance Manager: server drill-down Notice all of the views and items you can click. UCS Performance Manager gives you an array of options to monitor and track individual components down to the routes on the server, bandwidth usage, CPU usage, and more. Click Graphs to see the screen in Figure 21.5, which shows only one server at a time. UCS Performance Manager has statistics and options for all of your infrastructure, network, storage, and compute systems. Figure 21.5 Cisco UCS Performance Manager: server graphs UCS Performance Manager also offers extensive reporting options. If you click Reports in the top menu of Performance Manager, you’ll see a list on the left of the screen for different categories of reports. There are many predefined reports that can be selected and exported to file formats such as CSV and PDF. Keep in mind that your reports may vary depending on whether you have the full version of Performance Manager or the Express version. The top menu items are as follows: In this section, you’ll learn about UCS Manager and UCS Central in respect to their monitoring and capacity capabilities as they pertain to the exam blueprint. You’ll see the infrastructure such as Ethernet, physical, and virtual hosts. UCS Manager acts as a server-domain controller and provides a virtual chassis that encompasses all of the UCS devices it manages. UCS Manager runs as an application on the fabric interconnect of the UCS deployment. One UCS Manager instance can scale up to 20 UCS chassis at the time of this writing. Figure 21.6 shows the screen you’re presented with when you first open UCS Manager. Figure 21.6 Cisco UCS Manager Depending on the version you have installed, your start screen may differ slightly. As you can see from Figure 21.6, you can start at the Main Topology View tab, which shows an overview of the servers and network fabric. From this screen, you can navigate to several areas to monitor and administrate your hosts and network ports. UCS Manager has several screens where you can capture this information. Clicking Fabric Interconnects in the upper menu and expanding the options brings you to the screen shown in Figure 21.7. Figure 21.7 Cisco UCS Manager: Fabric Interconnects tab The information presented here can tell you the role of the port, its admin state, and its overall status. Further, you can double-click any of these ports to be presented with more information about the individual network port. As an example, double-clicking Port 1 shows the screen in Figure 21.8. Figure 21.8 Cisco UCS Manager: port properties pop-up In the individual network port pop-up window, you can see a number of points to gather information and even perform some actions. The lower-left corner features actions that let you enable, disable, reconfigure, unconfigure, and show interface stats. In the upper-right corner you can click Statistics and get a breakdown of received and transmitted bytes as well as packets, jumbo frames, multicast packets, and broadcast packets. You can also click Servers in the top menu to see the servers under management. Stats shown here include CPU cores, memory, and overall status. You can see an example of this in Figure 21.9. Figure 21.9 Cisco UCS Manager: Servers tab Double-clicking any of the available servers takes you further inward to monitor and view the performance of the server as well as administer common operational tasks. You can see faults, events, virtual server stats, and much more. This is one of the many places where you can monitor real-time performance and basic statistics of your inventory. An important note here about monitoring is the realization that these are all environmental statistics and performance statistics. They aren’t usage stats for billing customers or end users. UCS Manager provides real-time environmental and performance stats of your infrastructure. Figure 21.10 shows an example of a server that was clicked to review even more details. Figure 21.10 Cisco UCS Manager: individual server As with the screen shown earlier in Figure 21.8, you can drill down to individual adapters and NICs of the server and gather statistics on packet rate, bandwidth, errors, and more. Figures 21.11 and 21.12 show selecting Adapters and then the pop-up screen you’d receive if you double-click Adapter 1. Figure 21.11 Cisco UCS Manager: Adapters tab Figure 21.12 Cisco UCS Manager: adapter 1 properties As you can see in Figure 21.12, you can still go further and look at individual NICs, HBAs, iSCSI vNICs, faults, events, DCE interfaces, and general stats. Click the NIC section to see another pop-up that shows you general Ethernet stats as well as the chart section that can plot the performance. Again, as mentioned, this isn’t meant as a long-term performance trending tool. UCS Performance Manager has much better options for trend statistics. You can see an example of the NIC pop-up in Figure 21.13. Figure 21.13 Cisco UCS Manager: NICs UCS Central is another tool for monitoring the infrastructure, especially on a global scale. As mentioned, UCS Manager scales to only 20 UCS chassis. UCS Central does not replace UCS Manager, which is a tool for a single UCS domain. Instead, it is geared toward grouping together multiple UCS domains to view and manage through a single pane of glass. UCS Central is a virtual appliance that scales to 10,000 total endpoints. The interface is similar to UCS Manager and provides some of the same statistics and reporting on bandwidth, but at the UCS domain level, to see what the top talker might be in the domain. This is the large benefit of UCS Central that UCS Manager cannot fulfill. UCS Central allows a centralized inventory and health status for all your UCS components across the entire infrastructure, globally. UCS Director also has extensive reporting capabilities and capacity management. CloudSense reporting is one of the more customizable and powerful reporting tools within UCS Director. CloudSense reports allow data to be used from several areas and reports it in a consolidated view. CloudSense reports can also give reports on real-time capacity and trending. As of UCS Director 6.5, the following reports are available from CloudSense: To get started with CloudSense analytics reports, do the following in the GUI: There are many reports you can run, all customizable and with a large historical data set. Figure 21.14 shows an example of the VMware Host Node Performance report. Figure 21.14 Cisco UCS Director: CloudSense report You can also run an assessment under CloudSense. Assessments are all about the current health of the virtual infrastructure running VMware with vCenter. An assessment is easy to run because it is only for the virtual infrastructure. Running this report will show you faults and hardware compatibility information. Do the following: The report is then generated in HTML or PDF format. You can see an example in Figure 21.15. In this case, there are a few minor faults, and it even lets you know that the underlying hardware you’re using isn’t technically compatible. Figure 21.15 Cisco UCS Director: CloudSense assessments The last feature of CloudSense to mention is Report Builder. This is the area where you can build your own custom reports and also where the biggest benefit is gained for trending analysis and capacity. You can set up these reports as templates to build others as well, cloning them and using them later. You can access the Report Builder by following these steps in the UCS Director GUI: The UCS Director Dashboard is a powerful feature for displaying quick information about your environment. You can enable the Dashboard by clicking your profile or username at the top of the screen and enabling the Dashboard on the Dashboard tab. After it’s enabled, there are a few things displayed for you by default, but you can customize it to give you the information that’s useful to you. You can even set up multiple Dashboards for monitoring and switch between them on the Dashboard tab. The UCS Director Dashboards consist of groups of widgets that can display data about the physical and virtual infrastructure. The Dashboard also has the ability to export its widgets in PDF, CSV, or XLS format. You can resize the widgets on the screen with the upper-right sidebar and can even maximize the widgets to full-screen for a better look. You can see an example of this with the default Dashboard in Figure 21.16. Notice that each widget has a down-facing arrow at the top. Click this arrow to access the Expand View or Export Report submenu. In the upper-right corner, you can increase or decrease all the widget sizes at once. The real benefit starts when you create your own Dashboards and switch between them. Hundreds of widgets are found all over UCS Director in the summary sections as you click through the infrastructure. As an example, let’s create a network Dashboard for monitoring. Referring back to Figure 21.16, click the green plus sign next to the word Default. This allows you to name a new Dashboard. You can even set autorefresh and its interval and widget size. Look at Figure 21.17 for the pop-up you’ll receive when you add a new Dashboard. Figure 21.16 Cisco UCS Director: default Dashboard Figure 21.17 Cisco UCS Director: new Dashboard Now you need to add some things to the Dashboard so it’s not blank. Simply navigating to any major area will land you on the summary screen with widgets for that section. For this example, select Virtual ➢ Network. Depending on what you have running in the virtual network, you’ll see a summary of a few widgets. Pick the ones you want by clicking in the upper-right corner of each widget. This will reveal the ability to add to your Dashboard, as shown in Figure 21.18. Figure 21.18 Cisco UCS Director: adding to the Dashboard As you can see, you can create many Dashboards for an organization and its end users to monitor infrastructure quickly. The Dashboard feature is a powerful feature for monitoring within UCS Director. In this section, you’ll take a brief look at service request monitoring. You’ll also look at logs to view in UCS Director and Prime Service Catalog and how to back up the platform databases for recovery efforts. Service request monitoring in UCS Director is beneficial to all users. As the cloud administrator or end user, you’ll want to have a grasp of how service requests have completed or failed. You can see the status of service requests by navigating to Organizations ➢ Service Requests in the UCS Director GUI. From this location, you’ll be able to see all the requests that aren’t archived. The requests can be in one of four states: Figure 21.19 shows an example of the service request screen. Figure 21.19 Cisco UCS Director: service request monitoring As you can see in Figure 21.19, some are in progress, and some have completed. Those that have completed can be moved to the Archived tab by simply clicking Archive in the toolbar. Double-click one of the in-progress runs, and you can begin to see how far you can follow and monitor service requests, as shown in Figure 21.20. Figure 21.20 Cisco UCS Director: service request in progress You can see in Figure 21.20 that you’re still in the middle of provisioning and have a few steps left. The monitoring here is extremely beneficial to end users and administrators to follow along with their service requests, especially when one fails. Notice that there is a Log tab as well. The log is very long, but an example of it is in Figure 21.21. The log will give you detailed line items of exactly what is happening and what steps are being taken. Figure 21.21 Cisco UCS Director: service request logs There is also a Service Request Statistics tab; you can see it by looking at Figure 21.22. The tab is right next to Payment Information. This tab is a good place to get a quick summary of what’s going on and the past service requests. It groups together the workflows so you can see an aggregate of how many failed requests or succeeded, invoiced, and cancelled requests there are. In this case, there are a few in progress. Figure 21.22 Cisco UCS Director: service request statistics Next you’ll look at some of the logs that are offered by UCS Director and Prime Service Catalog. You may use these logs for troubleshooting certain system problems, failures, or even debugging scenarios. The likelihood of you using the debugging sections is rare unless they’re needed for advanced troubleshooting with Cisco TAC Support. In the UCS Director portal, you can navigate to Administration ➢ Support Information, as shown in Figure 21.23. You can then click the Support Information drop-down, as shown in Figure 21.24. Figure 21.23 Cisco UCS Director: Support Information menu item Figure 21.24 Cisco UCS Director: Support Information drop-down From the drop-down options you can see that you can look at system information, view logs, and even download the logs. The log will give you info on the system uptime, processes running, licensing, network information, and more. Figure 21.25 shows a small snapshot of the basic log. Figure 21.25 Cisco UCS Director: system information log The Show Log menu item is where you’ll find all the logs you can look at. It isn’t obvious by looking at it, but when you click it, you’ll see a new drop-down list of several options, as shown in Figure 21.26. Figure 21.26 Cisco UCS Director: Show Log menu item The following are the logs for downloading and viewing, as shown in Figure 21.26 : You can also view the Infra Manager logs from the shell console. This is the place where you can still perform system functions in case the portal has issues. You can do many things from the shell console of UCS Director. You’ll have to SSH to the UCS Director server with the appropriate credentials, and you can see the list of commands available in Figure 21.17. Notice option 18 has the ability to tail the Infra Manager logs, which are exactly the logs you’d want to see if there were major system problems. Figure 21.28 shows an example of this. Figure 21.27 Cisco UCS Director: shell console Figure 21.28 Cisco UCS Director: shell console, Infra Manager logs When you log in to the Prime Service Catalog portal, you can navigate to the Utilities section to find the log section. If your landing page is the portal, you’ll have to click the upper-right corner menu item and select Advanced Configuration ➢ Administration. You can see this in Figure 21.29. Figure 21.29 Cisco Prime Service Catalog: administration There are only a few logs available via the GUI, but there are several tools, as shown in Figure 21.30. The tools on the tabs are beyond the scope of the exam, but you can see that this is where you’d come to look at basic logs and use tools for troubleshooting. Remember that Prime Service Catalog is an orchestrator and not doing the heavy lifting that UCS Director is doing, which explains the lesser log count. Figure 21.30 Cisco Prime Service Catalog: Utilities tab Like UCS Director, Prime Service Catalog also has a shell that can be accessed to view logs and run administrative tasks in case of an issue with the portal. Four types of logs can be accessed from the shell. Figures 21.31 and 21.32 show the menu and logs via the shell. Figure 21.31 Cisco Prime Service Catalog: shell Figure 21.32 Cisco Prime Service Catalog: shell logs The three logs you see are as follows: There will be a point where you want to save the database of UCS Director and Prime Service Catalog for backup purposes. This is needed in case of system failure but could also be used to get back to a known good state. Having a copy of the database backup is a good strategy as long as it’s stored somewhere safe. You’ll need an FTP account for both cases to save the database to. You’ll also have to stop all services before you’re allowed to back up the database. All of this is done via the command line. You can’t do this via the portal because the database has to actually stop in order for you to copy it. Figure 21.33 shows an example of running this via the UCS Director command line. Figure 21.33 Cisco UCS Director: database backup You can see option 7 was used, and FTP information was entered. You’ll need to use your own FTP credentials. The services are stopped automatically, and a backup of the database was performed. After the backup was taken, it was uploaded to the FTP server. Option 8 allows you to restore the database from backup, in the same fashion. You would enter the FTP information and pull the backup down from off-site. Then the restore process can begin. Prime Service Catalog, like UCS Director, also backs up its database via the shell command line. You can refer to Figure 21.31. Choosing option 5 would give you the option to back up and restore the Prime Service Catalog database and the orchestration database. The same details apply when using FTP to back up or restore the databases. An interesting side note is that both appliances are UNIX based, so tools are available to automate and run this backup without using the shell menu. You would need to log in with the root or appropriate account to bypass the shell menu and access the real UNIX command line. There are Cisco guides online for how to do this. Performing it via the real shell is beyond the scope of the exam, but knowing it’s a possibility to further automate backups is not. This section covers the cloud serviceability options. Serviceability refers to the installing, monitoring, maintenance, and configuration of computer products in the broadest terms. It also relates to the ability to identify faults and isolate the root cause of issues. The term serviceability is a bit old and refers to on-premise gear and how it is maintained and monitored. The move to the cloud opened up automation and ease of use, but you still need a collection of tools to maintain, monitor, and troubleshoot issues. The serviceability aspects of cloud can cover many tools, applications, and protocols. Here you’ll look at the few that are covered for the exam that you should know. Syslog is a standard for message logging and defined in RFC 5424. If you have configured any network or system device, you more than likely have run across syslog and configured it. Syslog consists of messages logged to detail the health and status of a particular device along with the timestamp of when it was logged. Some of these messages can be simply informational, and some might require more urgent care on their receipt. Syslog on most systems defaults to storing locally and is usually something that can be turned on and off. Depending on how syslog is set up, the local log file can be difficult to sort through. It can be quite large depending on what is being logged. One of the ways to combat this issue is to log certain levels locally. Syslog uses a severity field to indicate the severity of the message. This also means that different messages are assigned to a different severity level. Let’s look at the levels here: There are also facility messages used in syslog. They are numbered from 0 to 23 and map to a value that is supposed to identify the source and category of a message. They are not used the same way from vendor to vendor and are not covered in detail beyond their definition on the exam. It’s up to vendors to assign their messages to severity levels. In your local syslog setup, you may set any of these levels and adjust as needed. If you, for example, set level 5, your local syslog would have all messages from 0 to 5. Syslog treats the logging in this way because 0 is considered the most important, followed by 1, 2, and so on. The benefit here is that you’ll always receive the messages that the system considers emergencies. While not always the case, the higher levels generally can receive more messages as they’re for informational and debugging reasons. For this fact, you’d set your local syslog accordingly. During times of debugging and troubleshooting, you might adjust the level all the way to 7, which would allow any message to be saved to the local syslog. While local syslog is easy to set up, it may not be reliable in outage scenarios and may even clear in some scenarios like rebooting your device. A more practical approach is using local logging and remote logging at the same time. Syslog has the built-in ability to send timestamped messages to a central log server capable of receiving them. By default, most implementations will use UDP port 514 to accomplish this. TLS over TCP port 6514 is supported in newer servers and equipment as well. There are several benefits to setting up a remote log server, one of them being access in times of an outage. The remote log server will likely have syslog messages right up to the time of the incident. The remote log server will also be reachable and available during such incidents, allowing you to ascertain what went wrong on a device by viewing logs. The ability to sort and look through archived logs on the remote syslog server is also a major benefit. The local device may not have the storage capabilities that a dedicated remote log server might have. This would allow teams to store a large history of events and problems, often useful to correlate new problems to previous events. UCS Director supports sending syslog messages to a remote server. You can find the configuration for this under Administration ➢ Integration on the main portal. You’ll have to click the Syslog tab and then select the Enable Syslog Forward box. You’ll then be able to configure two syslog servers. Figure 21.34 shows where this is configured in UCS Director. Figure 21.34 Cisco UCS Director syslog The previous section discussed syslog and its ability to log information locally or remotely with timestamped messages. But how does a logging device ensure its time is accurate? This is one of the many use cases for Network Time Protocol (NTP), a protocol within the IP stack. NTP uses UDP port number 123 in both directions and operates traditionally in a client-server model. It can also operate in a peer-to-peer relationship where both servers sync with each other. In NTP, synchronization usually refers to the client-server model, and peering refers to the mutual synchronization of devices or server to server. NTP operates in a hierarchical layered model of time sources. Each layer or level is referred to as a stratum. This allows for an organization to scale clock synchronization across a range of devices. The stratum levels are 0 through 15, with 16 being reserved for an unsynchronized clock. Synchronization allows higher stratum level servers to synchronize to lower ones. For example, stratum 3 servers would synchronize with stratum 2 servers. Stratum 2 would synchronize with stratum 1. The lower the stratum, the more accurate the clock is. Devices on the same stratum level are allowed to mutually peer with each other, but this is not allowed between stratum levels. Peering is allowed between servers at the same stratum level for accuracy and are backed up in case a device loses its downstream synchronization to the next stratum level. A brief explanation of stratum levels follows: UCS Director can be configured to synchronize to an NTP server either from the command line or from the Guided Setup Wizard within the GUI. In the portal, you select Administration ➢ Guided Setup and then click Launch Guided Setup. You can see this in Figure 21.35. You’ll then have to check the box for initial system configuration and click Submit. This is shown in Figure 21.36. Figure 21.35 Cisco UCS Director: guided setup Figure 21.36 Cisco UCS Director: initial config After hitting Submit, you’ll be presented with a window of guided setup options to choose from. Here, you can uncheck everything but NTP and click Submit. You can see this in Figure 21.37. Figure 21.37 Cisco UCS Director: guided setup for NTP Finally, you’ll be presented with an overview that you can read and click Next. Then, you’ll be able to add multiple NTP servers. If one is already defined, you’ll have to click Modify NTP Servers. You can see this in Figure 21.38. Figure 21.38 Cisco UCS Director: NTP setup The Domain Name System (DNS) is a protocol within the IP suite of applications just like NTP is. DNS allows normal domain names to resolve to IP addresses. In most cases, networks route traffic to destinations based on what the IP address is. This number can vary and would be hard for individuals to remember. In fact, the Internet would be much harder to navigate if everyone had to remember and bookmark numbers for popular websites. This is where DNS makes life easier. DNS runs on UDP or TCP port 53 and is something most networks will have configured either manually or via DHCP-given settings. When you enter a domain name like google.com in your web browser, your browser asks a DNS server to translate that name into an IP address. This is the server that you have manually configured, or it would have been automatically configured for you via DHCP. The DNS server will respond with the real IP address of the name, and then your computer will communicate with that server via the IP address. This is a simple example meant to illustrate the concept for the exam, as there are obviously more details involved than this for full communication. Another benefit of DNS is when moving servers. IP addresses can change, and servers can be retired or relocated to other areas. The DNS name doesn’t have to change, just what IP address it points to. This is by far the biggest benefit of DNS as it offers a front door that can stay constant. By simply updating what IP address it points to, the DNS name now points to a different server. The same can be said for load-balanced services. Like NTP, UCS Director can utilize DNS. The big benefit is the same as the one mentioned. Using DNS allows you to add hostnames instead of IP addresses to services, servers, and more. This allows the IP address to change as well, but the service or server is still bound to the hostname that resolves to the new IP address. The configuration for DNS is located in the same area that NTP was located, the guided setup. DNS can also be configured via the command line or the portal GUI. In the portal, you navigate to Administration ➢ Guided Setup and then click Launch Guided Setup. You’ll check initial system configuration just like you did for NTP and submit. This time you’ll uncheck everything and leave DNS checked, as shown in Figure 21.39. Figure 21.39 Cisco UCS Director: DNS guided setup After clicking Submit and moving on, you can change or add the DNS servers of your choice. You’ll have to select Modify if you need to change already added servers. Here you’ll have to enter the IP address of the DNS servers. This is shown in Figure 21.40. Figure 21.40 Cisco UCS Director: DNS setup Dynamic Host Configuration Protocol (DHCP) is another networking protocol just like NTP and DNS. DHCP runs over UDP and uses ports 67 and 68 for communications. The DHCP server listens on port 67, while DHCP clients use a source port of 68 for communication. DHCP clients broadcast to servers asking for network configuration information that the DHCP server responds with. One of the most well-known examples is simple IP address assignment. If you have a wireless network at your home, your router is likely running a simple DHCP service to provide IP addresses to clients as they join the network. You can manually assign IP addresses to devices, but that doesn’t scale and becomes cumbersome when all that a device needs is basic connectivity. There are other things DHCP can do, such as carry information for PXE and for where to find servers to boot from. This was discussed in Chapter 20 regarding the UCS Director Bare Metal Agent. This is also where the easiest example is seen for DHCP use in UCS Director: PXE builds via the UCS Director Bare Metal Agent. For the exam you’ll need to understand the basic request and offer messages between the client and server, so let’s walk through those: You might be wondering why the client responds to the offer with a request. Not only does the client respond, it broadcasts the response. This is to serve a few purposes. The first is an acknowledgment that it received the offer and wants to formally request what it was offered. The second is the possibility of more than one DHCP server on the same subnet, which means the client may have received multiple offers. The client picks the fastest response to the discover request packet and sends an offer back as a broadcast to let all other servers hear it. This makes sure other DHCP servers are aware when the client didn’t pick their offered IP address so they can be returned to the pool. As stated previously, the main use case of DHCP for the exam is the UCS Bare Metal Agent and its ability to PXE boot virtual and physical machines. DHCP has many options it can pass in the DHCP offer message. These are the special ones relevant to the exam that make PXE work: Combine these options with the standard IP, subnet mask, and gateway, and a server has enough information to start communicating and boot up via PXE. UCS Director can do this for both virtual and physical workloads. Anyone using the Internet knows what e-mail is. E-mail is driven by the Simple Mail Transfer Protocol (SMTP) to send messages. There are other protocols for receiving messages such as POP and IMAP, but they are unrelated to the exam. SMTP historically has used TCP port 25 to communicate, but that is often now reserved only for mail servers. Most ISPs and mail servers will ask you to connect to their mail server or other mail servers on TCP port 587 or 465. UCS Director can use e-mail to send alerts and management messages to end users. The alerting aspects can be of use when monitors detect something is wrong or some services that were ordered fail. There are also approval notifications and updates to orders that end users can receive as orders are built. E-mail is a big part of self-service delivery with UCS Director and something you’ll have configured. SMTP can be configured in the initial configuration wizard. You can click Submit and go through the setup options. You can also configure SMTP in a separate location by selecting Administration ➢ System and clicking the Mail Setup tab. You can see this in Figure 21.41. Figure 21.41 Cisco UCS Director: mail setup Fill out the fields with your appropriate information. Your e-mail server likely requires a username and password to send e-mail, but some may not. When all the fields are filled out, you can send a test e-mail by selecting the box. When you do, a new box appears to create an e-mail to test with. Assuming you receive the e-mail at your account, you’re good to go for UCS Director sending monitoring information and alerts. This chapter covered information related to monitoring and logging in the Cisco cloud experience. The chapter discussed UCS Performance Manager and what its use cases are; it’s a shared tool meant to be used for performance monitoring among multiple teams. The chapter then discussed UCS Central and UCS Manager. You looked at their differences and how UCS Central is meant for larger-scale deployment. You learned about the logging and performance monitoring capabilities available in both tools. The chapter also reviewed the UCS Director Dashboard and widgets as well as its logging options for monitoring performance and issues. The chapter also covered Prime Service Catalog and its logging abilities for troubleshooting and monitoring. Finally, the chapter covered the serviceability protocols and how they help with monitoring, alerting, and overall operations. NTP was discussed with its time synchronization capabilities. DHCP was covered with regard to using it with PXE and the Bare Metal Agent. SMTP was shown and discussed in its relation to sending alert and notification e-mails. Syslog was also covered with its ability to log alerts and notifications both locally and remote. Know UCS Performance Manager. Know what UCS Performance Manager is. Understand it’s a shared tool and meant to be used by multiple teams. It’s an aggregation point for statistics and monitoring of the entire UCS environment. It can monitor network, storage, and compute resources. There are two versions, with the smaller Express version only doing compute. Understand UCS Central and UCS Manager. Know what UCS Manager can do for operations and monitoring. Have an understanding of the statistics that can be collected. UCS Central is a larger tool that isn’t meant to replace UCS Manager but can complement it in very large domains. UCS Central scales higher than UCS Manager and offers some of the same statistics and reporting but at the entire domain level, where UCS Manager only offers a smaller view into its managed install base. Know UCS Director monitoring, backup, and Dashboards. Know what CloudSense reports can offer as well as assessments. Understand what Dashboards can do and how they’re customizable for end users to view. Know where to locate logs and know how to back up and recover the database. Understand what a shell is used for. Know Prime Service Catalog logs and backup. Know where to locate the logs in the GUI and in the shell. Understand how backups are performed via the shell and how the restore process is done. Understand serviceability protocols. Know the protocols discussed and where they fit into the tools used for cloud management and monitoring. The following questions are designed to test your understanding of this chapter’s material. You can find the answers to the questions in Appendix B. For more information on how to obtain additional questions, please see this book’s Introduction. The PXE Bare Metal Agent uses the __________ protocol to assign a client an IP address and help it boot. UCS Director __________ is a custom page that can be used for multiple teams and users to monitor their environment. __________ __________ is a management application that works locally with up to 20 chassis. __________ is a protocol used to synchronize time between devices. Backing up the UCS Director database requires logging in to the __________. UCS __________ __________ is a tool meant to be shared by teams to monitor performance. Translating names to IP addresses is handled by the __________ protocol. The __________ log contains log information on updates in UCS Director. __________ __________ is a management application to administer multiple UCS domains outside of the local environment. The __________ protocol is used for mail delivery. The following questions are designed to test your understanding of this chapter’s material. You can find the answers to the questions in Appendix A. For more information on how to obtain additional questions, please see this book’s Introduction. What protocol deals with logging? What area of the UCS Director allows for widgets? UCS Manager can manage which of the following? The shell is required to do what operation in UCS Director? A stratum 2 server can peer with what server in NTP? Which of the following in UCS Director makes use of PXE for installing virtual machines? Which options in DHCP are used for PXE? (Choose all that apply.) Which log in UCS Director can also be viewed via the shell in addition to the GUI for troubleshooting system issues? Which are valid states found in service request monitoring for a particular request? (Choose all that apply.) What feature of CloudSense provides a report on the virtual infrastructure, including hardware compatibility? In syslog, what is meant to identify the source and category of a message and is numbered from 0 to 23? Which of the following are proper alert levels for syslog? (Choose all that apply.) Level 7 syslog would often be used for which of the following? Select the protocol for sending mail. What feature of CloudSense allows you to assemble your own reports? UCS Central can scale to how many endpoints? Which are valid DHCP messages in an exchange for an IP address? (Choose all that apply.) Which VM reports are available in CloudSense? (Choose all that apply.) Where would you find good statistics on network, storage, and compute at the same time? UCS Performance Manager comes in which versions? (Choose all that apply.)
Cloud Monitoring
Cisco UCS Performance Manager and Capacity Management


Cisco UCS Manager and UCS Central Monitoring


Cisco UCS Director Capacity Management and Monitoring


Cisco UCS Director Dashboards


Service Request Monitoring, Logs, and Backup
Cisco UCS Director Logs


Cisco Prime Service Catalog Logs


Backups in UCS Director and Prime Service Catalog

Cloud Serviceability Options
Syslog

Network Time Protocol


Domain Name System


Dynamic Host Configuration Protocol
Simple Mail Transfer Protocol

Summary
Exam Essentials
Written Lab
Review Questions