
Chapter 11
Network Assurance
This chapter provides information and commands concerning the following topics:
Internet Control Message Protocol Redirect Messages
Internet Control Message Protocol (ICMP) is used to communicate to the original source the errors encountered while routing packets and to exercise control on the traffic. Routers use ICMP redirect messages to notify the hosts on the data link that a better route is available for a particular destination.
|
Disables ICMP redirects from this specific interface |
|
Reenables ICMP redirects from this specific interface |
The ping Command
|
Checks for Layer 3 connectivity with the device at IPv4 address w.x.y.z |
|
Checks for Layer 3 connectivity with the device at IPv6 address aaaa:aaaa:aaaa:aaaa:aaaa:aaaa:aaaa:aaaa |
|
Checks for Layer 3 connectivity with the device at IPv4 address 172.16.20.1 with the packets originating from source interface loopback 1 |
|
Checks for Layer 3 connectivity with the device at IPv6 address 2001::1 with the packets originating from source interface loopback 1 |
|
Enters extended ping mode, which provides more options |
Table 11-1 describes the possible ping output characters.
TABLE 11-1 ping Output Characters
Character |
Description |
! |
Each exclamation point indicates receipt of a reply |
. |
Each period indicates that the network server timed out while waiting for a reply |
? |
Unknown error |
@ |
Unreachable for unknown reason |
A |
Administratively unreachable. Usually means that an access control list (ACL) is blocking traffic |
B |
Packet too big |
H |
Host unreachable |
N |
Network unreachable (beyond scope) |
P |
Port unreachable |
R |
Parameter problem |
T |
Time exceeded |
U |
No route to host |
Examples of Using the ping and the Extended ping Commands
|
Performs a basic Layer 3 test to IPv4 address 172.16.20.1 |
|
Same as above but through the IP host name |
|
Checks for Layer 3 connectivity with the device at IPv6 address 2001:db8:d1a5:c900::2 |
|
Enters extended ping mode; can now change parameters of ping test |
|
Press |
|
Enter the target IP address |
|
Enter the number of echo requests you want to send. The default is 5 |
|
Enter the size of datagrams being sent. The default is 100 |
|
Enter the timeout delay between sending echo requests |
|
Allows you to configure extended commands |
|
Allows you to explicitly set where the pings are originating from. An interface name may also be used here |
|
Allows you to set the TOS field in the IP header |
|
Allows you to set the DF bit in the IP header |
|
Allows you to set whether you want validation |
|
Allows you to change the data pattern in the data field of the ICMP echo request packet |
|
Offers IP header options. This prompt offers more than one of the following options to be selected: Verbose is automatically selected along with any other option Record is a very useful option because it displays the address(es) of the hops (up to nine) the packet goes through Loose allows you to influence the path by specifying the address(es) of the hop(s) you want the packet to go through Strict is used to specify the hop(s) that you want the packet to go through, but no other hop(s) are allowed to be visited Timestamp is used to measure roundtrip time to particular hosts |
|
Allows you to vary the sizes of the echo packets that are sent |
Type escape sequence to !!!!!!!!!!!!!!!!!!!!!!!!!!! |

Tip
If you want to interrupt the ping operation, use the Ctrl-Shift-6 keystroke combination. This ends the operation and returns you to the prompt.
The traceroute Command
The traceroute command (or tracert in Microsoft Windows) is a utility that allows observation of the path between two hosts.
|
Discovers the route taken to travel to the IPv4 destination of 172.16.20.1 |
|
Shows command with IP host name rather than IP address |
|
Discovers the route taken to travel to the IPv6 destination of 2001:db8:d1a5:c900::2 |
|
Shows common shortcut spelling of the traceroute command |
Note
In Microsoft Windows operating systems, the command to allow observation between two hosts is tracert:
   C:Windowssystem32>tracert 172.16.20.1
   C:Windowssystem32>tracert 2001:db8:c:18:2::1
The debug Command
The output from debug privileged EXEC commands provides diagnostic information that includes a variety of internetworking events related to protocol status and network activity in general.
Caution
Using the debug command may severely affect router performance and might even cause the router to reboot. Always exercise caution when using the debug command, and do not leave it on. Use debug long enough to gather needed information, and then disable debugging with the undebug all or no debug all command.
Tip
Send your debug output to a syslog server to ensure that you have a copy of it in case your router is overloaded and needs to reboot. Use the no logging console command to turn off logging to the console if you have configured a syslog server to receive debug output.
|
Turns on all possible debugging Caution This is just an example. Do not use this command in a production network |
|
Turns off all possible debugging |
|
Lists what debug commands are on |
|
Turns on IPv4 packet debugging that matches the criteria defined in ACL 10 Note The debug ip packet command helps you to better understand the IP packet forwarding process, but this command only produces information on packets that are process-switched by the router. Packets generated by a router or destined for a router are process-switched and are therefore displayed with the debug ip packet command |
|
Displays debug output through a Telnet/SSH (a vty line connection) session (default is to only send output on the console screen) |
Conditionally Triggered Debugs
When the Conditionally Triggered Debugging feature is enabled, the router generates debugging messages for packets entering or leaving the router on a specified interface; the router does not generate debugging output for packets entering or leaving through a different interface.
Use the debug condition command to restrict the debug output for some commands.
If any debug condition commands are enabled, output is generated only for interfaces associated with the specified keyword. In addition, this command enables debugging output for conditional debugging events. Messages are displayed as different interfaces meet specific conditions.
If multiple debug condition commands are enabled, output is displayed if at least one condition matches. All the conditions do not need to match. The no form of this command removes the debug condition specified by the condition identifier.
The condition identifier is displayed after you use a debug condition command or in the output of the show debug condition command. If the last condition is removed, debugging output resumes for all interfaces. You will be asked for confirmation before removing the last condition or all conditions.
Not all debugging output is affected by the debug condition command. Some commands generate output whenever they are enabled, regardless of whether they meet any conditions.
|
Filters output on the basis of the specified interface |
|
Filters output on the basis of the specified IP address |
|
Filters messages on the specified MAC address |
|
Filters output on the basis of the specified username |
|
Filters output on the basis of the specified VLAN ID |
|
Displays which conditional debugs are enabled |
Configuring Secure SNMP
Simple Network Management Protocol (SNMP) is the most commonly used network management protocol. It is important to restrict SNMP access to the routers on which it is enabled.
Tip
If SNMP is not required on a router, you should turn it off by using the no snmp-server global configuration command:
Edmonton(config)# no snmp-server
Note
Beginning with SNMPv3, methods to ensure the secure transmission of data between manager and agent were added. You can now define a security policy per group, or limit IP addresses to which its members can belong. You now have to define encryption and hashing algorithms and passwords for each user.
Table 11-2 shows the different SNMP security models.
TABLE 11-2 SNMP Security Models
SNMP Version |
Access Mode |
Authentication |
Encryption |
SNMPv1 |
noAuthNoPriv |
Community string |
No |
SNMPv2c |
noAuthNoPriv |
Community string |
No |
SNMPv3 |
noAuthNoPriv authNoPriv authPriv |
Username MD5 or SHA-1 MD5 or SHA-1 |
No No DES, 3DES, or AES |
Tip
The SNMP security levels are as follows:
noAuthNoPriv: Authenticates SNMP messages using a community string. No encryption provided.
authNoPriv: Authenticates SNMP messages using either HMAC with MD5 or SHA-1. No encryption provided.
authPriv: Authenticates SNMP messages by using either HMAC-MD5 or SHA. Encrypts SNMP messages using DES, 3DES, or AES.
priv: Does not authenticate SNMP messages. Encrypts only using either DES or AES.
Tip
SNMPv3 provides all three security level options. It should be used wherever possible.
Tip
If SNMPv3 cannot be used, then use SNMPv2c and secure it using uncommon, complex community strings and by enabling read-only access.
Tip
If community strings are also used for SNMP traps, they must be different from community strings for get and set methods. This is considered best practice.
Securing SNMPv1 or SNMPv2c
|
Sets a community string named C0mpl3xAdmin. It is read-only and refers to ACL 98 to limit SNMP access to the authorized hosts Note A named ACL can be used as well |
|
Creates an ACL that will limit the SNMP access to the specific host of 192.168.10.3 |
|
Sets the Network Management System (NMS) IP address of 192.168.10.3 and the community string of AdminC0mpl3x, which will be used to protect the sending of the SNMP traps. The community string is also used to connect to the host |
Securing SNMPv3
|
Creates an ACL that will be used to limit SNMP access to the local device from SNMP managers within the 10.1.1.0/24 subnet |
|
Defines an SNMP view named MGMT to include an OID name of sysUpTime |
|
Defines an SNMP view named MGMT to include an OID name of ifDescr |
|
Defines an SNMP view named MGMT and an OID name of ifAdminStatus. This OID is included in the view |
|
Defines an SNMP view named MGMT and an OID name of ifOperStatus. This OID is included in the view |
|
Defines an SNMPv3 group called groupAAA and configures it with the authPriv security level. SNMP read and write access to the MGMT view is limited to devices defined in ACL 99 |
|
Configures a new user called userAAA to the SNMPv3 group groupAAA with authentication and encryption. Authentication uses SHA with a password of itsa5ecret. Encryption uses AES-256 with a password of another5ecret |
|
Enables SNMP traps |
|
Defines a receiving manager for traps at IP address 10.1.1.50. The user userAAA is used to authenticate the host. The traps sent relate to CPU and port security events |
|
Prevents index shuffle Note SNMP does not identify object instances by names but by numeric indexes. Index number may change due to instance changes, such as a new interface being configured. This command will guarantee index persistence when changes occur |
Verifying SNMP
|
Provides basic information about SNMP configuration |
|
Provides information about SNMP views |
|
Provides information about configured SNMP groups |
|
Provides information about configured SNMP users |
Implementing Logging
It is important for network administrators to implement logging to get insight into what is occurring in their network. When a router reloads, all local logs are lost, so it is important to implement logging to an external destination. The following sections deal with the different mechanisms that you can use to configure logging to a remote location.
Configuring Syslog
|
Enables logging to all supported destinations |
|
Sends logging messages to a syslog server host at address 192.168.10.53 |
|
Sends logging messages to a syslog server host named sysadmin |
|
Sets the syslog server logging level to value x, where x is a number between 0 and 7 or a word defining the level. Table 11-3 provides more details |
|
Stamps syslog messages with a sequence number |
|
Causes a time stamp to be included in syslog messages |
Syslog Message Format
The general format of syslog messages generated on Cisco IOS Software is as follows:
seq no:timestamp: %facility-severity-MNEMONIC:description
Item in Syslog Message |
Definition |
|
Sequence number. Stamped only if the service sequence- numbers global configuration command is configured |
|
Date and time of the message. Appears only if the service timestamps log datetime global configuration command is configured |
|
The facility to which the message refers (SNMP, SYS, and so on) |
|
Single-digit code from 0 to 7 that defines the severity of the message. See Table 11-3 for descriptions of the levels |
|
String of text that uniquely defines the message |
|
String of text that contains detailed information about the event being reported |
Syslog Severity Levels
Table 11-3 outlines the eight levels of severity in logging messages.
TABLE 11-3 Syslog Severity Levels
Level # |
Level Name |
Description |
0 |
Emergencies |
System is unusable |
1 |
Alerts |
Immediate action needed |
2 |
Critical |
Critical conditions |
3 |
Errors |
Error conditions |
4 |
Warnings |
Warning conditions |
5 |
Notifications |
Normal but significant conditions |
6 |
Informational |
Informational messages (default level) |
7 |
Debugging |
Debugging messages |
Setting a level means you will get that level and everything numerically below it; for example, setting level 6 means you will receive messages for levels 0 through 6.
Syslog Message Example
The easiest syslog message to use as an example is the one that shows up every time you exit from global configuration mode back to privileged EXEC mode. You have just finished entering a command and you want to save your work, but after you type exit you see something like this (your output will differ depending on whether you have sequence numbers and/or time/date stamps configured):
Edmonton(config)# exit
Edmonton#
*Oct 23:22:45:20.878: %SYS-5-CONFIG_I: Configured from console by
console
Edmonton#
So, what does this all mean?
No sequence number is part of this message
The message occurred on October 23, at 22:45:20.878 (or 10:45 PM, and 20.878 seconds)
It is a SYS message, and it is level 5 (a notification)
It is a CONFIG message, and the configuration occurred from the console
Configuring NetFlow
NetFlow is an application for collecting IP traffic information. It is used for network accounting and security auditing.
Caution
NetFlow consumes additional memory. If you have limited memory, you might want to preset the size of the NetFlow cache to contain a smaller amount of entries. The default cache size depends on the platform of the device.
|
Moves to interface configuration mode |
|
Enables NetFlow on the interface. Captures traffic that is being received by the interface |
|
Enables NetFlow on the interface. Captures traffic that is being transmitted by the interface |
|
Returns to global configuration mode |
|
Defines the IP address of the workstation to which you want to send the NetFlow information as well as the UDP port on which the workstation is listening for the information |
|
Specifies the version format that the export packets used |
Note
NetFlow exports data in UDP in one of five formats: 1, 5, 7, 8, 9. Version 9 is the most versatile, but is not backward compatible with versions 5 or 8. The default is version 1. Version 5 is the most commonly used format, but version 9 is the latest format and has some advantages for key technologies such as security, traffic analysis, and multicast.
Configuring Flexible NetFlow
Flexible NetFlow improves on original NetFlow by adding the capability to customize the traffic analysis parameters for your specific requirements. Flexible NetFlow facilitates the creation of more complex configurations for traffic analysis and data export through the use of reusable configuration components. Flexible NetFlow is an extension of NetFlow v9.
Configuring Flexible NetFlow is a four-step process:
Step 1. Configure a flow record.
Step 2. Configure a flow exporter.
Step 3. Configure a flow monitor.
Step 4. Apply the flow monitor to an interface.
Step 1: Configure a Flow Record
|
Creates a new flow record called R1-FLOW-RECORD |
|
Includes the source IPv4 address to the flow record |
|
Includes the destination IPv4 address to the flow record |
|
Includes statistics on the number of bytes in the flow record |
Step 2: Configure a Flow Exporter
|
Creates a flow exporter called R1-FLOW-EXPORTER |
|
Specifies the IP address of the NetFlow collector |
Step 3: Configure a Flow Monitor
|
Creates a flow monitor called R1-FLOW-MONITOR |
|
Assigns the flow exporter to the flow monitor |
|
Assigns the flow record to the flow monitor |
Step 4: Apply the Flow Monitor to an Interface
|
Enters interface configuration mode |
|
Applies the flow monitor to the interface in the input direction |
Verifying NetFlow
|
Displays information about the interface, including NetFlow as being either ingress or egress enabled |
|
Verifies status and statistics for NetFlow accounting data export |
|
Displays a summary of NetFlow statistics on a Cisco IOS router |
|
Displays a summary of the Flexible NetFlow configuration |
|
Displays information about the Flexible NetFlow exporter configuration |
|
Displays information about the configured Flexible NetFlow records |
Note
The show ip cache flow command is useful for seeing which protocols use the highest volume of traffic and between which hosts this traffic flows.
Implementing Port Mirroring
Using a traffic sniffer can be a valuable tool to monitor and troubleshoot a network. In the modern era of switches, using the Switched Port Analyzer (SPAN) feature enables you to instruct a switch to send copies of packets seen on one port to another port on the same switch.
Default SPAN and RSPAN Configuration
Table 11-4 shows the default SPAN and remote SPAN (RSPAN) settings.
TABLE 11-4 SPAN and RSPAN Default Settings
Feature |
Default Setting |
SPAN state (SPAN and RSPAN) |
Disabled |
Source port traffic to monitor |
Both received and sent traffic (both SPAN and RSPAN) |
Encapsulation type (destination port) |
Native form (untagged packets) |
Ingress forwarding (destination port) |
Disabled |
VLAN filtering |
On a trunk interface used as a source port, all VLANs are monitored |
RSPAN VLANs |
None configured |
Configuring Local SPAN
Local SPAN supports a SPAN session entirely within one switch; all source ports or source VLANs and destination ports are in the same switch or switch stack. Local SPAN copies traffic from one or more source ports in any VLAN or from one or more VLANs to a destination port for analysis.
Local SPAN Guidelines for Configuration
When configuring SPAN, follow these guidelines:
For SPAN sources, you can monitor traffic for a single port or VLAN or a series or range of ports or VLANs for each session. You cannot mix source ports and source VLANs within a single SPAN session.
The destination port cannot be a source port; a source port cannot be a destination port.
You cannot have two SPAN sessions using the same destination port.
When you configure a switch port as a SPAN destination port, it is no longer a normal switch port; only monitored traffic passes through the SPAN destination port.
Entering SPAN configuration commands does not remove previously configured SPAN parameters. You must enter the no monitor session {session_number | all | local | remote} global configuration command to delete configured SPAN parameters.
For local SPAN, outgoing packets through the SPAN destination port carry the original encapsulation headers (untagged or IEEE 802.1Q) if the encapsulation replicate keywords are specified. If the keywords are not specified, the packets are sent in native form. For RSPAN destination ports, outgoing packets are not tagged.
You can configure a disabled port to be a source or destination port, but the SPAN function does not start until the destination port and at least one source port or source VLAN are enabled.
You can limit SPAN traffic to specific VLANs by using the filter vlan keywords. If a trunk port is being monitored, only traffic on the VLANs specified with these keywords are monitored. By default, all VLANs are monitored on a trunk port.
You cannot mix source VLANs and filter VLANs within a single SPAN session.
Configuration Example: Local SPAN
Figure 11-1 is the network topology for local SPAN commands.
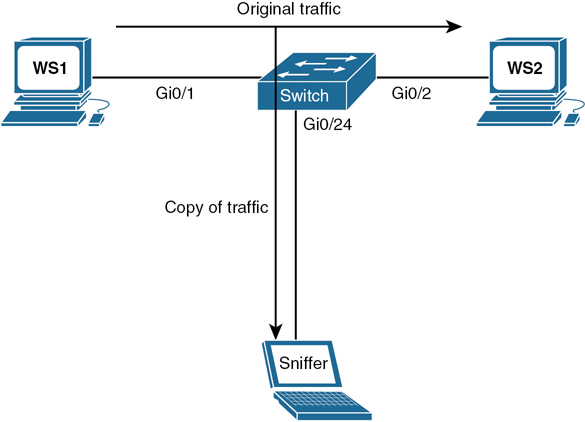
Figure 11-1 Local SPAN
|
Removes any existing SPAN configuration on session 1. The session number is a number between 1 and 66 |
|
Removes all SPAN sessions |
|
Removes all local SPAN sessions |
|
Removes all remote SPAN sessions |
|
Sets a new SPAN session where the source of the traffic will be interface GigabitEthernet 0/1 |
|
Configures session 2 to monitor received traffic on interface GigabitEthernet 0/2 |
|
Options for this command include the following: session_number: Any number between 1 and 66 interface-id: Specifies the source port to monitor. Can be any valid physical interface or port channel logical interface vlan-id: Specifies the source VLAN to monitor. The range is 1 to 4094 |
, | - (optional): To be used to help specify a series or ranges of interfaces. There must be a space both before and after the comma or hyphen both (optional): Monitors both received and sent traffic. This is the default setting rx (optional): Monitors received traffic tx (optional): Monitors sent traffic Note A single session can include multiple sources (ports or VLANs), defined in a series of commands, but you cannot combine source ports and source VLANs in one session Note You can use the monitor session session_number source command multiple times to configure multiple source ports |
|
|
Limits the SPAN source traffic to VLANs 6 to 10 |
|
Options for this command include the following: session_number: Must match the session number used in the monitor session source command vlan-id: Specifies the source VLAN to monitor. The range is 1 to 4094 , | - (optional): To be used to help specify a series or ranges of interfaces. There must be a space both before and after the comma or hyphen |
|
Sets a new SPAN session where the destination for the traffic will be interface GigabitEthernet 0/24. The encapsulation method will be retained |
|
Monitored traffic from session 2 will be sent to interface GigabitEthernet 0/24. It will have the same egress encapsulation type as the source port, and will enable ingress forwarding with IEEE 802.1Q encapsulation and VLAN 6 as the default ingress VLAN |
|
Options for this command include the following: session_number: Enter the session number used in the source command earlier in this example. For local SPAN, you must use the same session number for the source and destination interfaces interface-id: Specifies the destination port. This must be a physical port; it cannot be an EtherChannel, and it cannot be a VLAN , | - (optional): To be used to help specify a series or ranges of interfaces. There must be a space both before and after the comma or hyphen encapsulation dot1q: Specifies that the destination interface use the IEEE 802.1Q encapsulation method encapsulation replicate: Specifies that the destination interface replicate the source interface encapsulation method Note If no encapsulation method is selected, the default is to send packets in native form (untagged) ingress dot1q vlan vlan-id: Accept incoming packets with IEEE 802.1Q encapsulation with the specified VLAN as the default VLAN ingress untagged vlan vlan-id: Accept incoming packets with untagged encapsulation with the specified VLAN as the default VLAN ingress vlan vlan-id: Accept incoming packets with untagged encapsulation with the specified VLAN as the default VLAN Note You can use the monitor session session_number destination command multiple times to configure multiple destination ports |
Configuring Remote SPAN
While local SPAN supports source and destination ports only on one switch, a remote SPAN supports source and destination ports on different switches. RSPAN consists of an RSPAN VLAN, an RSPAN source session, and an RSPAN destination session. You separately configure RSPAN source sessions and destination sessions on different switches.
Remote SPAN Guidelines for Configuration
When configuring RSPAN, follow these guidelines:
All the items in the local SPAN guidelines for configuration apply to RSPAN.
Because RSPAN VLANs have special properties, you should reserve a few VLANs across your network for use as RSPAN VLANs; do not assign access ports to these VLANs.
You can apply an output access control list (ACL) to RSPAN traffic to selectively filter or monitor specific packets. Specify this ACL on the RSPAN VLAN in the RSPAN source switches.
For RSPAN configuration, you can distribute the source ports and the destination ports across multiple switches in your network.
RSPAN does not support bridge protocol data unit (BPDU) packet monitoring or other Layer 2 switch protocols.
The RSPAN VLAN is configured only on trunk ports and not on access ports. To avoid unwanted traffic in RSPAN VLANs, make sure that the VLAN Remote SPAN feature is supported in all the participating switches.
Access ports (including voice VLAN ports) on the RSPAN VLAN are put in the inactive state.
RSPAN VLANs are included as sources for port-based RSPAN sessions when source trunk ports have active RSPAN VLANs. RSPAN VLANs can also be sources in SPAN sessions. However, because the switch does not monitor spanned traffic, it does not support egress spanning of packets on any RSPAN VLAN identified as the destination of an RSPAN source session on the switch.
You can configure any VLAN as an RSPAN VLAN as long as these conditions are met:
The same RSPAN VLAN is used for an RSPAN session in all the switches.
All participating switches support RSPAN.
Configure an RSPAN VLAN before you configure an RSPAN source or a destination session.
If you enable VTP and VTP pruning, RSPAN traffic is pruned in the trunks to prevent the unwanted flooding of RSPAN traffic across the network for VLAN IDs that are lower than 1005.
Configuration Example: Remote SPAN
Figure 11-2 is the network topology for remote SPAN commands.

Figure 11-2 Remote SPAN
|
Creates VLAN 901 on Switch1 |
|
Makes this VLAN an RSPAN VLAN |
|
Returns to global configuration mode |
|
Creates VLAN 901 on Switch2 |
|
Makes this VLAN an RSPAN VLAN |
|
Returns to global configuration mode |
Note
You must create the RSPAN VLAN in all switches that will participate in RSPAN.
Note
If the RSPAN VLAN ID is in the normal range (lower than 1005) and VTP is enabled in the network, you can create the RSPAN VLAN in one switch, and VTP propagates it to the other switches in the VTP domain. For extended-range VLANs (greater than 1005), you must configure the RSPAN VLAN on both source and destination switches and any intermediate switches.
Tip
Use VTP pruning to get an efficient flow of RSPAN traffic, or manually delete the RSPAN VLAN from all trunks that do not need to carry the RSPAN traffic.
|
Removes any previous configurations for session 1 |
|
Configures session 1 to monitor transmitted traffic on interface GigabitEthernet 0/1 |
|
Configures session 1 to monitor received traffic on interface GigabitEthernet 0/2 |
|
Configures session 1 to have a destination of RSPAN VLAN 901 |
|
Removes any previous configurations for session 1 |
|
Configures session 1 to have a source of VLAN 901 |
|
Configures session 1 to have a destination interface of GigabitEthernet 0/24 |
Note
The commands to configure incoming traffic on a destination port and to filter VLAN traffic are the same for remote SPAN as they are for local SPAN.
Configuring Encapsulated RSPAN (ERSPAN)
The Cisco ERSPAN feature allows you to monitor traffic on one or more ports or one or more VLANs, and send the monitored traffic to one or more destination ports. ERSPAN sends traffic to a network analyzer such as a Switch Probe device or other Remote Monitoring (RMON) probe. ERSPAN supports source ports, source VLANs, and destination ports on different routers, which provides remote monitoring of multiple routers across a network. The traffic is encapsulated in Generic Routing Encapsulation (GRE) and is, therefore, routable across a Layer 3 network between the “source” switch and the “destination” switch. ERSPAN consists of an ERSPAN source session, routable ERSPAN GRE encapsulated traffic, and an ERSPAN destination session.
Note
ERSPAN is a Cisco proprietary feature and is available only to Catalyst 6500, 7600, 9200, 9300, Nexus, and ASR 1000 platforms to date. The ASR 1000 supports ERSPAN source (monitoring) only on FastEthernet, GigabitEthernet, and port-channel interfaces.
ERSPAN Source Configuration
|
Creates an ERSPAN source session |
|
Assigns the GigabitEthernet 0/0/1 interface as the source interface for the ERSPAN session |
|
Enters ERSPAN destination configuration mode |
|
Assigns an ERSPAN ID of 1 |
|
Defines the ERSPAN destination IP address |
|
Defines the ERSPAN source IP address |
ERSPAN Destination Configuration
|
Creates an ERSPAN destination session |
|
Assigns the GigabitEthernet 0/0/1 interface as the destination interface for the ERSPAN session |
|
Enters ERSPAN source configuration mode |
|
Assigns an ERSPAN ID of 1 |
|
Defines the ERSPAN source IP address |
Verifying and Troubleshooting Local and Remote SPAN
|
Displays output for SPAN session 1 Note On some platforms the command is show monitor |
|
Displays configuration of sessions running in active memory |
|
Displays information about VLANs configured as RSPAN VLANs |
|
Displays all SPAN debugging messages |
|
Displays SPAN port and VLAN list tracing |
|
Displays SPAN requests |
Configuring Network Time Protocol
Most networks today are being designed with high performance and reliability in mind. Delivery of content is, in many cases, guaranteed by service level agreements (SLAs). Having your network display an accurate time is vital to ensuring that you have the best information possible when reading logging messages or troubleshooting issues.
NTP Configuration
|
Configures the Edmonton router to synchronize its clock to a public NTP server at address 209.165.200.254 Note This command makes the Edmonton router an NTP client to the external NTP server Note A Cisco IOS router can be both a client to an external NTP server and an NTP server to client devices inside its own internal network Note When NTP is enabled on a Cisco IOS router, it is enabled on all interfaces Caution NTP is slow to converge. It can take up to 5 minutes before an NTP client synchronizes with an NTP server |
|
Specifies a preferred NTP server if multiple servers are configured Tip It is recommended to configure more than one NTP server |
|
Disables the NTP server function on a specific interface. The interface will still act as an NTP client Tip Use this command on interfaces connected to external networks |
|
Configures the router to be an NTP master clock to which peers synchronize when no external NTP source is available. The stratum is an optional number between 1 and 15. When enabled, the default stratum is 8 Note A reference clock (for example, an atomic clock) is said to be a stratum-0 device. A stratum-1 server is directly connected to a stratum-0 device. A stratum-2 server is connected across a network path to a stratum-1 server. The larger the stratum number (moving toward 15), the less authoritative that server is and the less accuracy it will have |
|
Configures the maximum number of NTP peer-and-client associations that the router will serve. The range is 0 to 4 294 967 295. The default is 100 |
|
Creates an access list statement that will allow NTP communication for the NTP server at address a.b.c.d. This ACL should be placed in an inbound direction |
Note
When a local device is configured with the ntp master command, it can be identified by a syntactically correct but invalid IP address. This address will be in the form of 127.127.x.x. The master will synchronize with itself and uses the 127.127.x.x address to identify itself. This address will be displayed with the show ntp associations command and must be permitted via an access list if you are authenticating your NTP servers.
NTP Design
You have two different options in NTP design: flat and hierarchical. In a flat design, all routers are peers to each other. Each router is both a client and a server with every other router. In a hierarchical model, there is a preferred order of routers that are servers and others that act as clients. You use the ntp peer command to determine the hierarchy. Figure 11-3 is a topology showing a hierarchical design.

Figure 11-3 NTP Hierarchical Design
Tip
Do not use the flat model in a large network, because with many NTP servers it can take a long time to synchronize the time.
|
Configures the source interface for all NTP packets |
|
Configures an IOS device to synchronize its software clock to a peer at 172.16.21.1 |
|
Configures an IOS device to synchronize its software clock to a peer at 172.16.21.1 using version 2 of NTP. There are three versions of NTP (versions 2–4) |
|
Configures the options for broadcasting or multicasting NTP traffic on a specified interface. You can include the authentication key and version options with this command |
|
Configures a device to receive NTP broadcast or multicast messages on a specified interface. You can include the authentication key and version options with this command |
Note
Although Cisco IOS recognizes three versions of NTP, versions 3 and 4 are most commonly used. Version 4 introduces support for IPv6 and is backward compatible with version 3. NTPv4 also adds DNS support for IPv6.
Note
NTPv4 has increased security support using public key cryptography and X.509 certificates.
Note
NTPv3 uses broadcast messages. NTPv4 uses multicast messages.
|
Configures an IOS device to synchronize its software clock to a peer at 172.16.21.1. The source IP address is the address of interface Loopback 0 Tip Choose a loopback interface as your source for NTP, because it will never go down. ACL statements will also be easier to write as you will require only one line to allow or deny traffic |
|
Makes this peer the preferred peer that provides synchronization |
Securing NTP
You can secure NTP operation using authentication and access lists.
Enabling NTP Authentication
|
Defines an NTP authentication key 1 = number of authentication key. Can be a number between 1 and 4 294 967 295 md5 = using MD5 hash. This is the only option available on Cisco devices NTPpa55word = password associated with this key |
|
Defines which keys are valid for NTP authentication. The key number here must match the key number you defined in the ntp authentication-key command |
|
Enables NTP authentication |
|
Defines an NTP authentication key |
|
Defines the NTP server that requires authentication at address 192.168.200.1 and identifies the peer key number as key 1 |
|
Defines which keys are valid for NTP authentication. The key number here must match the key number you defined in the ntp authentication-key command |
|
Enables NTP authentication |
Note
You can configure the device to authenticate the time sources to which the local clock is synchronized. When you enable NTP authentication, the device synchronizes to a time source only if the source carries one of the authentication keys specified by the ntp trusted-key command. The device drops any packets that fail the authentication check and prevents them from updating the local clock. NTP authentication is disabled by default.
You can also control access to NTP services by using access lists. Specifically, you can decide the types of requests that the device allows and the servers from which it accepts responses. If you do not configure any ACLs, NTP access is granted to all devices. If you configure ACLs, NTP access is granted only to the remote device whose source IP address passes the access list criteria.
Note
Once a device is synchronized to an NTP source, it becomes an NTP server to any device that requests synchronization.
Limiting NTP Access with Access Lists
|
Defines an access list that permits only packets with a source address of 10.1.x.x |
|
Creates an access group to control NTP access and applies access list 1. The peer keyword enables the device to receive time requests and NTP control queries and to synchronize itself to servers specified in the access list |
|
Creates an access group to control NTP access and applies access list 1. The serve keyword enables the device to receive time requests and NTP control queries from the servers specified in the access list but not to synchronize itself to the specified servers |
|
Creates an access group to control NTP access and applies access list 1. The serve-only keyword enables the device to receive only time requests from servers specified in the access list |
|
Creates an access group to control NTP access and applies access list 1. The query-only keyword enables the device to receive only NTP control queries from the servers specified in the access list |
Note
NTP access group options are scanned from least restrictive to most restrictive in the following order: peer, serve, serve-only, query-only. However, if NTP matches a deny ACL rule in a configured peer, ACL processing stops and does not continue to the next access group option.
Verifying and Troubleshooting NTP
|
Displays the status of NTP associations |
|
Displays detailed information about each NTP association |
|
Displays the status of the NTP configuration. This command shows whether the router’s clock has synchronized with the external NTP server |
|
Checks to see whether NTP packets are received and sent |
|
Limits debug output to ACL 1 |
|
Displays debug output for NTP clock adjustments |
|
Displays all NTP debugging output |
|
Displays all NTP debugging events |
|
Displays NTP packet debugging; lets you see the time that the peer/server gives you in a received packet |
|
Displays detailed NTP packet dump |
|
Displays debugging from NTP peer at address a.b.c.d |
Setting the Clock on a Router
Note
It is important to have your routers display the correct time for use with time stamps and other logging features.
If the system is synchronized by a valid outside timing mechanism, such as an NTP server, or if you have a router with a hardware clock, you do not need to set the software clock. Use the software clock if no other time sources are available.
|
Manually sets the system hardware clock. Time is set using military (24-hour) format. The hardware clock runs continuously, even if the router is powered off or rebooted |
|
Displays the hardware calendar |
|
Configures the system as an authoritative time source for a network based on its hardware clock Note Because the hardware clock is not as accurate as other time sources (it runs off of a battery), you should use this only when a more accurate time source (such as NTP) is not available |
|
Manually reads the hardware clock settings into the software clock |
|
Manually sets the system software clock. Time is set using military (24-hour) format |
|
Configures the system to automatically switch to summer time (daylight saving time) Note Summer time is disabled by default Arguments for the command are as follows: zone: Name of the time zone (see Tables 11-5 and 11-6 for alternative ways to specify the time zone) recurring: Indicates that summer time should start and end on the corresponding specified days every year date: Indicates that summer time should start on the first specific date listed in the command and end on the second specific date in the command week: (Optional) Week of the month (1 to 4 or last) day: (Optional) Day of the week (Sunday, Monday, and so on) date: Date of the month (1 to 31) month: (Optional) Month (January, February, and so on) year: Year (1993 to 2035) hh:mm: (Optional) Time (military format) in hours and minutes offset: (Optional) Number of minutes to add during summer time (default is 60) |
|
Configures the time zone for display purposes. To set the time to Coordinated Universal Time (UTC), use the no form of this command zone: Name of the time zone to be displayed when standard time is in effect hours-offset: Hours difference from UTC minutes-offset: (Optional) Minutes difference from UTC |
|
Configures the time zone to Pacific Standard Time, which is 8 hours behind UTC |
|
Configures the time zone to Newfoundland time for Newfoundland, Canada, which is 3.5 hours behind UTC |
|
Updates the hardware clock from the software clock |
|
Displays the time and date from the system software clock |
|
Displays the clock source (NTP, hardware) and the current summer-time setting (if any) |
Table 11-5 shows the common acronyms used for setting the time zone on a router.
TABLE 11-5 Common Time Zone Acronyms
Region/Acronym |
Time Zone Name and UTC Offset |
Europe |
|
GMT |
Greenwich Mean Time, as UTC |
BST |
British Summer Time, as UTC +1 hour |
IST |
Irish Summer Time, as UTC +1 hour |
WET |
Western Europe Time, as UTC |
WEST |
Western Europe Summer Time, as UTC +1 hour |
CET |
Central Europe Time, as UTC +1 |
CEST |
Central Europe Summer Time, as UTC +2 |
EET |
Eastern Europe Time, as UTC +2 |
EEST |
Eastern Europe Summer Time, as UTC +3 |
MSK |
Moscow Time, as UTC +3 |
MSD |
Moscow Summer Time, as UTC +4 |
United States and Canada |
|
AST |
Atlantic Standard Time, as UTC –4 hours |
ADT |
Atlantic Daylight Time, as UTC –3 hours |
ET |
Eastern Time, either as EST or EDT, depending on place and time of year |
EST |
Eastern Standard Time, as UTC –5 hours |
EDT |
Eastern Daylight Time, as UTC –4 hours |
CT |
Central Time, either as CST or CDT, depending on place and time of year |
CST |
Central Standard Time, as UTC –6 hours |
CDT |
Central Daylight Time, as UTC –5 hours |
MT |
Mountain Time, either as MST or MDT, depending on place and time of year |
MST |
Mountain Standard Time, as UTC –7 hours |
MDT |
Mountain Daylight Time, as UTC –6 hours |
PT |
Pacific Time, either as PST or PDT, depending on place and time of year |
PST |
Pacific Standard Time, as UTC –8 hours |
PDT |
Pacific Daylight Time, as UTC –7 hours |
AKST |
Alaska Standard Time, as UTC –9 hours |
AKDT |
Alaska Standard Daylight Time, as UTC –8 hours |
HST |
Hawaiian Standard Time, as UTC –10 hours |
Australia |
|
WST |
Western Standard Time, as UTC +8 hours |
CST |
Central Standard Time, as UTC +9.5 hours |
EST |
Eastern Standard/Summer time, as UTC +10 hours (+11 hours during summer time) |
Table 11-6 lists an alternative method for referring to time zones, in which single letters are used to refer to the time zone difference from UTC. Using this method, the letter Z is used to indicate the zero meridian, equivalent to UTC, and the letter J (Juliet) is used to refer to the local time zone. Using this method, the international date line is between time zones M and Y.
TABLE 11-6 Single-Letter Time Zone Designators
Letter Designator |
Word Designator |
Difference from UTC |
Y |
Yankee |
UTC –12 hours |
X |
X-ray |
UTC –11 hours |
W |
Whiskey |
UTC –10 hours |
V |
Victor |
UTC –9 hours |
U |
Uniform |
UTC –8 hours |
T |
Tango |
UTC –7 hours |
S |
Sierra |
UTC –6 hours |
R |
Romeo |
UTC –5 hours |
Q |
Quebec |
UTC –4 hours |
P |
Papa |
UTC –3 hours |
O |
Oscar |
UTC –2 hours |
N |
November |
UTC –1 hour |
Z |
Zulu |
Same as UTC |
A |
Alpha |
UTC +1 hour |
B |
Bravo |
UTC +2 hours |
C |
Charlie |
UTC +3 hours |
D |
Delta |
UTC +4 hours |
E |
Echo |
UTC +5 hours |
F |
Foxtrot |
UTC +6 hours |
G |
Golf |
UTC +7 hours |
H |
Hotel |
UTC +8 hours |
I |
India |
UTC +9 hours |
K |
Kilo |
UTC +10 hours |
L |
Lima |
UTC +11 hours |
M |
Mike |
UTC +12 hours |
Using Time Stamps
|
Adds a time stamp to all system logging messages |
|
Adds a time stamp to all debugging messages |
|
Adds a time stamp along with the total uptime of the router to all debugging messages |
|
Adds a time stamp displaying the local time and the date to all debugging messages |
|
Disables all time stamps |
Configuration Example: NTP
Figure 11-4 shows the network topology for the configuration that follows, which demonstrates how to configure NTP using the commands covered in this chapter.

Figure 11-4 Network Topology for NTP Configuration
Core1 Router
|
Configures router to synchronize its clock to a public NTP server at address 209.165.201.44 |
|
Configures router to synchronize its clock to a public NTP server at address 209.165.201.111 |
|
Configures router to synchronize its clock to a public NTP server at address 209.165.201.133 |
|
Configures router to synchronize its clock to a public NTP server at address 209.165.201.222 |
|
Configures router to synchronize its clock to a public NTP server at address 209.165.201.233. This is the preferred NTP server |
|
Configures the maximum number of NTP peer-and-client associations that the router will serve |
|
Sets time zone to Eastern Standard Time |
|
Configures the system to automatically switch to summer time and to repeat on the same day |
|
Configures the router to serve as a master clock if the external NTP server is not available |
|
Sets the source of all NTP packets to 192.168.223.1, which is the address of Loopback 0 |
|
Sets access 1 list to permit packets coming from 127.127.1.1 |
|
Sets access list 2 to permit packets coming from 192.168.x.x |
|
Configures Core1 to peer with any devices identified in access list 1 |
|
Configures Core1 to receive only time requests from devices specified in the ACL |
Core2 Router
|
Configures router to synchronize its clock to a public NTP server at address 209.165.201.44 |
|
Configures router to synchronize its clock to a public NTP server at address 209.165.201.111 |
|
Configures router to synchronize its clock to a public NTP server at address 209.165.201.133 |
|
Configures router to synchronize its clock to a public NTP server at address 209.165.201.222 |
|
Configures router to synchronize its clock to a public NTP server at address 209.165.201.233. This is the preferred NTP server |
|
Configures the maximum number of NTP peer-and-client associations that the router will serve |
|
Sets time zone to Eastern Standard Time |
|
Configures the system to automatically switch to summer time and to repeat on the same day |
|
Configures the router to serve as a master clock if the external NTP server is not available |
|
Sets the source of all NTP packets to 192.168.224.1, which is the address of Loopback 0 |
|
Sets ACL 1 to permit packets coming from 127.127.1.1 |
|
Sets ACL 2 to permit packets coming from 192.168.x.x |
|
Configures Core2 to peer with any devices identified in ACL 1 |
|
Configures Core2 to receive only time requests from devices specified in the ACL |
DLSwitch1
|
Sets the source of all NTP packets to 192.168.225.1, which is the address of Loopback 0 |
|
Configures DLSwitch1 to synchronize its clock to an NTP server at address 192.168.223.1 |
|
Configures DLSwitch1 to synchronize its clock to an NTP server at address 192.168.224.1 |
|
Sets time zone to Eastern Standard Time |
|
Configures the system to automatically switch to summer time and to repeat on the same day |
DLSwitch2
|
Sets the source of all NTP packets to 192.168.226.1, which is the address of Loopback 0 |
|
Configures DLSwitch2 to synchronize its clock to an NTP server at address 192.168.223.1 |
|
Configures DLSwitch2 to synchronize its clock to an NTP server at address 192.168.224.1 |
|
Sets time zone to Eastern Standard Time |
|
Configures the system to automatically switch to summer time and to repeat on the same day |
ALSwitch1
|
Sets the source of all NTP packets to 192.168.227.1, which is the address of Loopback 0 |
|
Configures ALSwitch1 to synchronize its clock to an NTP server at address 192.168.223.1 |
|
Configures ALSwitch1 to synchronize its clock to an NTP server at address 192.168.224.1 |
|
Sets time zone to Eastern Standard Time |
|
Configures the system to automatically switch to summer time and to repeat on the same day |
ALSwitch2
|
Sets the source of all NTP packets to 192.168.228.1, which is the address of Loopback 0 |
|
Configures ALSwitch2 to synchronize its clock to an NTP server at address 192.168.223.1 |
|
Configures ALSwitch2 to synchronize its clock to an NTP server at address 192.168.224.1 |
|
Sets time zone to Eastern Standard Time |
|
Configures the system to automatically switch to summer time and to repeat on the same day |
Tool Command Language (Tcl)
Tcl shell is a feature that is built into Cisco routers and switches that allows engineers to interact directly with the device by using various Tcl scripts. Tcl scripting has been around for quite some time and is a very useful scripting language. Tcl provides many ways to streamline different tasks that can help with day-to-day operations and monitoring of a network. Some of the following are tasks that can be automated by using these scripts:
Verify IP and IPv6 reachability, using ping
Verify IP and IPv6 reachability, using traceroute
Check interface statistics
Retrieve SNMP information by accessing Management Information Base (MIB) objects
Send email messages containing CLI outputs from Tcl script
Most often, basic Tcl scripts are entered line by line within the Tcl shell, although, for some of the more advanced scripting methods, you can load the script into the flash of the device you are working on and execute the script from there using a command like source flash:ping.tcl from the Tcl shell.
A classic use case for Tcl scripting is when you need to perform network testing using ping. The following example shows the general syntax for a Tcl script:
|
This simple Tcl script automates a ping test to the 172.16.10.1, 172.16.10.2, and 172.16.10.3 addresses. Notice that the test executes as soon as you enter the closing brace The tclsh command grants you access to the Tcl shell The tclquit command returns you to privileged EXEC mode |
Embedded Event Manager (EEM)
Embedded Event Manager is a flexible system designed to customize Cisco IOS, XR, and NX-OS. EEM allows you to automate tasks, perform minor enhancements, and create workarounds. Applets and scripting are two pieces of EEM. Applets are a collection of CLI commands, while scripts are actions coded in Tcl. Event detectors are used by EEM, and actions provide notifications of the events. EEM event detectors include SNMP object monitoring, syslog message monitoring, interface counter monitoring, CLI event monitoring, and IP SLA and NetFlow event monitoring.
EEM actions can include sending an email, executing a CLI command, generating an SNMP trap, reloading a device, and generating specific syslog messages.
Note
The following examples assume that the first command is typed in global configuration mode.
EEM Configuration Examples
EEM Example 1
The first EEM example shows an applet that monitors the GigabitEthernet 0/0/0 interface. If a syslog message indicates that its state has changed to administratively down, the applet is triggered, the interface is re-enabled, and an email is sent containing a list of users currently logged into the router.
Notice the use of the $_cli_result keyword in the email configuration. This means that the email body will include the output of any CLI commands that were issued in the applet. In this case, the output of the show users command will be included in the debug and the email message.
event manager applet interface_Shutdown
event syslog pattern "Interface GigabitEthernet 0/0/0, changed state
to administratively down"
action 1.0 cli command "enable"
action 1.5 cli command "config terminal"
action 2.0 cli command "interface gigabitethernet0/0/0"
action 2.5 cli command "no shutdown"
action 3.0 cli command "end"
action 3.5 cli command "show users"
action 4.0 mail server 209.165.201.1 to [email protected] from EEM@
cisco.com subject "ISP1 Interface GigabitEthernet0/0/0 SHUT." body
"Current users $_cli_result"
end
EEM Example 2
The second EEM example shows an applet that monitors the CLI for the debug ip packet command. When this pattern is matched, the applet will skip the command so that it does not take effect. The action list first enters the enabled mode and issues the show users | append flash:Debug command. This command will append the output from the show users command to the end of a file in flash called Debug. The next action will then append the current time stamp to the end of the file in flash named Debug_clock. By matching the order of the entries in both files you will have a list of the users that tried to enter the debug command and the date and time that the user attempted it.
event manager applet Stop_Debug
 event cli pattern "debug ip packet" sync no skip yes
 action 1.0 cli command "enable"
 action 2.0 cli command "show users | append flash:Debug"
 action 3.0 cli command "show clock | append flash:Debug_clock"
end
EEM Example 3
The third EEM example shows an applet that matches a CLI pattern that starts with “wr”. When a match is detected, the applet is triggered. Cisco IOS prompting is disabled and a copy of the new startup-configuration file is backed up to a TFTP server. A syslog message is triggered confirming a successful TFTP file transfer. Notice that two environment variables were created and are used within the applet, one for the file name and one for the IP address.
event manager environment filename router.cfg
event manager environment tftpserver tftp://10.99.1.101/
event manager applet SAVE-to-TFTP
 event cli pattern "wr.*" sync yes
 action 1.0 cli command "enable"
 action 2.0 cli command "configure terminal"
 action 3.0 cli command "file prompt quiet"
 action 4.0 cli command "end"
 action 5.0 cli command "copy start $tftpserver$filename"
 action 6.0 cli command "configure terminal"
 action 7.0 cli command "no file prompt quiet"
 action 8.0 syslog priority informational msg "Running-config saved
to NVRAM! TFTP backup successful."
EEM Example 4
The final example is more complex but demonstrates how powerful EEM applets can be. This example is based on the latest version of EEM (version 4). In this scenario, an IP SLA is configured to send an ICMP echo request every 10 seconds to address 209.165.201.1. IP SLA reaction alerts are enabled, which allows the IP SLA to send an alert after three consecutive timeouts. This triggers the EEM applet and a syslog message is displayed. Notice the use of the $_ipsla_oper_id variable. This is a built-in environment variable and returns the IP SLA number, which in this case is 1.
ip sla 1
 icmp-echo 209.165.201.1
 frequency 10
ip sla schedule 1 life forever start-time now
ip sla reaction-configuration 1 react timeout threshold-type consecutive 3
ip sla enable reaction-alerts
!

event manager applet IPSLA
 event ipsla operation-id 1 reaction-type timeout
 action 1.0 syslog priority emergencies msg "IP SLA operation
$_ipsla_oper_id to ISP DNS server has timed out"
EEM and Tcl Scripts
Using an EEM applet to call Tcl scripts is another very powerful aspect of EEM. This example shows how to manually execute an EEM applet that will, in turn, execute a Tcl script that is locally stored in the device’s flash memory. It is important to understand that there are many ways to use EEM and that manually triggered applets are also a very useful tool. The following example depicts an EEM script that is configured with the event none command. This means that there is no automatic event that the applet is monitoring, and that this applet will only run when it is triggered manually. To manually run an EEM applet, the event manager run command must be used, as illustrated at the router prompt. In this example, the ping_script.tcl file is a Tcl script similar to the one described earlier in this chapter.
event manager applet myping
 event none
 action 1.0 cli command "enable"
 action 1.1 cli command "tclsh flash:/ping_script.tcl"


Router# event manager run myping
Router#
Verifying EEM
|
Displays actual actions taking place when an applet is running |
|
Displays all configured applets, their triggers and actions |
|
Displays the version of EEM that is supported in the Cisco IOS software |